This pipeline computes the correlation between significantly recurrent gene mutations and selected clinical features.
Testing the association between mutation status of 38 genes and 5 clinical features across 248 patients, 10 significant findings detected with Q value < 0.25.
-
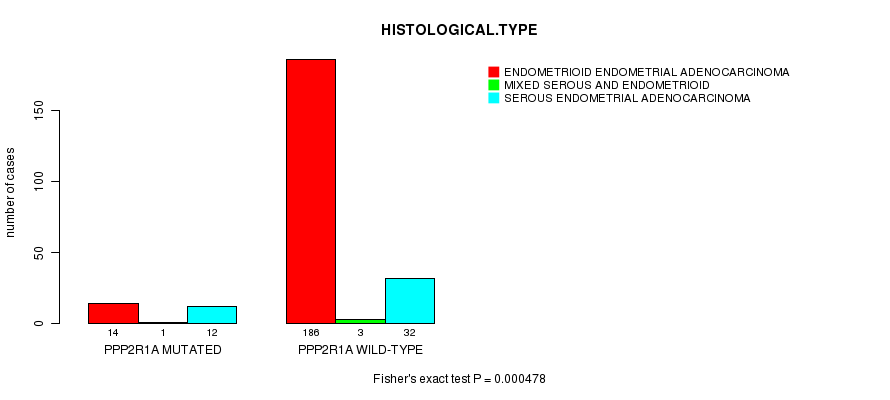
PPP2R1A mutation correlated to 'HISTOLOGICAL.TYPE'.
-
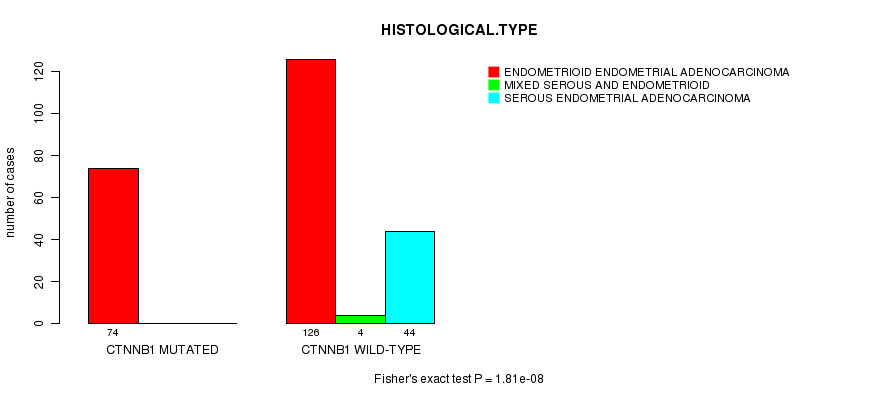
CTNNB1 mutation correlated to 'HISTOLOGICAL.TYPE'.
-
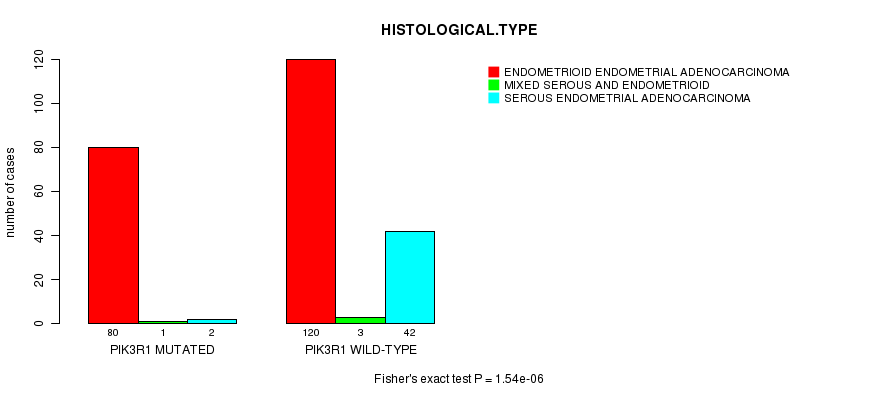
PIK3R1 mutation correlated to 'HISTOLOGICAL.TYPE'.
-
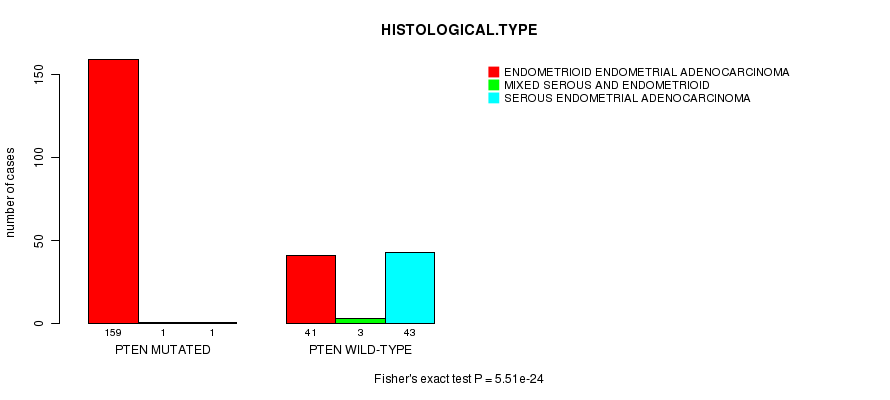
PTEN mutation correlated to 'HISTOLOGICAL.TYPE'.
-
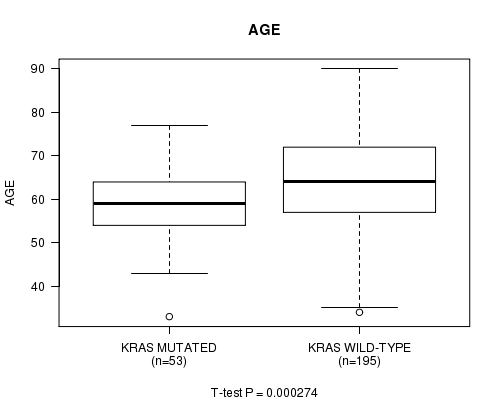
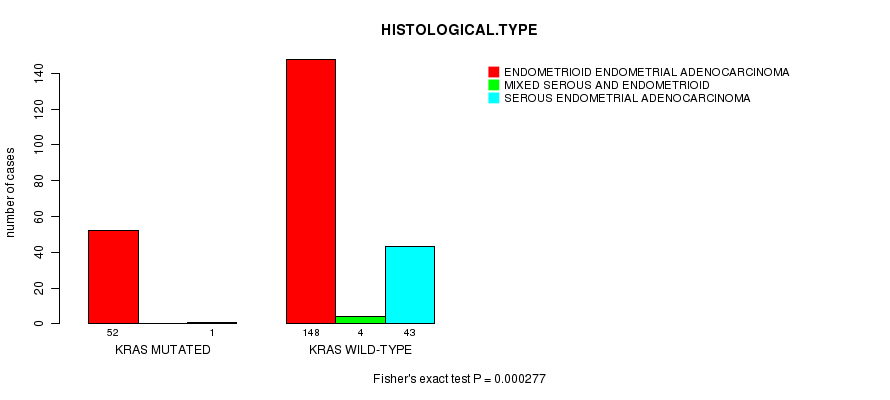
KRAS mutation correlated to 'AGE' and 'HISTOLOGICAL.TYPE'.
-
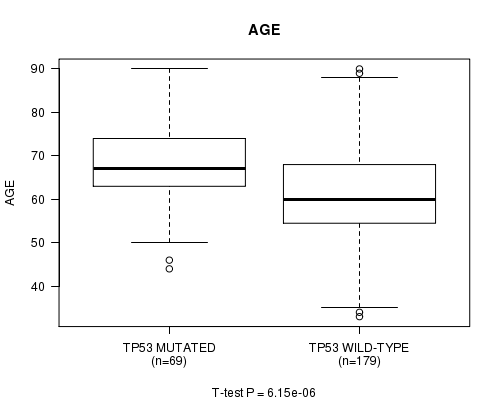
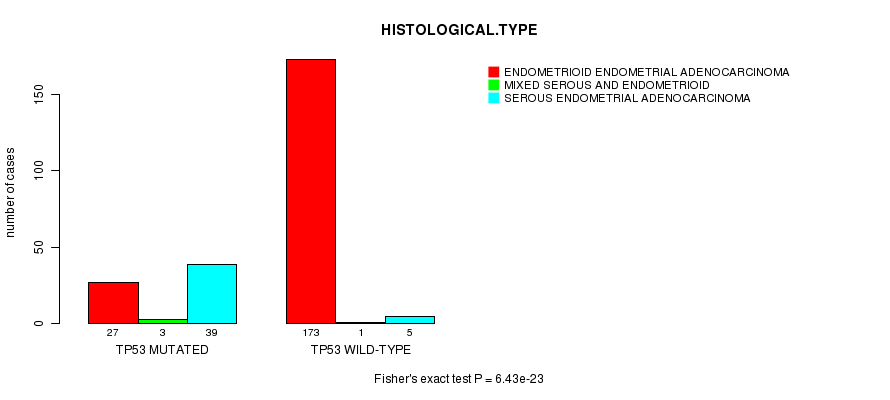
TP53 mutation correlated to 'AGE' and 'HISTOLOGICAL.TYPE'.
-
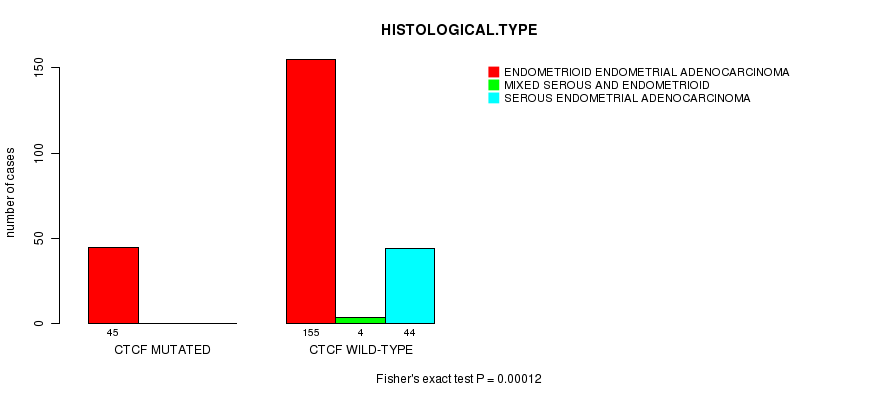
CTCF mutation correlated to 'HISTOLOGICAL.TYPE'.
-
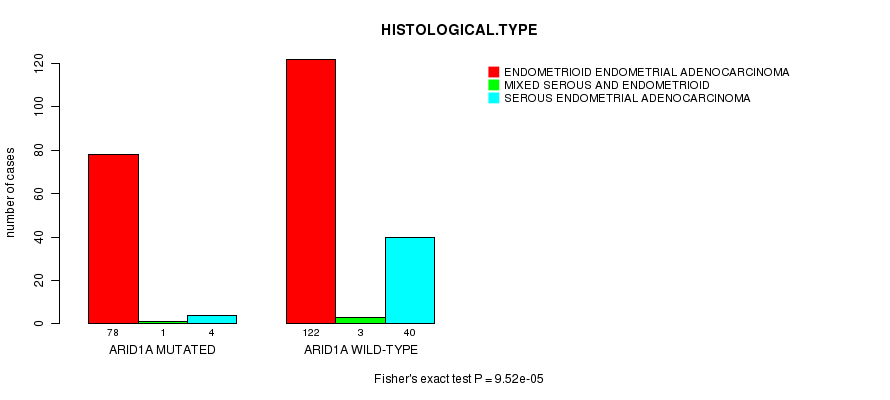
ARID1A mutation correlated to 'HISTOLOGICAL.TYPE'.
Table 1. Get Full Table Overview of the association between mutation status of 38 genes and 5 clinical features. Shown in the table are P values (Q values). Thresholded by Q value < 0.25, 10 significant findings detected.
|
Clinical Features |
Time to Death |
AGE |
HISTOLOGICAL TYPE |
RADIATIONS RADIATION REGIMENINDICATION |
COMPLETENESS OF RESECTION |
||
| nMutated (%) | nWild-Type | logrank test | t-test | Fisher's exact test | Fisher's exact test | Fisher's exact test | |
| KRAS | 53 (21%) | 195 |
0.0816 (1.00) |
0.000274 (0.0501) |
0.000277 (0.0504) |
0.253 (1.00) |
0.388 (1.00) |
| TP53 | 69 (28%) | 179 |
0.0263 (1.00) |
6.15e-06 (0.00114) |
6.43e-23 (1.22e-20) |
0.371 (1.00) |
0.175 (1.00) |
| PPP2R1A | 27 (11%) | 221 |
0.832 (1.00) |
0.0374 (1.00) |
0.000478 (0.0865) |
0.52 (1.00) |
1 (1.00) |
| CTNNB1 | 74 (30%) | 174 |
0.678 (1.00) |
0.0017 (0.306) |
1.81e-08 (3.4e-06) |
0.381 (1.00) |
0.302 (1.00) |
| PIK3R1 | 83 (33%) | 165 |
0.963 (1.00) |
0.806 (1.00) |
1.54e-06 (0.000289) |
0.395 (1.00) |
0.956 (1.00) |
| PTEN | 161 (65%) | 87 |
0.00636 (1.00) |
0.0276 (1.00) |
5.51e-24 (1.05e-21) |
0.0503 (1.00) |
0.0491 (1.00) |
| CTCF | 45 (18%) | 203 |
0.151 (1.00) |
0.0198 (1.00) |
0.00012 (0.0222) |
0.863 (1.00) |
0.869 (1.00) |
| ARID1A | 83 (33%) | 165 |
0.00558 (0.982) |
0.00721 (1.00) |
9.52e-05 (0.0176) |
0.673 (1.00) |
0.253 (1.00) |
| PIK3CA | 132 (53%) | 116 |
0.0344 (1.00) |
0.195 (1.00) |
0.252 (1.00) |
0.593 (1.00) |
0.184 (1.00) |
| PRKAR1B | 4 (2%) | 244 |
0.597 (1.00) |
0.978 (1.00) |
1 (1.00) |
0.608 (1.00) |
1 (1.00) |
| RPL22 | 31 (12%) | 217 |
0.494 (1.00) |
0.0279 (1.00) |
0.00513 (0.908) |
0.104 (1.00) |
0.748 (1.00) |
| FBXW7 | 39 (16%) | 209 |
0.791 (1.00) |
0.904 (1.00) |
0.00354 (0.633) |
0.855 (1.00) |
0.592 (1.00) |
| SPOP | 21 (8%) | 227 |
0.373 (1.00) |
0.527 (1.00) |
0.842 (1.00) |
0.811 (1.00) |
0.408 (1.00) |
| ARID5B | 29 (12%) | 219 |
0.792 (1.00) |
0.649 (1.00) |
0.0105 (1.00) |
1 (1.00) |
0.161 (1.00) |
| FGFR2 | 31 (12%) | 217 |
0.529 (1.00) |
0.998 (1.00) |
0.776 (1.00) |
1 (1.00) |
0.337 (1.00) |
| CCND1 | 15 (6%) | 233 |
0.532 (1.00) |
0.0556 (1.00) |
0.14 (1.00) |
0.4 (1.00) |
0.0735 (1.00) |
| SMTNL2 | 9 (4%) | 239 |
0.344 (1.00) |
0.53 (1.00) |
1 (1.00) |
1 (1.00) |
0.351 (1.00) |
| NFE2L2 | 15 (6%) | 233 |
0.658 (1.00) |
0.191 (1.00) |
0.14 (1.00) |
0.589 (1.00) |
0.789 (1.00) |
| CHD4 | 35 (14%) | 213 |
0.474 (1.00) |
0.418 (1.00) |
0.454 (1.00) |
0.565 (1.00) |
0.967 (1.00) |
| RBMX | 13 (5%) | 235 |
0.508 (1.00) |
0.161 (1.00) |
0.302 (1.00) |
0.142 (1.00) |
0.138 (1.00) |
| FAM9A | 14 (6%) | 234 |
0.282 (1.00) |
0.913 (1.00) |
0.437 (1.00) |
1 (1.00) |
0.859 (1.00) |
| MORC4 | 20 (8%) | 228 |
0.117 (1.00) |
0.0204 (1.00) |
0.269 (1.00) |
1 (1.00) |
1 (1.00) |
| HPD | 7 (3%) | 241 |
0.379 (1.00) |
0.0538 (1.00) |
0.427 (1.00) |
1 (1.00) |
0.517 (1.00) |
| CASP8 | 17 (7%) | 231 |
0.495 (1.00) |
0.652 (1.00) |
0.491 (1.00) |
1 (1.00) |
0.67 (1.00) |
| FOXA2 | 12 (5%) | 236 |
0.908 (1.00) |
0.531 (1.00) |
1 (1.00) |
0.229 (1.00) |
0.58 (1.00) |
| ABI1 | 4 (2%) | 244 |
0.615 (1.00) |
0.0342 (1.00) |
1 (1.00) |
0.302 (1.00) |
0.282 (1.00) |
| DNER | 18 (7%) | 230 |
0.497 (1.00) |
0.0414 (1.00) |
0.417 (1.00) |
0.44 (1.00) |
0.806 (1.00) |
| BCOR | 30 (12%) | 218 |
0.0523 (1.00) |
0.0419 (1.00) |
0.00812 (1.00) |
1 (1.00) |
0.337 (1.00) |
| BRS3 | 15 (6%) | 233 |
0.141 (1.00) |
0.133 (1.00) |
0.14 (1.00) |
0.4 (1.00) |
0.806 (1.00) |
| NRAS | 9 (4%) | 239 |
0.244 (1.00) |
0.616 (1.00) |
1 (1.00) |
0.722 (1.00) |
1 (1.00) |
| SGK1 | 15 (6%) | 233 |
0.831 (1.00) |
0.427 (1.00) |
0.47 (1.00) |
0.158 (1.00) |
0.122 (1.00) |
| TIAL1 | 11 (4%) | 237 |
0.282 (1.00) |
0.475 (1.00) |
0.352 (1.00) |
0.753 (1.00) |
0.639 (1.00) |
| RPL14 | 7 (3%) | 241 |
0.463 (1.00) |
0.677 (1.00) |
1 (1.00) |
0.428 (1.00) |
0.378 (1.00) |
| SIN3A | 21 (8%) | 227 |
0.42 (1.00) |
0.256 (1.00) |
0.276 (1.00) |
0.811 (1.00) |
1 (1.00) |
| SLC48A1 | 5 (2%) | 243 |
0.467 (1.00) |
0.645 (1.00) |
0.621 (1.00) |
0.663 (1.00) |
0.559 (1.00) |
| ZFHX3 | 44 (18%) | 204 |
0.65 (1.00) |
0.765 (1.00) |
0.0676 (1.00) |
0.73 (1.00) |
0.558 (1.00) |
| RNF43 | 12 (5%) | 236 |
0.247 (1.00) |
0.644 (1.00) |
0.289 (1.00) |
0.0039 (0.695) |
0.689 (1.00) |
| ZNF263 | 8 (3%) | 240 |
0.392 (1.00) |
0.219 (1.00) |
0.436 (1.00) |
1 (1.00) |
0.0554 (1.00) |
P value = 0.000478 (Fisher's exact test), Q value = 0.087
Table S1. Gene #1: 'PPP2R1A MUTATION STATUS' versus Clinical Feature #3: 'HISTOLOGICAL.TYPE'
| nPatients | ENDOMETRIOID ENDOMETRIAL ADENOCARCINOMA | MIXED SEROUS AND ENDOMETRIOID | SEROUS ENDOMETRIAL ADENOCARCINOMA |
|---|---|---|---|
| ALL | 200 | 4 | 44 |
| PPP2R1A MUTATED | 14 | 1 | 12 |
| PPP2R1A WILD-TYPE | 186 | 3 | 32 |
Figure S1. Get High-res Image Gene #1: 'PPP2R1A MUTATION STATUS' versus Clinical Feature #3: 'HISTOLOGICAL.TYPE'
P value = 1.81e-08 (Fisher's exact test), Q value = 3.4e-06
Table S2. Gene #3: 'CTNNB1 MUTATION STATUS' versus Clinical Feature #3: 'HISTOLOGICAL.TYPE'
| nPatients | ENDOMETRIOID ENDOMETRIAL ADENOCARCINOMA | MIXED SEROUS AND ENDOMETRIOID | SEROUS ENDOMETRIAL ADENOCARCINOMA |
|---|---|---|---|
| ALL | 200 | 4 | 44 |
| CTNNB1 MUTATED | 74 | 0 | 0 |
| CTNNB1 WILD-TYPE | 126 | 4 | 44 |
Figure S2. Get High-res Image Gene #3: 'CTNNB1 MUTATION STATUS' versus Clinical Feature #3: 'HISTOLOGICAL.TYPE'
P value = 1.54e-06 (Fisher's exact test), Q value = 0.00029
Table S3. Gene #4: 'PIK3R1 MUTATION STATUS' versus Clinical Feature #3: 'HISTOLOGICAL.TYPE'
| nPatients | ENDOMETRIOID ENDOMETRIAL ADENOCARCINOMA | MIXED SEROUS AND ENDOMETRIOID | SEROUS ENDOMETRIAL ADENOCARCINOMA |
|---|---|---|---|
| ALL | 200 | 4 | 44 |
| PIK3R1 MUTATED | 80 | 1 | 2 |
| PIK3R1 WILD-TYPE | 120 | 3 | 42 |
Figure S3. Get High-res Image Gene #4: 'PIK3R1 MUTATION STATUS' versus Clinical Feature #3: 'HISTOLOGICAL.TYPE'
P value = 5.51e-24 (Fisher's exact test), Q value = 1e-21
Table S4. Gene #6: 'PTEN MUTATION STATUS' versus Clinical Feature #3: 'HISTOLOGICAL.TYPE'
| nPatients | ENDOMETRIOID ENDOMETRIAL ADENOCARCINOMA | MIXED SEROUS AND ENDOMETRIOID | SEROUS ENDOMETRIAL ADENOCARCINOMA |
|---|---|---|---|
| ALL | 200 | 4 | 44 |
| PTEN MUTATED | 159 | 1 | 1 |
| PTEN WILD-TYPE | 41 | 3 | 43 |
Figure S4. Get High-res Image Gene #6: 'PTEN MUTATION STATUS' versus Clinical Feature #3: 'HISTOLOGICAL.TYPE'
P value = 0.000274 (t-test), Q value = 0.05
Table S5. Gene #8: 'KRAS MUTATION STATUS' versus Clinical Feature #2: 'AGE'
| nPatients | Mean (Std.Dev) | |
|---|---|---|
| ALL | 248 | 63.1 (11.1) |
| KRAS MUTATED | 53 | 58.8 (8.7) |
| KRAS WILD-TYPE | 195 | 64.3 (11.4) |
Figure S5. Get High-res Image Gene #8: 'KRAS MUTATION STATUS' versus Clinical Feature #2: 'AGE'
P value = 0.000277 (Fisher's exact test), Q value = 0.05
Table S6. Gene #8: 'KRAS MUTATION STATUS' versus Clinical Feature #3: 'HISTOLOGICAL.TYPE'
| nPatients | ENDOMETRIOID ENDOMETRIAL ADENOCARCINOMA | MIXED SEROUS AND ENDOMETRIOID | SEROUS ENDOMETRIAL ADENOCARCINOMA |
|---|---|---|---|
| ALL | 200 | 4 | 44 |
| KRAS MUTATED | 52 | 0 | 1 |
| KRAS WILD-TYPE | 148 | 4 | 43 |
Figure S6. Get High-res Image Gene #8: 'KRAS MUTATION STATUS' versus Clinical Feature #3: 'HISTOLOGICAL.TYPE'
P value = 6.15e-06 (t-test), Q value = 0.0011
Table S7. Gene #9: 'TP53 MUTATION STATUS' versus Clinical Feature #2: 'AGE'
| nPatients | Mean (Std.Dev) | |
|---|---|---|
| ALL | 248 | 63.1 (11.1) |
| TP53 MUTATED | 69 | 67.9 (9.4) |
| TP53 WILD-TYPE | 179 | 61.3 (11.2) |
Figure S7. Get High-res Image Gene #9: 'TP53 MUTATION STATUS' versus Clinical Feature #2: 'AGE'
P value = 6.43e-23 (Fisher's exact test), Q value = 1.2e-20
Table S8. Gene #9: 'TP53 MUTATION STATUS' versus Clinical Feature #3: 'HISTOLOGICAL.TYPE'
| nPatients | ENDOMETRIOID ENDOMETRIAL ADENOCARCINOMA | MIXED SEROUS AND ENDOMETRIOID | SEROUS ENDOMETRIAL ADENOCARCINOMA |
|---|---|---|---|
| ALL | 200 | 4 | 44 |
| TP53 MUTATED | 27 | 3 | 39 |
| TP53 WILD-TYPE | 173 | 1 | 5 |
Figure S8. Get High-res Image Gene #9: 'TP53 MUTATION STATUS' versus Clinical Feature #3: 'HISTOLOGICAL.TYPE'
P value = 0.00012 (Fisher's exact test), Q value = 0.022
Table S9. Gene #11: 'CTCF MUTATION STATUS' versus Clinical Feature #3: 'HISTOLOGICAL.TYPE'
| nPatients | ENDOMETRIOID ENDOMETRIAL ADENOCARCINOMA | MIXED SEROUS AND ENDOMETRIOID | SEROUS ENDOMETRIAL ADENOCARCINOMA |
|---|---|---|---|
| ALL | 200 | 4 | 44 |
| CTCF MUTATED | 45 | 0 | 0 |
| CTCF WILD-TYPE | 155 | 4 | 44 |
Figure S9. Get High-res Image Gene #11: 'CTCF MUTATION STATUS' versus Clinical Feature #3: 'HISTOLOGICAL.TYPE'
P value = 9.52e-05 (Fisher's exact test), Q value = 0.018
Table S10. Gene #12: 'ARID1A MUTATION STATUS' versus Clinical Feature #3: 'HISTOLOGICAL.TYPE'
| nPatients | ENDOMETRIOID ENDOMETRIAL ADENOCARCINOMA | MIXED SEROUS AND ENDOMETRIOID | SEROUS ENDOMETRIAL ADENOCARCINOMA |
|---|---|---|---|
| ALL | 200 | 4 | 44 |
| ARID1A MUTATED | 78 | 1 | 4 |
| ARID1A WILD-TYPE | 122 | 3 | 40 |
Figure S10. Get High-res Image Gene #12: 'ARID1A MUTATION STATUS' versus Clinical Feature #3: 'HISTOLOGICAL.TYPE'
-
Mutation data file = UCEC-TP.mutsig.cluster.txt
-
Clinical data file = UCEC-TP.clin.merged.picked.txt
-
Number of patients = 248
-
Number of significantly mutated genes = 38
-
Number of selected clinical features = 5
-
Exclude genes that fewer than K tumors have mutations, K = 3
For survival clinical features, the Kaplan-Meier survival curves of tumors with and without gene mutations were plotted and the statistical significance P values were estimated by logrank test (Bland and Altman 2004) using the 'survdiff' function in R
For continuous numerical clinical features, two-tailed Student's t test with unequal variance (Lehmann and Romano 2005) was applied to compare the clinical values between tumors with and without gene mutations using 't.test' function in R
For binary or multi-class clinical features (nominal or ordinal), two-tailed Fisher's exact tests (Fisher 1922) were used to estimate the P values using the 'fisher.test' function in R
For multiple hypothesis correction, Q value is the False Discovery Rate (FDR) analogue of the P value (Benjamini and Hochberg 1995), defined as the minimum FDR at which the test may be called significant. We used the 'Benjamini and Hochberg' method of 'p.adjust' function in R to convert P values into Q values.
In addition to the links below, the full results of the analysis summarized in this report can also be downloaded programmatically using firehose_get, or interactively from either the Broad GDAC website or TCGA Data Coordination Center Portal.