This pipeline uses various statistical tests to identify RPPAs whose expression levels correlated to selected clinical features.
Testing the association between 166 genes and 5 clinical features across 200 samples, statistically thresholded by Q value < 0.05, 3 clinical features related to at least one genes.
-
22 genes correlated to 'HISTOLOGICAL.TYPE'.
-
TP53|P53-R-V , AKT1 AKT2 AKT3|AKT_PS473-R-V , PGR|PR-R-V , CDH1|E-CADHERIN-R-V , ESR1|ER-ALPHA-R-V , ...
-
1 gene correlated to 'RADIATIONS.RADIATION.REGIMENINDICATION'.
-
CHEK1|CHK1_PS345-R-C
-
3 genes correlated to 'COMPLETENESS.OF.RESECTION'.
-
TP53|P53-R-V , ESR1|ER-ALPHA-R-V , BAK1|BAK-R-C
-
No genes correlated to 'Time to Death', and 'AGE'.
Complete statistical result table is provided in Supplement Table 1
Table 1. Get Full Table This table shows the clinical features, statistical methods used, and the number of genes that are significantly associated with each clinical feature at Q value < 0.05.
| Clinical feature | Statistical test | Significant genes | Associated with | Associated with | ||
|---|---|---|---|---|---|---|
| Time to Death | Cox regression test | N=0 | ||||
| AGE | Spearman correlation test | N=0 | ||||
| HISTOLOGICAL TYPE | ANOVA test | N=22 | ||||
| RADIATIONS RADIATION REGIMENINDICATION | t test | N=1 | yes | N=1 | no | N=0 |
| COMPLETENESS OF RESECTION | ANOVA test | N=3 |
Table S1. Basic characteristics of clinical feature: 'Time to Death'
| Time to Death | Duration (Months) | 0.6-185.8 (median=28.9) |
| censored | N = 180 | |
| death | N = 20 | |
| Significant markers | N = 0 |
Table S2. Basic characteristics of clinical feature: 'AGE'
| AGE | Mean (SD) | 62.73 (11) |
| Significant markers | N = 0 |
Table S3. Basic characteristics of clinical feature: 'HISTOLOGICAL.TYPE'
| HISTOLOGICAL.TYPE | Labels | N |
| ENDOMETRIOID ENDOMETRIAL ADENOCARCINOMA | 174 | |
| MIXED SEROUS AND ENDOMETRIOID | 3 | |
| SEROUS ENDOMETRIAL ADENOCARCINOMA | 23 | |
| Significant markers | N = 22 |
Table S4. Get Full Table List of top 10 genes differentially expressed by 'HISTOLOGICAL.TYPE'
| ANOVA_P | Q | |
|---|---|---|
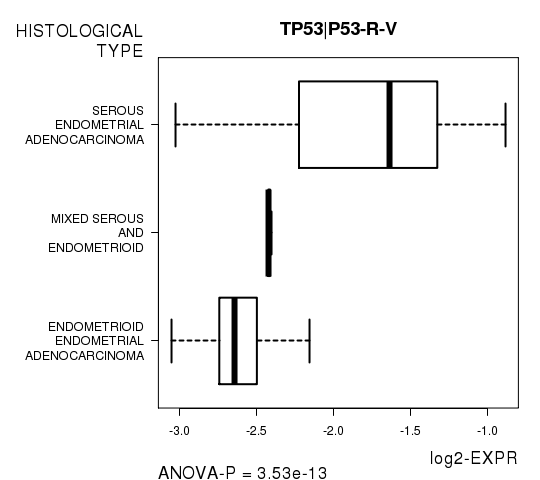
| TP53|P53-R-V | 3.531e-13 | 5.86e-11 |
| AKT1 AKT2 AKT3|AKT_PS473-R-V | 7.868e-09 | 1.3e-06 |
| PGR|PR-R-V | 1.195e-08 | 1.96e-06 |
| CDH1|E-CADHERIN-R-V | 1.945e-08 | 3.17e-06 |
| ESR1|ER-ALPHA-R-V | 2.978e-08 | 4.82e-06 |
| CHEK2|CHK2_PT68-R-C | 1.102e-07 | 1.77e-05 |
| CDC2|CDK1-R-V | 1.482e-07 | 2.37e-05 |
| AKT1 AKT2 AKT3|AKT_PT308-R-V | 1.476e-06 | 0.000235 |
| ESR1|ER-ALPHA_PS118-R-V | 3.174e-06 | 0.000501 |
| PTEN|PTEN-R-V | 5.508e-06 | 0.000865 |
Figure S1. Get High-res Image As an example, this figure shows the association of TP53|P53-R-V to 'HISTOLOGICAL.TYPE'. P value = 3.53e-13 with ANOVA analysis.
One gene related to 'RADIATIONS.RADIATION.REGIMENINDICATION'.
Table S5. Basic characteristics of clinical feature: 'RADIATIONS.RADIATION.REGIMENINDICATION'
| RADIATIONS.RADIATION.REGIMENINDICATION | Labels | N |
| NO | 80 | |
| YES | 120 | |
| Significant markers | N = 1 | |
| Higher in YES | 1 | |
| Higher in NO | 0 |
Table S6. Get Full Table List of one gene differentially expressed by 'RADIATIONS.RADIATION.REGIMENINDICATION'
| T(pos if higher in 'YES') | ttestP | Q | AUC | |
|---|---|---|---|---|
| CHEK1|CHK1_PS345-R-C | 3.69 | 0.0002956 | 0.0491 | 0.631 |
Figure S2. Get High-res Image As an example, this figure shows the association of CHEK1|CHK1_PS345-R-C to 'RADIATIONS.RADIATION.REGIMENINDICATION'. P value = 0.000296 with T-test analysis.
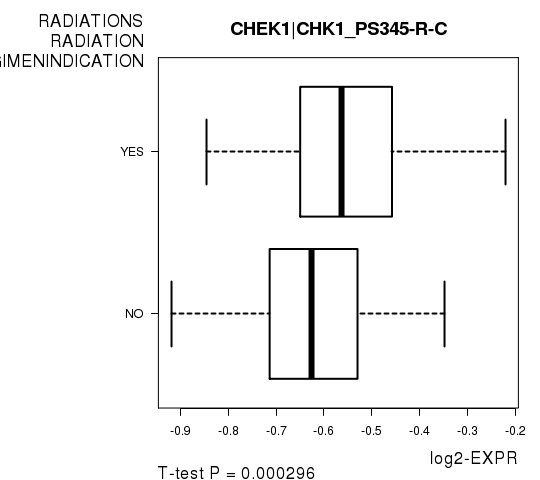
Table S7. Basic characteristics of clinical feature: 'COMPLETENESS.OF.RESECTION'
| COMPLETENESS.OF.RESECTION | Labels | N |
| R0 | 141 | |
| R1 | 9 | |
| R2 | 5 | |
| RX | 16 | |
| Significant markers | N = 3 |
Table S8. Get Full Table List of 3 genes differentially expressed by 'COMPLETENESS.OF.RESECTION'
| ANOVA_P | Q | |
|---|---|---|
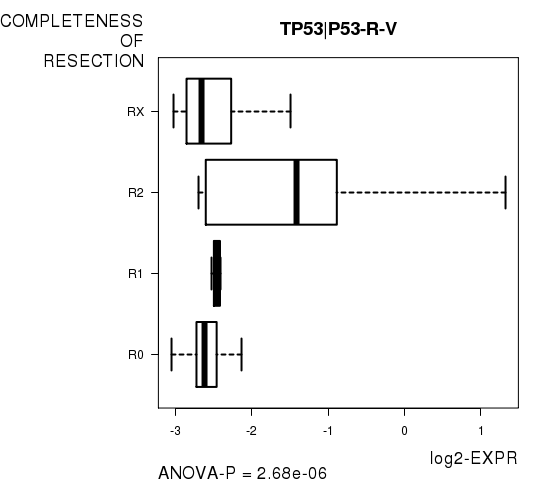
| TP53|P53-R-V | 2.677e-06 | 0.000444 |
| ESR1|ER-ALPHA-R-V | 0.0001445 | 0.0238 |
| BAK1|BAK-R-C | 0.0002593 | 0.0425 |
Figure S3. Get High-res Image As an example, this figure shows the association of TP53|P53-R-V to 'COMPLETENESS.OF.RESECTION'. P value = 2.68e-06 with ANOVA analysis.
-
Expresson data file = UCEC-TP.rppa.txt
-
Clinical data file = UCEC-TP.clin.merged.picked.txt
-
Number of patients = 200
-
Number of genes = 166
-
Number of clinical features = 5
For survival clinical features, Wald's test in univariate Cox regression analysis with proportional hazards model (Andersen and Gill 1982) was used to estimate the P values using the 'coxph' function in R. Kaplan-Meier survival curves were plot using the four quartile subgroups of patients based on expression levels
For continuous numerical clinical features, Spearman's rank correlation coefficients (Spearman 1904) and two-tailed P values were estimated using 'cor.test' function in R
For multi-class clinical features (ordinal or nominal), one-way analysis of variance (Howell 2002) was applied to compare the log2-expression levels between different clinical classes using 'anova' function in R
For two-class clinical features, two-tailed Student's t test with unequal variance (Lehmann and Romano 2005) was applied to compare the log2-expression levels between the two clinical classes using 't.test' function in R
For multiple hypothesis correction, Q value is the False Discovery Rate (FDR) analogue of the P value (Benjamini and Hochberg 1995), defined as the minimum FDR at which the test may be called significant. We used the 'Benjamini and Hochberg' method of 'p.adjust' function in R to convert P values into Q values.
In addition to the links below, the full results of the analysis summarized in this report can also be downloaded programmatically using firehose_get, or interactively from either the Broad GDAC website or TCGA Data Coordination Center Portal.