This pipeline uses various statistical tests to identify mRNAs whose expression levels correlated to selected clinical features.
Testing the association between 17814 genes and 5 clinical features across 54 samples, statistically thresholded by Q value < 0.05, 3 clinical features related to at least one genes.
-
3 genes correlated to 'AGE'.
-
NPTX1 , TMEM79 , IL20RB
-
150 genes correlated to 'HISTOLOGICAL.TYPE'.
-
KLHL34 , OR4S2 , C19ORF12 , TSP50 , KIAA1324 , ...
-
28 genes correlated to 'COMPLETENESS.OF.RESECTION'.
-
RHOXF1 , GALNTL5 , AGTR1 , LBP , ABHD9 , ...
-
No genes correlated to 'Time to Death', and 'RADIATIONS.RADIATION.REGIMENINDICATION'.
Complete statistical result table is provided in Supplement Table 1
Table 1. Get Full Table This table shows the clinical features, statistical methods used, and the number of genes that are significantly associated with each clinical feature at Q value < 0.05.
| Clinical feature | Statistical test | Significant genes | Associated with | Associated with | ||
|---|---|---|---|---|---|---|
| Time to Death | Cox regression test | N=0 | ||||
| AGE | Spearman correlation test | N=3 | older | N=2 | younger | N=1 |
| HISTOLOGICAL TYPE | ANOVA test | N=150 | ||||
| RADIATIONS RADIATION REGIMENINDICATION | t test | N=0 | ||||
| COMPLETENESS OF RESECTION | ANOVA test | N=28 |
Table S1. Basic characteristics of clinical feature: 'Time to Death'
| Time to Death | Duration (Months) | 6-149.5 (median=37.4) |
| censored | N = 45 | |
| death | N = 9 | |
| Significant markers | N = 0 |
Table S2. Basic characteristics of clinical feature: 'AGE'
| AGE | Mean (SD) | 62.94 (12) |
| Significant markers | N = 3 | |
| pos. correlated | 2 | |
| neg. correlated | 1 |
Table S3. Get Full Table List of 3 genes significantly correlated to 'AGE' by Spearman correlation test
| SpearmanCorr | corrP | Q | |
|---|---|---|---|
| NPTX1 | -0.6007 | 1.566e-06 | 0.0279 |
| TMEM79 | 0.5976 | 1.832e-06 | 0.0326 |
| IL20RB | 0.5914 | 2.484e-06 | 0.0443 |
Figure S1. Get High-res Image As an example, this figure shows the association of NPTX1 to 'AGE'. P value = 1.57e-06 with Spearman correlation analysis. The straight line presents the best linear regression.
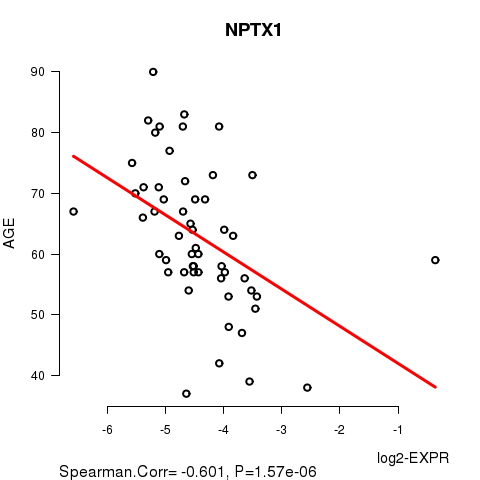
Table S4. Basic characteristics of clinical feature: 'HISTOLOGICAL.TYPE'
| HISTOLOGICAL.TYPE | Labels | N |
| ENDOMETRIOID ENDOMETRIAL ADENOCARCINOMA | 41 | |
| MIXED SEROUS AND ENDOMETRIOID | 1 | |
| SEROUS ENDOMETRIAL ADENOCARCINOMA | 12 | |
| Significant markers | N = 150 |
Table S5. Get Full Table List of top 10 genes differentially expressed by 'HISTOLOGICAL.TYPE'
| ANOVA_P | Q | |
|---|---|---|
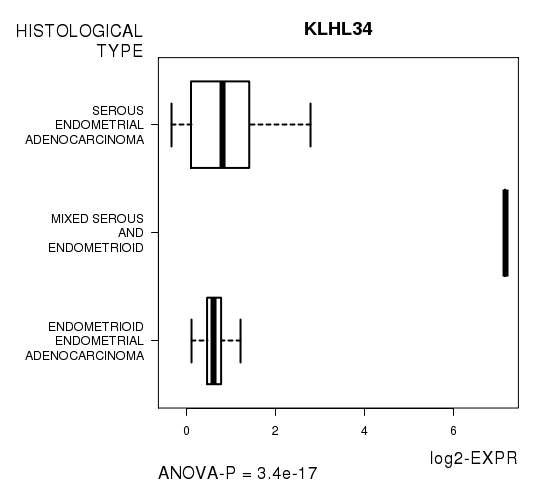
| KLHL34 | 3.401e-17 | 6.06e-13 |
| OR4S2 | 1.774e-14 | 3.16e-10 |
| C19ORF12 | 2.167e-13 | 3.86e-09 |
| TSP50 | 3.379e-13 | 6.02e-09 |
| KIAA1324 | 4.24e-13 | 7.55e-09 |
| PNOC | 6.89e-13 | 1.23e-08 |
| FOXA2 | 2.187e-12 | 3.9e-08 |
| CDH6 | 4.379e-12 | 7.8e-08 |
| CLDN6 | 9.875e-12 | 1.76e-07 |
| SLC6A12 | 6.547e-11 | 1.17e-06 |
Figure S2. Get High-res Image As an example, this figure shows the association of KLHL34 to 'HISTOLOGICAL.TYPE'. P value = 3.4e-17 with ANOVA analysis.
No gene related to 'RADIATIONS.RADIATION.REGIMENINDICATION'.
Table S6. Basic characteristics of clinical feature: 'RADIATIONS.RADIATION.REGIMENINDICATION'
| RADIATIONS.RADIATION.REGIMENINDICATION | Labels | N |
| NO | 25 | |
| YES | 29 | |
| Significant markers | N = 0 |
Table S7. Basic characteristics of clinical feature: 'COMPLETENESS.OF.RESECTION'
| COMPLETENESS.OF.RESECTION | Labels | N |
| R0 | 39 | |
| R1 | 6 | |
| R2 | 2 | |
| RX | 1 | |
| Significant markers | N = 28 |
Table S8. Get Full Table List of top 10 genes differentially expressed by 'COMPLETENESS.OF.RESECTION'
| ANOVA_P | Q | |
|---|---|---|
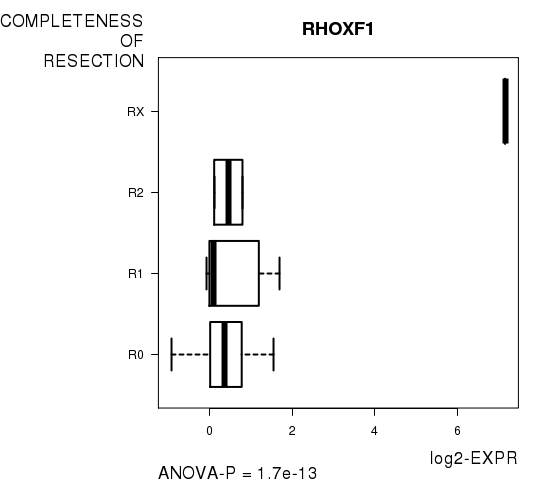
| RHOXF1 | 1.699e-13 | 3.03e-09 |
| GALNTL5 | 9.385e-11 | 1.67e-06 |
| AGTR1 | 6.718e-10 | 1.2e-05 |
| LBP | 9.917e-10 | 1.77e-05 |
| ABHD9 | 1.207e-08 | 0.000215 |
| C12ORF59 | 1.389e-08 | 0.000247 |
| ANKS1A | 1.618e-08 | 0.000288 |
| KCNV1 | 2.125e-08 | 0.000378 |
| PAGE1 | 3.932e-08 | 7e-04 |
| SSX7 | 4.549e-08 | 0.00081 |
Figure S3. Get High-res Image As an example, this figure shows the association of RHOXF1 to 'COMPLETENESS.OF.RESECTION'. P value = 1.7e-13 with ANOVA analysis.
-
Expresson data file = UCEC-TP.medianexp.txt
-
Clinical data file = UCEC-TP.clin.merged.picked.txt
-
Number of patients = 54
-
Number of genes = 17814
-
Number of clinical features = 5
For survival clinical features, Wald's test in univariate Cox regression analysis with proportional hazards model (Andersen and Gill 1982) was used to estimate the P values using the 'coxph' function in R. Kaplan-Meier survival curves were plot using the four quartile subgroups of patients based on expression levels
For continuous numerical clinical features, Spearman's rank correlation coefficients (Spearman 1904) and two-tailed P values were estimated using 'cor.test' function in R
For multi-class clinical features (ordinal or nominal), one-way analysis of variance (Howell 2002) was applied to compare the log2-expression levels between different clinical classes using 'anova' function in R
For two-class clinical features, two-tailed Student's t test with unequal variance (Lehmann and Romano 2005) was applied to compare the log2-expression levels between the two clinical classes using 't.test' function in R
For multiple hypothesis correction, Q value is the False Discovery Rate (FDR) analogue of the P value (Benjamini and Hochberg 1995), defined as the minimum FDR at which the test may be called significant. We used the 'Benjamini and Hochberg' method of 'p.adjust' function in R to convert P values into Q values.
In addition to the links below, the full results of the analysis summarized in this report can also be downloaded programmatically using firehose_get, or interactively from either the Broad GDAC website or TCGA Data Coordination Center Portal.