This pipeline uses various statistical tests to identify mRNAs whose expression levels correlated to selected clinical features.
Testing the association between 18332 genes and 5 clinical features across 85 samples, statistically thresholded by Q value < 0.05, 4 clinical features related to at least one genes.
-
1 gene correlated to 'AGE'.
-
CAMK2B|816
-
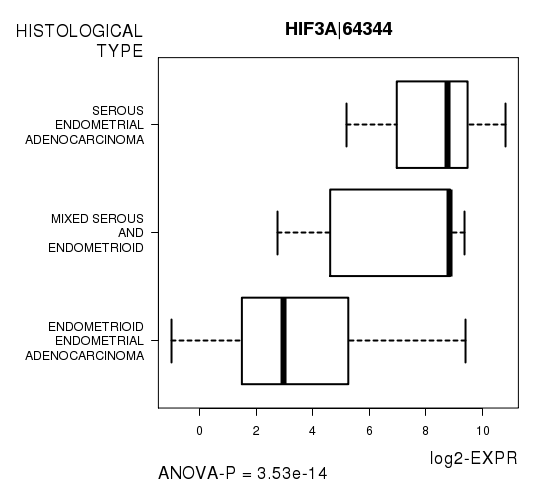
109 genes correlated to 'HISTOLOGICAL.TYPE'.
-
HIF3A|64344 , MX2|4600 , PRKCI|5584 , NPR1|4881 , ZNF334|55713 , ...
-
8 genes correlated to 'RADIATIONS.RADIATION.REGIMENINDICATION'.
-
P2RY4|5030 , FRMPD1|22844 , CYP4Z2P|163720 , ZIK1|284307 , KRT5|3852 , ...
-
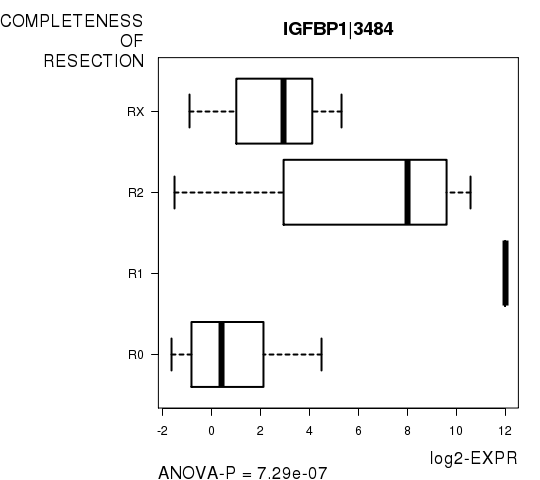
1 gene correlated to 'COMPLETENESS.OF.RESECTION'.
-
IGFBP1|3484
-
No genes correlated to 'Time to Death'
Complete statistical result table is provided in Supplement Table 1
Table 1. Get Full Table This table shows the clinical features, statistical methods used, and the number of genes that are significantly associated with each clinical feature at Q value < 0.05.
| Clinical feature | Statistical test | Significant genes | Associated with | Associated with | ||
|---|---|---|---|---|---|---|
| Time to Death | Cox regression test | N=0 | ||||
| AGE | Spearman correlation test | N=1 | older | N=1 | younger | N=0 |
| HISTOLOGICAL TYPE | ANOVA test | N=109 | ||||
| RADIATIONS RADIATION REGIMENINDICATION | t test | N=8 | yes | N=2 | no | N=6 |
| COMPLETENESS OF RESECTION | ANOVA test | N=1 |
Table S1. Basic characteristics of clinical feature: 'Time to Death'
| Time to Death | Duration (Months) | 0-102 (median=5.3) |
| censored | N = 71 | |
| death | N = 12 | |
| Significant markers | N = 0 |
Table S2. Basic characteristics of clinical feature: 'AGE'
| AGE | Mean (SD) | 65.67 (12) |
| Significant markers | N = 1 | |
| pos. correlated | 1 | |
| neg. correlated | 0 |
Table S3. Get Full Table List of one gene significantly correlated to 'AGE' by Spearman correlation test
| SpearmanCorr | corrP | Q | |
|---|---|---|---|
| CAMK2B|816 | 0.5022 | 1.13e-06 | 0.0207 |
Figure S1. Get High-res Image As an example, this figure shows the association of CAMK2B|816 to 'AGE'. P value = 1.13e-06 with Spearman correlation analysis. The straight line presents the best linear regression.
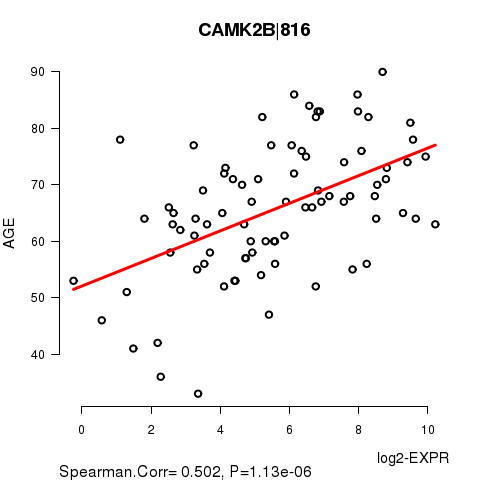
Table S4. Basic characteristics of clinical feature: 'HISTOLOGICAL.TYPE'
| HISTOLOGICAL.TYPE | Labels | N |
| ENDOMETRIOID ENDOMETRIAL ADENOCARCINOMA | 46 | |
| MIXED SEROUS AND ENDOMETRIOID | 5 | |
| SEROUS ENDOMETRIAL ADENOCARCINOMA | 34 | |
| Significant markers | N = 109 |
Table S5. Get Full Table List of top 10 genes differentially expressed by 'HISTOLOGICAL.TYPE'
| ANOVA_P | Q | |
|---|---|---|
| HIF3A|64344 | 3.528e-14 | 6.47e-10 |
| MX2|4600 | 4.115e-13 | 7.54e-09 |
| PRKCI|5584 | 8.125e-11 | 1.49e-06 |
| NPR1|4881 | 1.819e-10 | 3.33e-06 |
| ZNF334|55713 | 2.237e-10 | 4.1e-06 |
| L1CAM|3897 | 5.575e-10 | 1.02e-05 |
| TRO|7216 | 1.557e-09 | 2.85e-05 |
| SLC8A1|6546 | 1.93e-09 | 3.54e-05 |
| FIGNL2|401720 | 3.414e-09 | 6.26e-05 |
| NR1I2|8856 | 4.015e-09 | 7.36e-05 |
Figure S2. Get High-res Image As an example, this figure shows the association of HIF3A|64344 to 'HISTOLOGICAL.TYPE'. P value = 3.53e-14 with ANOVA analysis.
8 genes related to 'RADIATIONS.RADIATION.REGIMENINDICATION'.
Table S6. Basic characteristics of clinical feature: 'RADIATIONS.RADIATION.REGIMENINDICATION'
| RADIATIONS.RADIATION.REGIMENINDICATION | Labels | N |
| NO | 6 | |
| YES | 79 | |
| Significant markers | N = 8 | |
| Higher in YES | 2 | |
| Higher in NO | 6 |
Table S7. Get Full Table List of 8 genes differentially expressed by 'RADIATIONS.RADIATION.REGIMENINDICATION'
| T(pos if higher in 'YES') | ttestP | Q | AUC | |
|---|---|---|---|---|
| P2RY4|5030 | -9.26 | 8.808e-11 | 1.56e-06 | 0.8889 |
| FRMPD1|22844 | -7.8 | 2.649e-10 | 4.68e-06 | 0.8284 |
| CYP4Z2P|163720 | -7.82 | 2.54e-09 | 4.49e-05 | 0.892 |
| ZIK1|284307 | 6.46 | 4.13e-07 | 0.00729 | 0.8485 |
| KRT5|3852 | -6.58 | 5.174e-07 | 0.00913 | 0.8355 |
| OSTBETA|123264 | 7.29 | 1.44e-06 | 0.0254 | 0.8596 |
| GJB6|10804 | -5.24 | 1.504e-06 | 0.0265 | 0.7649 |
| LTF|4057 | -6.83 | 1.568e-06 | 0.0277 | 0.8418 |
Figure S3. Get High-res Image As an example, this figure shows the association of P2RY4|5030 to 'RADIATIONS.RADIATION.REGIMENINDICATION'. P value = 8.81e-11 with T-test analysis.
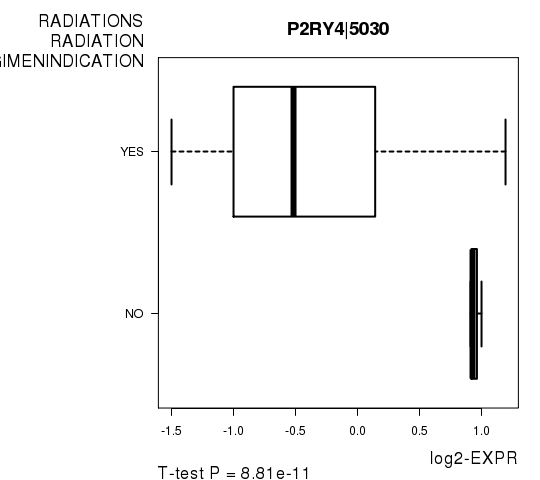
Table S8. Basic characteristics of clinical feature: 'COMPLETENESS.OF.RESECTION'
| COMPLETENESS.OF.RESECTION | Labels | N |
| R0 | 52 | |
| R1 | 2 | |
| R2 | 4 | |
| RX | 4 | |
| Significant markers | N = 1 |
Table S9. Get Full Table List of one gene differentially expressed by 'COMPLETENESS.OF.RESECTION'
| ANOVA_P | Q | |
|---|---|---|
| IGFBP1|3484 | 7.29e-07 | 0.0134 |
Figure S4. Get High-res Image As an example, this figure shows the association of IGFBP1|3484 to 'COMPLETENESS.OF.RESECTION'. P value = 7.29e-07 with ANOVA analysis.
-
Expresson data file = UCEC-TP.uncv2.mRNAseq_RSEM_normalized_log2.txt
-
Clinical data file = UCEC-TP.clin.merged.picked.txt
-
Number of patients = 85
-
Number of genes = 18332
-
Number of clinical features = 5
For survival clinical features, Wald's test in univariate Cox regression analysis with proportional hazards model (Andersen and Gill 1982) was used to estimate the P values using the 'coxph' function in R. Kaplan-Meier survival curves were plot using the four quartile subgroups of patients based on expression levels
For continuous numerical clinical features, Spearman's rank correlation coefficients (Spearman 1904) and two-tailed P values were estimated using 'cor.test' function in R
For multi-class clinical features (ordinal or nominal), one-way analysis of variance (Howell 2002) was applied to compare the log2-expression levels between different clinical classes using 'anova' function in R
For two-class clinical features, two-tailed Student's t test with unequal variance (Lehmann and Romano 2005) was applied to compare the log2-expression levels between the two clinical classes using 't.test' function in R
For multiple hypothesis correction, Q value is the False Discovery Rate (FDR) analogue of the P value (Benjamini and Hochberg 1995), defined as the minimum FDR at which the test may be called significant. We used the 'Benjamini and Hochberg' method of 'p.adjust' function in R to convert P values into Q values.
In addition to the links below, the full results of the analysis summarized in this report can also be downloaded programmatically using firehose_get, or interactively from either the Broad GDAC website or TCGA Data Coordination Center Portal.