This pipeline uses various statistical tests to identify miRs whose expression levels correlated to selected clinical features.
Testing the association between 556 genes and 5 clinical features across 469 samples, statistically thresholded by Q value < 0.05, 4 clinical features related to at least one genes.
-
3 genes correlated to 'Time to Death'.
-
HSA-MIR-497 , HSA-LET-7G , HSA-LET-7B
-
45 genes correlated to 'AGE'.
-
HSA-MIR-424 , HSA-MIR-1247 , HSA-MIR-337 , HSA-MIR-935 , HSA-MIR-199A-1 , ...
-
102 genes correlated to 'HISTOLOGICAL.TYPE'.
-
HSA-MIR-9-3 , HSA-MIR-9-2 , HSA-MIR-9-1 , HSA-MIR-934 , HSA-MIR-34A , ...
-
9 genes correlated to 'RADIATIONS.RADIATION.REGIMENINDICATION'.
-
HSA-MIR-3613 , HSA-MIR-128-1 , HSA-MIR-128-2 , HSA-MIR-107 , HSA-MIR-628 , ...
-
No genes correlated to 'COMPLETENESS.OF.RESECTION'
Complete statistical result table is provided in Supplement Table 1
Table 1. Get Full Table This table shows the clinical features, statistical methods used, and the number of genes that are significantly associated with each clinical feature at Q value < 0.05.
| Clinical feature | Statistical test | Significant genes | Associated with | Associated with | ||
|---|---|---|---|---|---|---|
| Time to Death | Cox regression test | N=3 | shorter survival | N=0 | longer survival | N=3 |
| AGE | Spearman correlation test | N=45 | older | N=4 | younger | N=41 |
| HISTOLOGICAL TYPE | ANOVA test | N=102 | ||||
| RADIATIONS RADIATION REGIMENINDICATION | t test | N=9 | yes | N=6 | no | N=3 |
| COMPLETENESS OF RESECTION | ANOVA test | N=0 |
Table S1. Basic characteristics of clinical feature: 'Time to Death'
| Time to Death | Duration (Months) | 0-191.8 (median=20.9) |
| censored | N = 413 | |
| death | N = 53 | |
| Significant markers | N = 3 | |
| associated with shorter survival | 0 | |
| associated with longer survival | 3 |
Table S2. Get Full Table List of 3 genes significantly associated with 'Time to Death' by Cox regression test
| HazardRatio | Wald_P | Q | C_index | |
|---|---|---|---|---|
| HSA-MIR-497 | 0.66 | 1.653e-05 | 0.0092 | 0.336 |
| HSA-LET-7G | 0.51 | 2.347e-05 | 0.013 | 0.337 |
| HSA-LET-7B | 0.6 | 8.118e-05 | 0.045 | 0.293 |
Figure S1. Get High-res Image As an example, this figure shows the association of HSA-MIR-497 to 'Time to Death'. four curves present the cumulative survival rates of 4 quartile subsets of patients. P value = 1.65e-05 with univariate Cox regression analysis using continuous log-2 expression values.
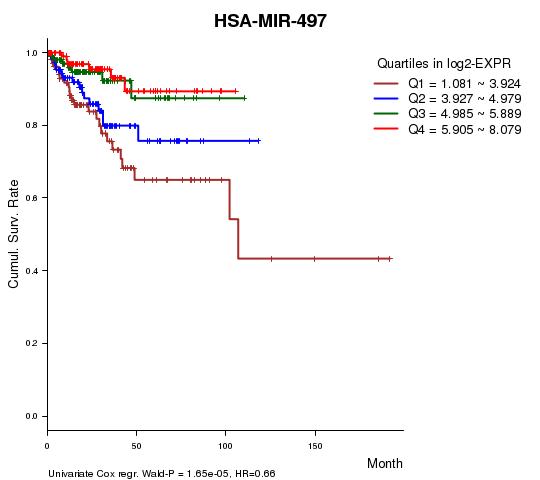
Table S3. Basic characteristics of clinical feature: 'AGE'
| AGE | Mean (SD) | 63.66 (11) |
| Significant markers | N = 45 | |
| pos. correlated | 4 | |
| neg. correlated | 41 |
Table S4. Get Full Table List of top 10 genes significantly correlated to 'AGE' by Spearman correlation test
| SpearmanCorr | corrP | Q | |
|---|---|---|---|
| HSA-MIR-424 | -0.3223 | 9.039e-13 | 5.03e-10 |
| HSA-MIR-1247 | -0.2656 | 6.231e-09 | 3.46e-06 |
| HSA-MIR-337 | -0.2469 | 6.245e-08 | 3.46e-05 |
| HSA-MIR-935 | 0.2677 | 7.937e-08 | 4.39e-05 |
| HSA-MIR-199A-1 | -0.2374 | 2.03e-07 | 0.000112 |
| HSA-MIR-516A-1 | 0.3031 | 2.114e-07 | 0.000116 |
| HSA-MIR-214 | -0.2361 | 2.441e-07 | 0.000134 |
| HSA-MIR-409 | -0.2358 | 2.464e-07 | 0.000135 |
| HSA-MIR-34A | -0.2356 | 2.513e-07 | 0.000138 |
| HSA-MIR-199A-2 | -0.2331 | 3.396e-07 | 0.000186 |
Figure S2. Get High-res Image As an example, this figure shows the association of HSA-MIR-424 to 'AGE'. P value = 9.04e-13 with Spearman correlation analysis. The straight line presents the best linear regression.
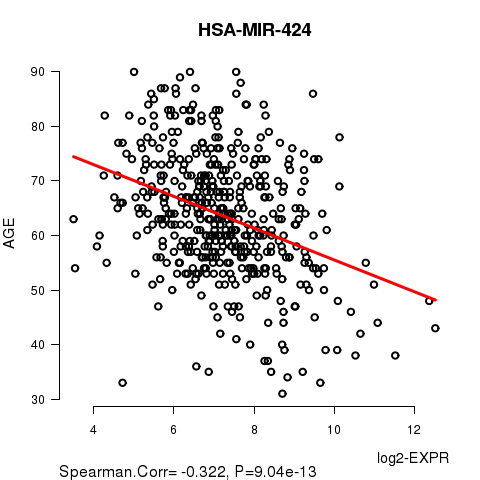
Table S5. Basic characteristics of clinical feature: 'HISTOLOGICAL.TYPE'
| HISTOLOGICAL.TYPE | Labels | N |
| ENDOMETRIOID ENDOMETRIAL ADENOCARCINOMA | 362 | |
| MIXED SEROUS AND ENDOMETRIOID | 18 | |
| SEROUS ENDOMETRIAL ADENOCARCINOMA | 89 | |
| Significant markers | N = 102 |
Table S6. Get Full Table List of top 10 genes differentially expressed by 'HISTOLOGICAL.TYPE'
| ANOVA_P | Q | |
|---|---|---|
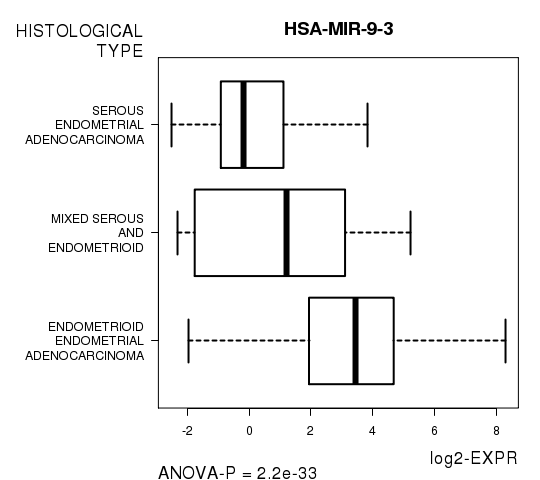
| HSA-MIR-9-3 | 2.203e-33 | 1.22e-30 |
| HSA-MIR-9-2 | 5.277e-30 | 2.93e-27 |
| HSA-MIR-9-1 | 6.31e-30 | 3.5e-27 |
| HSA-MIR-934 | 3.937e-25 | 2.18e-22 |
| HSA-MIR-34A | 1.663e-21 | 9.18e-19 |
| HSA-MIR-375 | 1.059e-19 | 5.83e-17 |
| HSA-MIR-195 | 3.877e-19 | 2.13e-16 |
| HSA-MIR-221 | 4.03e-19 | 2.21e-16 |
| HSA-MIR-190B | 1.024e-18 | 5.61e-16 |
| HSA-MIR-452 | 1.145e-18 | 6.26e-16 |
Figure S3. Get High-res Image As an example, this figure shows the association of HSA-MIR-9-3 to 'HISTOLOGICAL.TYPE'. P value = 2.2e-33 with ANOVA analysis.
9 genes related to 'RADIATIONS.RADIATION.REGIMENINDICATION'.
Table S7. Basic characteristics of clinical feature: 'RADIATIONS.RADIATION.REGIMENINDICATION'
| RADIATIONS.RADIATION.REGIMENINDICATION | Labels | N |
| NO | 131 | |
| YES | 338 | |
| Significant markers | N = 9 | |
| Higher in YES | 6 | |
| Higher in NO | 3 |
Table S8. Get Full Table List of 9 genes differentially expressed by 'RADIATIONS.RADIATION.REGIMENINDICATION'
| T(pos if higher in 'YES') | ttestP | Q | AUC | |
|---|---|---|---|---|
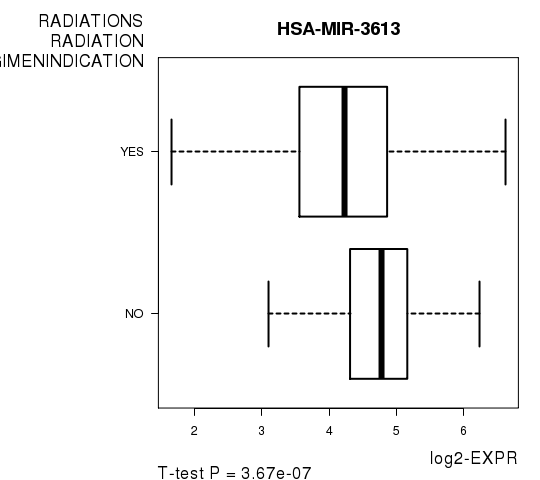
| HSA-MIR-3613 | -5.21 | 3.665e-07 | 0.000204 | 0.6549 |
| HSA-MIR-128-1 | 4.94 | 1.322e-06 | 0.000734 | 0.6401 |
| HSA-MIR-128-2 | 4.72 | 3.686e-06 | 0.00204 | 0.6316 |
| HSA-MIR-107 | 4.56 | 7.554e-06 | 0.00418 | 0.6194 |
| HSA-MIR-628 | -4.54 | 8.46e-06 | 0.00467 | 0.6273 |
| HSA-MIR-181D | 4.36 | 1.855e-05 | 0.0102 | 0.6296 |
| HSA-MIR-361 | 4.34 | 2.05e-05 | 0.0113 | 0.6183 |
| HSA-MIR-146A | -4.21 | 3.541e-05 | 0.0194 | 0.6175 |
| HSA-MIR-103-1 | 3.99 | 8.724e-05 | 0.0478 | 0.6166 |
Figure S4. Get High-res Image As an example, this figure shows the association of HSA-MIR-3613 to 'RADIATIONS.RADIATION.REGIMENINDICATION'. P value = 3.67e-07 with T-test analysis.
-
Expresson data file = UCEC-TP.miRseq_RPKM_log2.txt
-
Clinical data file = UCEC-TP.clin.merged.picked.txt
-
Number of patients = 469
-
Number of genes = 556
-
Number of clinical features = 5
For survival clinical features, Wald's test in univariate Cox regression analysis with proportional hazards model (Andersen and Gill 1982) was used to estimate the P values using the 'coxph' function in R. Kaplan-Meier survival curves were plot using the four quartile subgroups of patients based on expression levels
For continuous numerical clinical features, Spearman's rank correlation coefficients (Spearman 1904) and two-tailed P values were estimated using 'cor.test' function in R
For multi-class clinical features (ordinal or nominal), one-way analysis of variance (Howell 2002) was applied to compare the log2-expression levels between different clinical classes using 'anova' function in R
For two-class clinical features, two-tailed Student's t test with unequal variance (Lehmann and Romano 2005) was applied to compare the log2-expression levels between the two clinical classes using 't.test' function in R
For multiple hypothesis correction, Q value is the False Discovery Rate (FDR) analogue of the P value (Benjamini and Hochberg 1995), defined as the minimum FDR at which the test may be called significant. We used the 'Benjamini and Hochberg' method of 'p.adjust' function in R to convert P values into Q values.
In addition to the links below, the full results of the analysis summarized in this report can also be downloaded programmatically using firehose_get, or interactively from either the Broad GDAC website or TCGA Data Coordination Center Portal.