This report serves to describe the mutational landscape and properties of a given individual set, as well as rank genes and genesets according to mutational significance. MutSig v1.5 was used to generate the results found in this report.
-
Working with individual set: UCEC-TP
-
Number of patients in set: 248
The input for this pipeline is a set of individuals with the following files associated for each:
-
An annotated .maf file describing the mutations called for the respective individual, and their properties.
-
A .wig file that contains information about the coverage of the sample.
-
MAF used for this analysis:UCEC-TP.final_analysis_set.maf
-
Significantly mutated genes (q ≤ 0.1): 29
-
Mutations seen in COSMIC: 1002
-
Significantly mutated genes in COSMIC territory: 46
-
Genes with clustered mutations (≤ 3 aa apart): 4308
-
Significantly mutated genesets: 68
-
Significantly mutated genesets: (excluding sig. mutated genes):0
-
Read 248 MAFs of type "WashU"
-
Total number of mutations in input MAFs: 184861
-
After removing 118 mutations outside chr1-24: 184743
-
After removing 1940 noncoding mutations: 182803
-
After collapsing adjacent/redundant mutations: 182801
-
Number of mutations before filtering: 182801
-
After removing 15963 mutations outside gene set: 166838
-
After removing 1023 mutations outside category set: 165815
-
After removing 29 "impossible" mutations in
-
gene-patient-category bins of zero coverage: 148800
Table 1. Get Full Table Table representing breakdown of mutations by type.
| type | count |
|---|---|
| Frame_Shift_Del | 1066 |
| Frame_Shift_Ins | 463 |
| In_Frame_Del | 738 |
| In_Frame_Ins | 140 |
| Missense_Mutation | 110598 |
| Nonsense_Mutation | 11525 |
| Nonstop_Mutation | 127 |
| Silent | 38582 |
| Splice_Site | 2576 |
| Total | 165815 |
Table 2. Get Full Table A breakdown of mutation rates per category discovered for this individual set.
| category | n | N | rate | rate_per_mb | relative_rate | exp_ns_s_ratio |
|---|---|---|---|---|---|---|
| *CpG->T | 37505 | 363920417 | 0.0001 | 100 | 5.6 | 2.2 |
| *Cp(A/C/T)->mut | 48870 | 3147487610 | 0.000016 | 16 | 0.85 | 3.4 |
| A->mut | 23156 | 3458111551 | 6.7e-06 | 6.7 | 0.37 | 3.8 |
| *CpG->(G/A) | 1051 | 363920417 | 2.9e-06 | 2.9 | 0.16 | 2.7 |
| indel+null | 15764 | 6969519578 | 2.3e-06 | 2.3 | 0.12 | NaN |
| double_null | 868 | 6969519578 | 1.2e-07 | 0.12 | 0.0068 | NaN |
| Total | 127214 | 6969519578 | 0.000018 | 18 | 1 | 3.5 |
The x axis represents the samples. The y axis represents the exons, one row per exon, and they are sorted by average coverage across samples. For exons with exactly the same average coverage, they are sorted next by the %GC of the exon. (The secondary sort is especially useful for the zero-coverage exons at the bottom).
Figure 1.
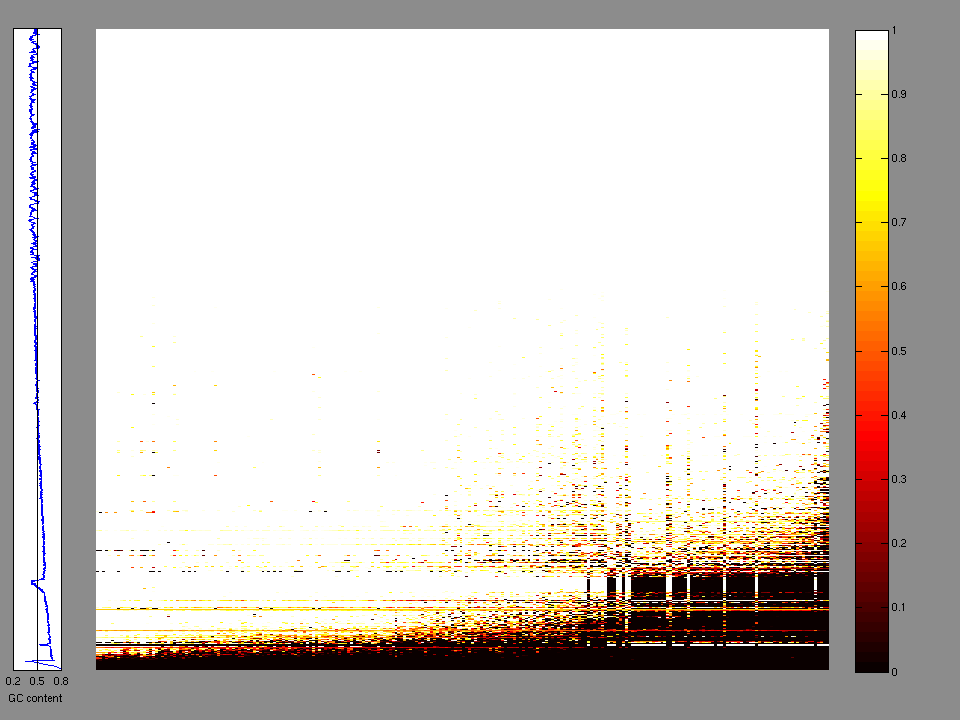
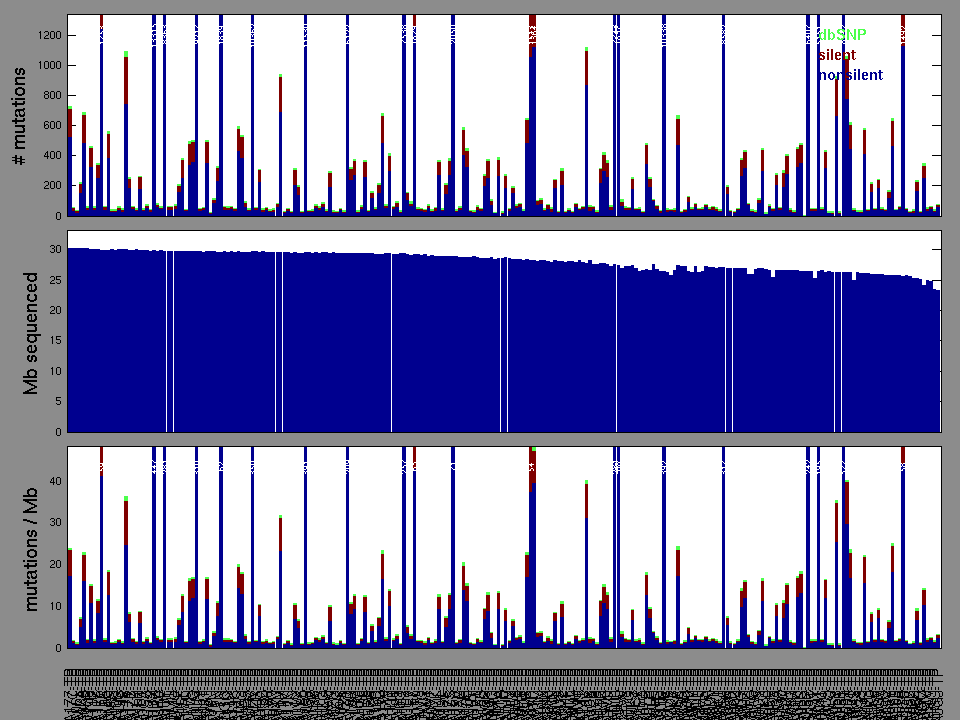
Figure 2. Patients counts and rates file used to generate this plot: UCEC-TP.patients.counts_and_rates.txt
The mutation spectrum is depicted in the lego plots below in which the 96 possible mutation types are subdivided into six large blocks, color-coded to reflect the base substitution type. Each large block is further subdivided into the 16 possible pairs of 5' and 3' neighbors, as listed in the 4x4 trinucleotide context legend. The height of each block corresponds to the mutation frequency for that kind of mutation (counts of mutations normalized by the base coverage in a given bin). The shape of the spectrum is a signature for dominant mutational mechanisms in different tumor types.
Figure 3. Get High-res Image SNV Mutation rate lego plot for entire set. Each bin is normalized by base coverage for that bin. Colors represent the six SNV types on the upper right. The three-base context for each mutation is labeled in the 4x4 legend on the lower right. The fractional breakdown of SNV counts is shown in the pie chart on the upper left. If this figure is blank, not enough information was provided in the MAF to generate it.
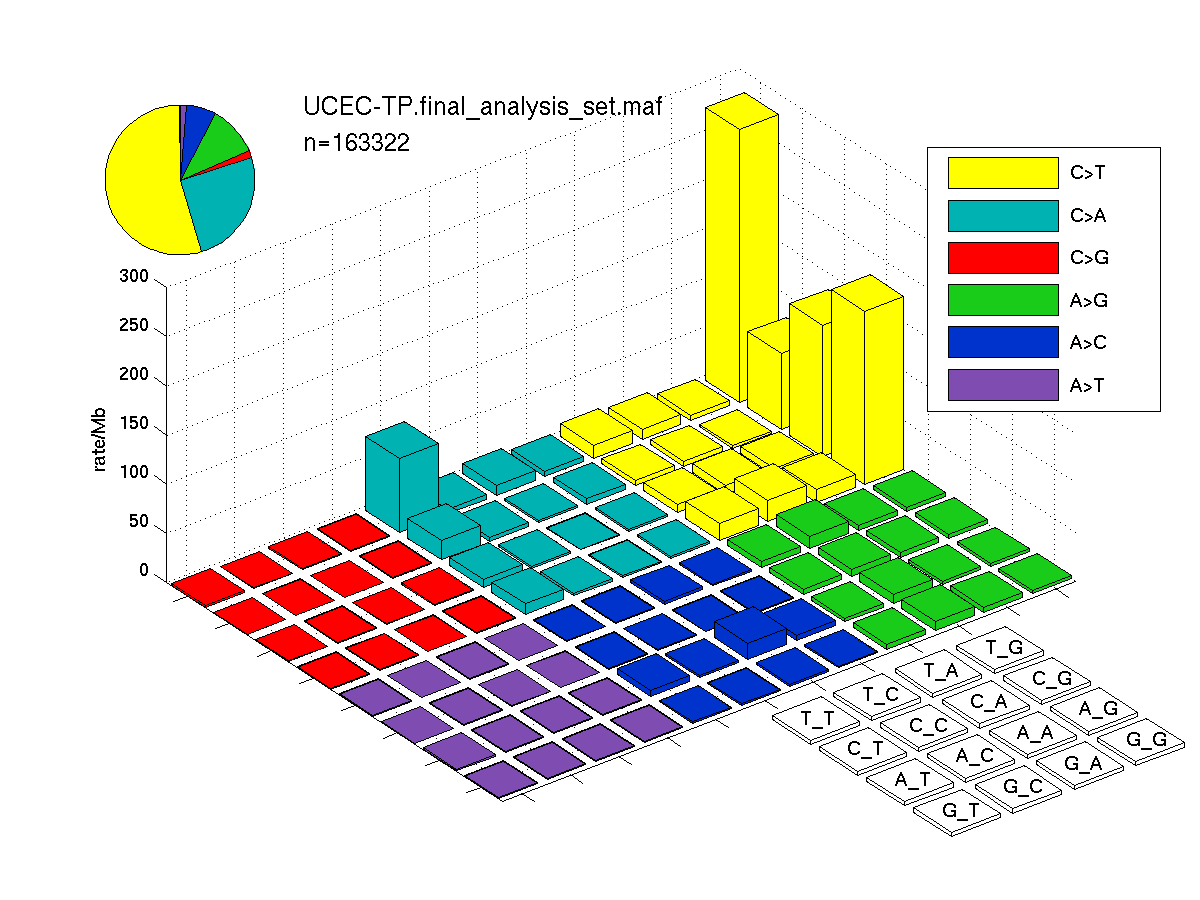
Figure 4. Get High-res Image SNV Mutation rate lego plots for 4 slices of mutation allele fraction (0<=AF<0.1, 0.1<=AF<0.25, 0.25<=AF<0.5, & 0.5<=AF) . The color code and three-base context legends are the same as the previous figure. If this figure is blank, not enough information was provided in the MAF to generate it.

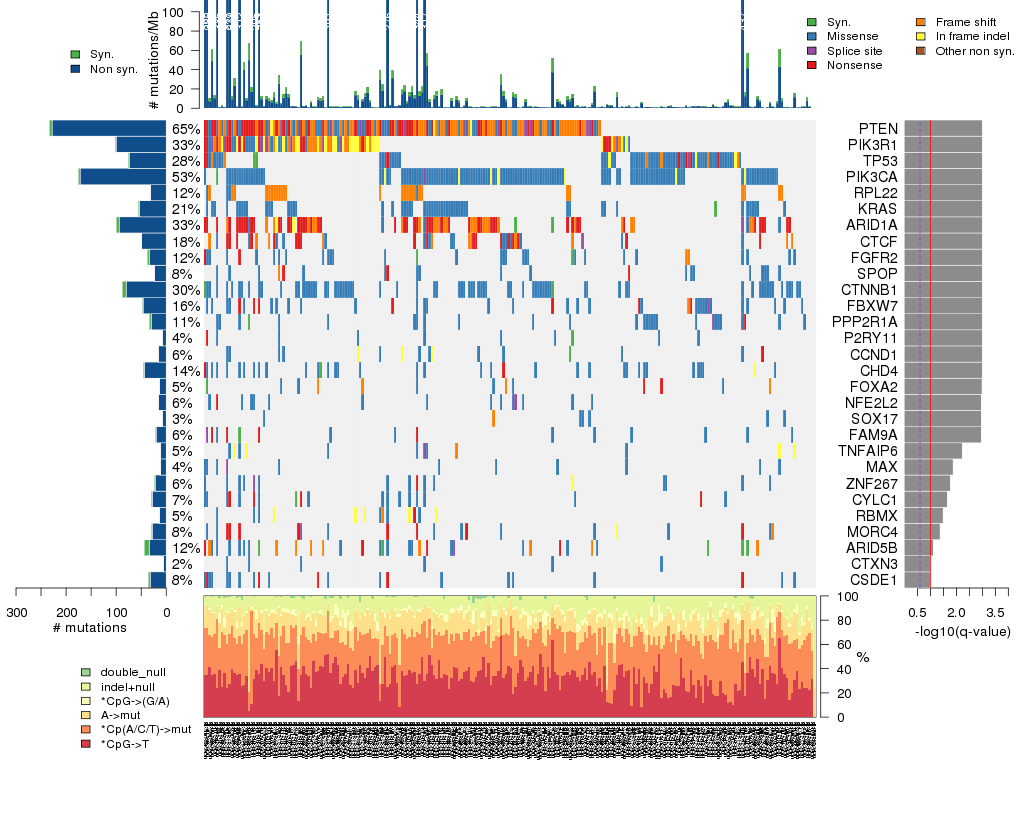
Figure 5. Get High-res Image The matrix in the center of the figure represents individual mutations in patient samples, color-coded by type of mutation, for the significantly mutated genes. The rate of synonymous and non-synonymous mutations is displayed at the top of the matrix. The barplot on the left of the matrix shows the number of mutations in each gene. The percentages represent the fraction of tumors with at least one mutation in the specified gene. The barplot to the right of the matrix displays the q-values for the most significantly mutated genes. The purple boxplots below the matrix (only displayed if required columns are present in the provided MAF) represent the distributions of allelic fractions observed in each sample. The plot at the bottom represents the base substitution distribution of individual samples, using the same categories that were used to calculate significance.
Column Descriptions:
-
N = number of sequenced bases in this gene across the individual set
-
n = number of (nonsilent) mutations in this gene across the individual set
-
npat = number of patients (individuals) with at least one nonsilent mutation
-
nsite = number of unique sites having a non-silent mutation
-
nsil = number of silent mutations in this gene across the individual set
-
n1 = number of nonsilent mutations of type: *CpG->T
-
n2 = number of nonsilent mutations of type: *Cp(A/C/T)->mut
-
n3 = number of nonsilent mutations of type: A->mut
-
n4 = number of nonsilent mutations of type: *CpG->(G/A)
-
n5 = number of nonsilent mutations of type: indel+null
-
n6 = number of nonsilent mutations of type: double_null
-
p_ns_s = p-value for the observed nonsilent/silent ratio being elevated in this gene
-
p = p-value (overall)
-
q = q-value, False Discovery Rate (Benjamini-Hochberg procedure)
Table 3. Get Full Table A Ranked List of Significantly Mutated Genes. Number of significant genes found: 29. Number of genes displayed: 35. Click on a gene name to display its stick figure depicting the distribution of mutations and mutation types across the chosen gene (this feature may not be available for all significant genes).
| rank | gene | description | N | n | npat | nsite | nsil | n1 | n2 | n3 | n4 | n5 | n6 | p_ns_s | p | q |
|---|---|---|---|---|---|---|---|---|---|---|---|---|---|---|---|---|
| 1 | PTEN | phosphatase and tensin homolog (mutated in multiple advanced cancers 1) | 306286 | 228 | 161 | 134 | 5 | 20 | 29 | 21 | 33 | 98 | 27 | 3.7e-12 | <1.00e-15 | <8.49e-12 |
| 2 | PIK3R1 | phosphoinositide-3-kinase, regulatory subunit 1 (alpha) | 581125 | 100 | 83 | 77 | 2 | 4 | 4 | 13 | 1 | 63 | 15 | 0.0021 | <1.00e-15 | <8.49e-12 |
| 3 | TP53 | tumor protein p53 | 317550 | 74 | 69 | 50 | 2 | 23 | 18 | 15 | 1 | 17 | 0 | 2.1e-06 | 3.11e-15 | 9.66e-12 |
| 4 | PIK3CA | phosphoinositide-3-kinase, catalytic, alpha polypeptide | 813637 | 172 | 132 | 76 | 3 | 31 | 61 | 68 | 3 | 9 | 0 | 2.1e-11 | 3.22e-15 | 9.66e-12 |
| 5 | RPL22 | ribosomal protein L22 | 97813 | 31 | 31 | 7 | 0 | 1 | 0 | 3 | 0 | 26 | 1 | 0.37 | 3.33e-15 | 9.66e-12 |
| 6 | KRAS | v-Ki-ras2 Kirsten rat sarcoma viral oncogene homolog | 175322 | 53 | 53 | 11 | 2 | 1 | 47 | 4 | 1 | 0 | 0 | 0.0059 | 4.11e-15 | 9.66e-12 |
| 7 | ARID1A | AT rich interactive domain 1A (SWI-like) | 1412380 | 94 | 83 | 79 | 5 | 2 | 7 | 5 | 1 | 65 | 14 | 0.00015 | 4.33e-15 | 9.66e-12 |
| 8 | CTCF | CCCTC-binding factor (zinc finger protein) | 547098 | 49 | 45 | 39 | 1 | 8 | 4 | 7 | 0 | 27 | 3 | 0.00095 | 4.55e-15 | 9.66e-12 |
| 9 | FGFR2 | fibroblast growth factor receptor 2 (bacteria-expressed kinase, keratinocyte growth factor receptor, craniofacial dysostosis 1, Crouzon syndrome, Pfeiffer syndrome, Jackson-Weiss syndrome) | 687457 | 34 | 31 | 19 | 3 | 3 | 5 | 13 | 9 | 3 | 1 | 0.0097 | 6.55e-15 | 1.17e-11 |
| 10 | SPOP | speckle-type POZ protein | 287083 | 23 | 21 | 18 | 0 | 5 | 8 | 6 | 0 | 4 | 0 | 0.0041 | 7.44e-15 | 1.17e-11 |
| 11 | CTNNB1 | catenin (cadherin-associated protein), beta 1, 88kDa | 592248 | 80 | 74 | 25 | 7 | 5 | 61 | 14 | 0 | 0 | 0 | 0.0034 | 7.55e-15 | 1.17e-11 |
| 12 | FBXW7 | F-box and WD repeat domain containing 7 | 638720 | 46 | 39 | 30 | 1 | 22 | 12 | 2 | 1 | 8 | 1 | 0.00048 | 9.88e-15 | 1.40e-11 |
| 13 | PPP2R1A | protein phosphatase 2 (formerly 2A), regulatory subunit A , alpha isoform | 434902 | 30 | 27 | 18 | 3 | 10 | 17 | 1 | 0 | 2 | 0 | 0.0026 | 3.16e-14 | 4.13e-11 |
| 14 | P2RY11 | purinergic receptor P2Y, G-protein coupled, 11 | 4342 | 7 | 9 | 9 | 1 | 1 | 4 | 0 | 1 | 1 | 0 | 0.19 | 5.52e-14 | 6.69e-11 |
| 15 | CCND1 | cyclin D1 | 154874 | 15 | 15 | 13 | 1 | 1 | 7 | 3 | 0 | 4 | 0 | 0.083 | 1.23e-11 | 1.39e-08 |
| 16 | CHD4 | chromodomain helicase DNA binding protein 4 | 1452335 | 43 | 35 | 38 | 2 | 16 | 16 | 8 | 0 | 2 | 1 | 0.0045 | 4.08e-11 | 4.33e-08 |
| 17 | FOXA2 | forkhead box A2 | 222670 | 13 | 12 | 13 | 1 | 1 | 3 | 3 | 0 | 6 | 0 | 0.26 | 2.85e-08 | 2.84e-05 |
| 18 | NFE2L2 | nuclear factor (erythroid-derived 2)-like 2 | 446498 | 15 | 15 | 12 | 0 | 2 | 3 | 5 | 3 | 2 | 0 | 0.018 | 3.46e-08 | 3.26e-05 |
| 19 | SOX17 | SRY (sex determining region Y)-box 17 | 77226 | 7 | 7 | 3 | 0 | 0 | 6 | 0 | 0 | 1 | 0 | 0.13 | 5.96e-08 | 5.33e-05 |
| 20 | FAM9A | family with sequence similarity 9, member A | 249932 | 20 | 14 | 20 | 1 | 2 | 12 | 1 | 0 | 4 | 1 | 0.1 | 1.09e-07 | 9.24e-05 |
| 21 | TNFAIP6 | tumor necrosis factor, alpha-induced protein 6 | 212609 | 12 | 12 | 8 | 0 | 2 | 4 | 0 | 0 | 6 | 0 | 0.18 | 5.95e-06 | 0.00481 |
| 22 | MAX | MYC associated factor X | 205913 | 12 | 11 | 8 | 0 | 3 | 3 | 5 | 0 | 1 | 0 | 0.05 | 1.60e-05 | 0.0123 |
| 23 | ZNF267 | zinc finger protein 267 | 555952 | 22 | 16 | 19 | 1 | 10 | 5 | 3 | 1 | 3 | 0 | 0.13 | 2.16e-05 | 0.0159 |
| 24 | CYLC1 | cylicin, basic protein of sperm head cytoskeleton 1 | 477704 | 27 | 18 | 27 | 2 | 0 | 16 | 7 | 0 | 4 | 0 | 0.13 | 2.86e-05 | 0.0202 |
| 25 | RBMX | RNA binding motif protein, X-linked | 309438 | 14 | 13 | 8 | 0 | 1 | 4 | 2 | 0 | 7 | 0 | 0.3 | 4.62e-05 | 0.0314 |
| 26 | MORC4 | MORC family CW-type zinc finger 4 | 675031 | 28 | 20 | 26 | 2 | 6 | 10 | 1 | 0 | 11 | 0 | 0.09 | 6.33e-05 | 0.0413 |
| 27 | ARID5B | AT rich interactive domain 5B (MRF1-like) | 886908 | 34 | 29 | 34 | 9 | 5 | 5 | 8 | 2 | 13 | 1 | 0.57 | 0.000116 | 0.0729 |
| 28 | CTXN3 | cortexin 3 | 61945 | 6 | 6 | 6 | 0 | 1 | 4 | 0 | 1 | 0 | 0 | 0.21 | 0.000162 | 0.0967 |
| 29 | CSDE1 | cold shock domain containing E1, RNA-binding | 638142 | 32 | 21 | 28 | 3 | 12 | 9 | 5 | 1 | 5 | 0 | 0.067 | 0.000165 | 0.0967 |
| 30 | RPL14 | ribosomal protein L14 | 165361 | 8 | 7 | 4 | 0 | 0 | 1 | 0 | 2 | 5 | 0 | 0.36 | 0.000181 | 0.101 |
| 31 | RASA1 | RAS p21 protein activator (GTPase activating protein) 1 | 776972 | 30 | 22 | 28 | 3 | 5 | 9 | 4 | 0 | 11 | 1 | 0.094 | 0.000185 | 0.101 |
| 32 | PAPD4 | PAP associated domain containing 4 | 374378 | 13 | 13 | 13 | 1 | 3 | 5 | 3 | 0 | 2 | 0 | 0.26 | 0.000197 | 0.105 |
| 33 | DNER | delta/notch-like EGF repeat containing | 485604 | 21 | 18 | 20 | 1 | 4 | 9 | 5 | 0 | 3 | 0 | 0.011 | 0.000235 | 0.121 |
| 34 | TAB3 | TGF-beta activated kinase 1/MAP3K7 binding protein 3 | 535844 | 21 | 18 | 21 | 2 | 2 | 11 | 4 | 0 | 3 | 1 | 0.18 | 0.000276 | 0.138 |
| 35 | UPF3B | UPF3 regulator of nonsense transcripts homolog B (yeast) | 370922 | 20 | 16 | 20 | 1 | 4 | 8 | 6 | 0 | 2 | 0 | 0.084 | 0.000285 | 0.138 |
In this analysis, COSMIC is used as a filter to increase power by restricting the territory of each gene. Cosmic version: v48.
Table 4. Get Full Table Significantly mutated genes (COSMIC territory only). To access the database please go to: COSMIC. Number of significant genes found: 46. Number of genes displayed: 10
| rank | gene | description | n | cos | n_cos | N_cos | cos_ev | p | q |
|---|---|---|---|---|---|---|---|---|---|
| 1 | PIK3R1 | phosphoinositide-3-kinase, regulatory subunit 1 (alpha) | 100 | 33 | 39 | 8184 | 111 | 0 | 0 |
| 2 | KRAS | v-Ki-ras2 Kirsten rat sarcoma viral oncogene homolog | 53 | 52 | 49 | 12896 | 556649 | 0 | 0 |
| 3 | PIK3CA | phosphoinositide-3-kinase, catalytic, alpha polypeptide | 172 | 220 | 150 | 54560 | 35669 | 0 | 0 |
| 4 | CTNNB1 | catenin (cadherin-associated protein), beta 1, 88kDa | 80 | 138 | 67 | 34224 | 23813 | 0 | 0 |
| 5 | FGFR2 | fibroblast growth factor receptor 2 (bacteria-expressed kinase, keratinocyte growth factor receptor, craniofacial dysostosis 1, Crouzon syndrome, Pfeiffer syndrome, Jackson-Weiss syndrome) | 34 | 51 | 24 | 12648 | 113 | 0 | 0 |
| 6 | FBXW7 | F-box and WD repeat domain containing 7 | 46 | 91 | 29 | 22568 | 852 | 0 | 0 |
| 7 | PTEN | phosphatase and tensin homolog (mutated in multiple advanced cancers 1) | 228 | 767 | 219 | 190216 | 15125 | 0 | 0 |
| 8 | TP53 | tumor protein p53 | 74 | 356 | 72 | 88288 | 24186 | 0 | 0 |
| 9 | NRAS | neuroblastoma RAS viral (v-ras) oncogene homolog | 9 | 33 | 6 | 8184 | 6490 | 1.4e-08 | 6.6e-06 |
| 10 | RB1 | retinoblastoma 1 (including osteosarcoma) | 26 | 267 | 11 | 66216 | 30 | 6.7e-08 | 0.000029 |
Note:
n - number of (nonsilent) mutations in this gene across the individual set.
cos = number of unique mutated sites in this gene in COSMIC
n_cos = overlap between n and cos.
N_cos = number of individuals times cos.
cos_ev = total evidence: number of reports in COSMIC for mutations seen in this gene.
p = p-value for seeing the observed amount of overlap in this gene)
q = q-value, False Discovery Rate (Benjamini-Hochberg procedure)
Table 5. Get Full Table Genes with Clustered Mutations
| num | gene | desc | n | mindist | nmuts0 | nmuts3 | nmuts12 | npairs0 | npairs3 | npairs12 |
|---|---|---|---|---|---|---|---|---|---|---|
| 10508 | PTEN | phosphatase and tensin homolog (mutated in multiple advanced cancers 1) | 228 | 0 | 1624 | 2112 | 3003 | 1624 | 2112 | 3003 |
| 6934 | KRAS | v-Ki-ras2 Kirsten rat sarcoma viral oncogene homolog | 53 | 0 | 669 | 993 | 1039 | 669 | 993 | 1039 |
| 9759 | PIK3CA | phosphoinositide-3-kinase, catalytic, alpha polypeptide | 172 | 0 | 573 | 1075 | 1553 | 573 | 1075 | 1553 |
| 2898 | CTNNB1 | catenin (cadherin-associated protein), beta 1, 88kDa | 80 | 0 | 434 | 1165 | 2176 | 434 | 1165 | 2176 |
| 13871 | TP53 | tumor protein p53 | 74 | 0 | 89 | 167 | 417 | 89 | 167 | 417 |
| 4595 | FGFR2 | fibroblast growth factor receptor 2 (bacteria-expressed kinase, keratinocyte growth factor receptor, craniofacial dysostosis 1, Crouzon syndrome, Pfeiffer syndrome, Jackson-Weiss syndrome) | 34 | 0 | 56 | 56 | 78 | 56 | 56 | 78 |
| 4507 | FBXW7 | F-box and WD repeat domain containing 7 | 46 | 0 | 50 | 53 | 68 | 50 | 53 | 68 |
| 10024 | POLE | polymerase (DNA directed), epsilon | 47 | 0 | 39 | 42 | 60 | 39 | 42 | 60 |
| 10191 | PPP2R1A | protein phosphatase 2 (formerly 2A), regulatory subunit A , alpha isoform | 30 | 0 | 37 | 48 | 77 | 37 | 48 | 77 |
| 14208 | TTN | titin | 526 | 0 | 36 | 54 | 106 | 36 | 54 | 106 |
Note:
n - number of mutations in this gene in the individual set.
mindist - distance (in aa) between closest pair of mutations in this gene
npairs3 - how many pairs of mutations are within 3 aa of each other.
npairs12 - how many pairs of mutations are within 12 aa of each other.
Table 6. Get Full Table A Ranked List of Significantly Mutated Genesets. (Source: MSigDB GSEA Cannonical Pathway Set).Number of significant genesets found: 68. Number of genesets displayed: 10
| rank | geneset | description | genes | N_genes | mut_tally | N | n | npat | nsite | nsil | n1 | n2 | n3 | n4 | n5 | n6 | p_ns_s | p | q |
|---|---|---|---|---|---|---|---|---|---|---|---|---|---|---|---|---|---|---|---|
| 1 | MTORPATHWAY | Mammalian target of rapamycin (mTOR) senses mitogenic factors and nutrients, including ATP, and induces cell proliferation. | AKT1, EIF3S10, EIF4A1, EIF4A2, EIF4B, EIF4E, EIF4EBP1, EIF4G1, EIF4G2, EIF4G3, FKBP1A, FRAP1, MKNK1, PDK2, PDPK1, PIK3CA, PIK3R1, PPP2CA, PTEN, RPS6, RPS6KB1, TSC1, TSC2 | 21 | AKT1(4), EIF4A1(5), EIF4A2(9), EIF4B(7), EIF4E(2), EIF4G1(15), EIF4G2(7), EIF4G3(24), FKBP1A(1), MKNK1(3), PDK2(5), PDPK1(3), PIK3CA(172), PIK3R1(100), PPP2CA(6), PTEN(228), RPS6(7), RPS6KB1(5), TSC1(13), TSC2(15) | 9925342 | 631 | 218 | 417 | 44 | 91 | 141 | 126 | 38 | 191 | 44 | <1.00e-15 | <1.00e-15 | <3.96e-14 |
| 2 | IGF1MTORPATHWAY | Growth factor IGF-1 activates AKT, Gsk3-beta, and mTOR to promote muscle hypertrophy. | AKT1, EIF2B5, EIF2S1, EIF2S2, EIF2S3, EIF4E, EIF4EBP1, FRAP1, GSK3B, IGF1, IGF1R, INPPL1, PDK2, PDPK1, PIK3CA, PIK3R1, PPP2CA, PTEN, RPS6, RPS6KB1 | 19 | AKT1(4), EIF2B5(5), EIF2S1(2), EIF2S2(9), EIF2S3(6), EIF4E(2), GSK3B(13), IGF1(5), IGF1R(13), INPPL1(19), PDK2(5), PDPK1(3), PIK3CA(172), PIK3R1(100), PPP2CA(6), PTEN(228), RPS6(7), RPS6KB1(5) | 7138255 | 604 | 217 | 388 | 46 | 80 | 131 | 117 | 40 | 194 | 42 | <1.00e-15 | <1.00e-15 | <3.96e-14 |
| 3 | GSK3PATHWAY | Bacterial lipopolysaccharide activates AKT to promote the survival and activation of macrophages and inhibits Gsk3-beta to promote beta-catenin accumulation in the nucleus. | AKT1, APC, AXIN1, CCND1, CD14, CTNNB1, DVL1, FZD1, GJA1, GNAI1, GSK3B, IRAK1, LBP, LEF1, LY96, MYD88, NFKB1, PDPK1, PIK3CA, PIK3R1, PPP2CA, PRKR, RELA, TIRAP, TLR4, TOLLIP, WNT1 | 26 | AKT1(4), APC(56), AXIN1(9), CCND1(15), CD14(2), CTNNB1(80), DVL1(3), FZD1(3), GJA1(5), GNAI1(5), GSK3B(13), IRAK1(4), LBP(3), LEF1(9), LY96(4), MYD88(3), NFKB1(10), PDPK1(3), PIK3CA(172), PIK3R1(100), PPP2CA(6), RELA(6), TIRAP(2), TLR4(17), TOLLIP(1), WNT1(1) | 10634125 | 536 | 210 | 356 | 58 | 77 | 201 | 122 | 6 | 110 | 20 | 2.06e-13 | <1.00e-15 | <3.96e-14 |
| 4 | CREBPATHWAY | CREB is a transcription factor that binds to cAMP-responsive elements (CREs) to activate transcription in response to extracellular signaling. | ADCY1, AKT1, CAMK2A, CAMK2B, CAMK2D, CAMK2G, CREB1, GNAS, GRB2, HRAS, MAPK1, MAPK14, MAPK3, PIK3CA, PIK3R1, PRKACB, PRKACG, PRKAR1A, PRKAR1B, PRKAR2A, PRKAR2B, PRKCA, PRKCB1, RAC1, RPS6KA1, RPS6KA5, SOS1 | 26 | ADCY1(21), AKT1(4), CAMK2A(9), CAMK2B(3), CAMK2D(5), CAMK2G(5), CREB1(6), GNAS(24), GRB2(3), HRAS(1), MAPK1(2), MAPK14(4), MAPK3(3), PIK3CA(172), PIK3R1(100), PRKACB(3), PRKACG(9), PRKAR1A(4), PRKAR1B(4), PRKAR2A(4), PRKAR2B(3), PRKCA(10), RAC1(1), RPS6KA1(1), RPS6KA5(11), SOS1(13) | 10330216 | 425 | 200 | 300 | 54 | 88 | 113 | 111 | 5 | 92 | 16 | 4.56e-08 | <1.00e-15 | <3.96e-14 |
| 5 | IL7PATHWAY | IL-7 is required for B and T cell development and proliferation and may contribute to activation of VDJ recombination. | BCL2, CREBBP, EP300, FYN, IL2RG, IL7, IL7R, JAK1, JAK3, LCK, NMI, PIK3CA, PIK3R1, PTK2B, STAT5A, STAT5B | 16 | CREBBP(32), EP300(32), FYN(7), IL2RG(13), IL7(1), IL7R(12), JAK1(20), JAK3(10), LCK(5), NMI(3), PIK3CA(172), PIK3R1(100), PTK2B(16), STAT5A(5), STAT5B(7) | 10213532 | 435 | 200 | 312 | 56 | 77 | 121 | 115 | 6 | 100 | 16 | 3.60e-08 | <1.00e-15 | <3.96e-14 |
| 6 | EGFPATHWAY | The epidermal growth factor (EGF) peptide stimulates the EGF receptor to promote cell proliferation via the MAP kinase and Ras pathways. | CSNK2A1, EGF, EGFR, ELK1, FOS, GRB2, HRAS, JAK1, JUN, MAP2K1, MAP2K4, MAP3K1, MAPK3, MAPK8, PIK3CA, PIK3R1, PLCG1, PRKCA, PRKCB1, RAF1, RASA1, SHC1, SOS1, SRF, STAT1, STAT3, STAT5A | 26 | CSNK2A1(9), EGF(20), EGFR(12), ELK1(3), FOS(3), GRB2(3), HRAS(1), JAK1(20), JUN(1), MAP2K1(2), MAP2K4(9), MAP3K1(30), MAPK3(3), MAPK8(10), PIK3CA(172), PIK3R1(100), PLCG1(12), PRKCA(10), RAF1(8), RASA1(30), SHC1(7), SOS1(13), SRF(3), STAT1(15), STAT3(10), STAT5A(5) | 13675029 | 511 | 199 | 380 | 61 | 99 | 144 | 131 | 4 | 116 | 17 | 8.39e-11 | <1.00e-15 | <3.96e-14 |
| 7 | ERK5PATHWAY | Signaling between a tissue and its innervating axon stimulates retrograde transport via Trk receptors, which activate Erk5, which induces transcription of anti-apoptotic factors. | AKT1, CREB1, GRB2, HRAS, MAPK1, MAPK3, MAPK7, MEF2A, MEF2B, MEF2C, MEF2D, NTRK1, PIK3CA, PIK3R1, PLCG1, RPS6KA1, SHC1 | 17 | AKT1(4), CREB1(6), GRB2(3), HRAS(1), MAPK1(2), MAPK3(3), MAPK7(14), MEF2A(3), MEF2B(1), MEF2C(11), MEF2D(7), NTRK1(13), PIK3CA(172), PIK3R1(100), PLCG1(12), RPS6KA1(1), SHC1(7) | 7017966 | 360 | 199 | 240 | 37 | 64 | 100 | 96 | 6 | 79 | 15 | 1.94e-09 | <1.00e-15 | <3.96e-14 |
| 8 | PAR1PATHWAY | Activated extracellular thrombin cleaves and activates the G-protein coupled receptors PAR1 and PAR4, which activate platelets. | ADCY1, ARHA, ARHGEF1, F2, F2R, F2RL3, GNA12, GNA13, GNAI1, GNAQ, GNB1, GNGT1, MAP3K7, PIK3CA, PIK3R1, PLCB1, PPP1R12B, PRKCA, PRKCB1, PTK2B, ROCK1 | 19 | ADCY1(21), ARHGEF1(12), F2(8), F2R(6), GNA12(8), GNA13(7), GNAI1(5), GNAQ(3), GNB1(2), GNGT1(1), MAP3K7(9), PIK3CA(172), PIK3R1(100), PLCB1(5), PPP1R12B(20), PRKCA(10), PTK2B(16), ROCK1(22) | 9289594 | 427 | 199 | 304 | 63 | 96 | 111 | 112 | 7 | 84 | 17 | 2.95e-06 | <1.00e-15 | <3.96e-14 |
| 9 | GCRPATHWAY | Corticosteroids activate the glucocorticoid receptor (GR), which inhibits NF-kB and activates Annexin-1, thus inhibiting the inflammatory response. | ADRB2, AKT1, ANXA1, CALM1, CALM2, CALM3, CRN, GNAS, GNB1, GNGT1, HSPCA, NFKB1, NOS3, NPPA, NR3C1, PIK3CA, PIK3R1, RELA, SYT1 | 17 | ADRB2(7), AKT1(4), ANXA1(5), CALM1(2), CALM2(4), GNAS(24), GNB1(2), GNGT1(1), NFKB1(10), NOS3(11), NPPA(2), NR3C1(18), PIK3CA(172), PIK3R1(100), RELA(6), SYT1(4) | 6288912 | 372 | 197 | 249 | 26 | 79 | 99 | 91 | 4 | 84 | 15 | 9.69e-14 | <1.00e-15 | <3.96e-14 |
| 10 | RASPATHWAY | Ras activation stimulates many signaling cascades, including PI3K/AKT activation to inhibit apoptosis. | AKT1, ARHA, BAD, BCL2L1, CASP9, CDC42, CHUK, ELK1, H2AFX, HRAS, MAP2K1, MAPK3, MLLT7, NFKB1, PIK3CA, PIK3R1, RAC1, RAF1, RALA, RALBP1, RALGDS, RELA, RHOA | 21 | AKT1(4), BAD(2), BCL2L1(4), CASP9(3), CDC42(4), CHUK(8), ELK1(3), H2AFX(1), HRAS(1), MAP2K1(2), MAPK3(3), NFKB1(10), PIK3CA(172), PIK3R1(100), RAC1(1), RAF1(8), RALA(6), RALBP1(6), RALGDS(9), RELA(6), RHOA(3) | 6942603 | 356 | 197 | 235 | 28 | 56 | 106 | 95 | 4 | 78 | 17 | 4.18e-12 | <1.00e-15 | <3.96e-14 |
Table 7. Get Full Table A Ranked List of Significantly Mutated Genesets (Excluding Significantly Mutated Genes). Number of significant genesets found: 0. Number of genesets displayed: 10
| rank | geneset | description | genes | N_genes | mut_tally | N | n | npat | nsite | nsil | n1 | n2 | n3 | n4 | n5 | n6 | p_ns_s | p | q |
|---|---|---|---|---|---|---|---|---|---|---|---|---|---|---|---|---|---|---|---|
| 1 | HSA00627_1,4_DICHLOROBENZENE_DEGRADATION | Genes involved in 1,4-dichlorobenzene degradation | CMBL | 1 | CMBL(3) | 187727 | 3 | 3 | 3 | 1 | 0 | 1 | 0 | 1 | 1 | 0 | 0.81 | 0.21 | 1 |
| 2 | PEPIPATHWAY | Proepithelin (PEPI) induces epithelial cells to secrete IL-8, which promotes elastase secretion by neutrophils. | ELA1, ELA2, ELA2A, ELA2B, ELA3B, GRN, IL8, SLPI | 3 | GRN(5), IL8(3), SLPI(2) | 572860 | 10 | 10 | 9 | 0 | 2 | 5 | 2 | 0 | 1 | 0 | 0.057 | 0.28 | 1 |
| 3 | HSA00472_D_ARGININE_AND_D_ORNITHINE_METABOLISM | Genes involved in D-arginine and D-ornithine metabolism | DAO | 1 | DAO(8) | 264662 | 8 | 6 | 8 | 1 | 2 | 4 | 2 | 0 | 0 | 0 | 0.3 | 0.35 | 1 |
| 4 | TCRMOLECULE | T Cell Receptor and CD3 Complex | CD3D, CD3E, CD3G, CD3Z, TRA@, TRB@ | 3 | CD3D(6), CD3E(2), CD3G(3) | 433293 | 11 | 7 | 11 | 1 | 1 | 7 | 0 | 0 | 3 | 0 | 0.18 | 0.44 | 1 |
| 5 | LDLPATHWAY | Low density lipoproteins (LDL) are present in blood plasma, contain cholesterol and triglycerides, and contribute to atherogenic plaque formation. | ACAT1, CCL2, CSF1, IL6, LDLR, LPL | 6 | ACAT1(6), CSF1(6), IL6(5), LDLR(6), LPL(16) | 1914084 | 39 | 23 | 39 | 7 | 10 | 15 | 9 | 0 | 5 | 0 | 0.057 | 0.46 | 1 |
| 6 | IL17PATHWAY | Activated T cells secrete IL-17, which stimulates fibroblasts and other cells to secrete inflammatory and hematopoietic cytokines. | CD2, CD34, CD3D, CD3E, CD3G, CD3Z, CD4, CD58, CD8A, CSF3, IL17, IL3, IL6, IL8, KITLG, TRA@, TRB@ | 13 | CD2(4), CD34(1), CD3D(6), CD3E(2), CD3G(3), CD4(6), CD58(2), CD8A(2), CSF3(1), IL3(2), IL6(5), IL8(3), KITLG(3) | 2309359 | 40 | 27 | 40 | 9 | 6 | 20 | 4 | 0 | 10 | 0 | 0.18 | 0.49 | 1 |
| 7 | HSA00643_STYRENE_DEGRADATION | Genes involved in styrene degradation | FAH, GSTZ1, HGD | 3 | FAH(6), GSTZ1(5), HGD(4) | 822142 | 15 | 12 | 15 | 2 | 5 | 4 | 4 | 0 | 2 | 0 | 0.11 | 0.51 | 1 |
| 8 | PLK3PATHWAY | Active Plk3 phosphorylates CDC25c, blocking the G2/M transition, and phosphorylates p53 to induce apoptosis. | ATM, ATR, CDC25C, CHEK1, CHEK2, CNK, TP53, YWHAH | 6 | ATM(54), ATR(43), CDC25C(5), CHEK1(2), CHEK2(14), YWHAH(3) | 5603547 | 121 | 49 | 114 | 17 | 18 | 41 | 26 | 0 | 32 | 4 | 0.047 | 0.55 | 1 |
| 9 | HSA00031_INOSITOL_METABOLISM | Genes involved in inositol metabolism | ALDH6A1, TPI1 | 2 | ALDH6A1(6), TPI1(2) | 582980 | 8 | 7 | 8 | 1 | 0 | 3 | 1 | 0 | 4 | 0 | 0.27 | 0.57 | 1 |
| 10 | HSA00401_NOVOBIOCIN_BIOSYNTHESIS | Genes involved in novobiocin biosynthesis | GOT1, GOT2, TAT | 3 | GOT1(9), GOT2(3), TAT(7) | 959929 | 19 | 13 | 19 | 2 | 7 | 6 | 5 | 1 | 0 | 0 | 0.088 | 0.64 | 1 |
In brief, we tabulate the number of mutations and the number of covered bases for each gene. The counts are broken down by mutation context category: four context categories that are discovered by MutSig, and one for indel and 'null' mutations, which include indels, nonsense mutations, splice-site mutations, and non-stop (read-through) mutations. For each gene, we calculate the probability of seeing the observed constellation of mutations, i.e. the product P1 x P2 x ... x Pm, or a more extreme one, given the background mutation rates calculated across the dataset. [1]
In addition to the links below, the full results of the analysis summarized in this report can also be downloaded programmatically using firehose_get, or interactively from either the Broad GDAC website or TCGA Data Coordination Center Portal.