This pipeline computes the correlation between significant copy number variation (cnv focal) genes and selected clinical features.
Testing the association between copy number variation 56 focal events and 2 clinical features across 14 patients, one significant finding detected with Q value < 0.25.
-
DEL PEAK 11(7Q36.2) MUTATION ANALYSIS cnv correlated to 'AGE'.
Table 1. Get Full Table Overview of the association between significant copy number variation of 56 focal events and 2 clinical features. Shown in the table are P values (Q values). Thresholded by Q value < 0.25, one significant finding detected.
|
Clinical Features |
Time to Death |
AGE | ||
| nCNV (%) | nWild-Type | logrank test | t-test | |
| DEL PEAK 11(7Q36 2) MUTATION ANALYSIS | 7 (50%) | 7 |
0.105 (1.00) |
0.00221 (0.247) |
| AMP PEAK 1(1Q22) MUTATION ANALYSIS | 9 (64%) | 5 |
0.293 (1.00) |
0.409 (1.00) |
| AMP PEAK 2(2P14) MUTATION ANALYSIS | 7 (50%) | 7 |
0.207 (1.00) |
0.22 (1.00) |
| AMP PEAK 3(2Q13) MUTATION ANALYSIS | 7 (50%) | 7 |
0.811 (1.00) |
0.272 (1.00) |
| AMP PEAK 4(3P25 1) MUTATION ANALYSIS | 6 (43%) | 8 |
0.762 (1.00) |
0.249 (1.00) |
| AMP PEAK 5(3Q26 2) MUTATION ANALYSIS | 9 (64%) | 5 |
0.762 (1.00) |
0.264 (1.00) |
| AMP PEAK 6(4P16 3) MUTATION ANALYSIS | 7 (50%) | 7 |
0.0726 (1.00) |
0.101 (1.00) |
| AMP PEAK 7(5P13 2) MUTATION ANALYSIS | 6 (43%) | 8 |
0.548 (1.00) |
0.354 (1.00) |
| AMP PEAK 8(6P24 2) MUTATION ANALYSIS | 10 (71%) | 4 |
0.987 (1.00) |
0.562 (1.00) |
| AMP PEAK 9(8P11 21) MUTATION ANALYSIS | 3 (21%) | 11 |
0.605 (1.00) |
0.039 (1.00) |
| AMP PEAK 10(8Q11 23) MUTATION ANALYSIS | 6 (43%) | 8 |
0.84 (1.00) |
0.282 (1.00) |
| AMP PEAK 11(8Q24 21) MUTATION ANALYSIS | 11 (79%) | 3 |
0.972 (1.00) |
0.558 (1.00) |
| AMP PEAK 12(8Q24 21) MUTATION ANALYSIS | 10 (71%) | 4 |
0.903 (1.00) |
0.528 (1.00) |
| AMP PEAK 13(10Q22 2) MUTATION ANALYSIS | 8 (57%) | 6 |
0.344 (1.00) |
0.719 (1.00) |
| AMP PEAK 14(11Q13 1) MUTATION ANALYSIS | 6 (43%) | 8 |
0.302 (1.00) |
0.544 (1.00) |
| AMP PEAK 15(12Q12) MUTATION ANALYSIS | 5 (36%) | 9 |
0.135 (1.00) |
0.613 (1.00) |
| AMP PEAK 16(12Q15) MUTATION ANALYSIS | 6 (43%) | 8 |
0.128 (1.00) |
0.583 (1.00) |
| AMP PEAK 17(13Q31 3) MUTATION ANALYSIS | 6 (43%) | 8 |
0.844 (1.00) |
0.686 (1.00) |
| AMP PEAK 18(16P11 2) MUTATION ANALYSIS | 3 (21%) | 11 |
0.356 (1.00) |
0.636 (1.00) |
| AMP PEAK 19(17Q12) MUTATION ANALYSIS | 10 (71%) | 4 |
0.901 (1.00) |
0.908 (1.00) |
| AMP PEAK 20(17Q25 1) MUTATION ANALYSIS | 7 (50%) | 7 |
0.476 (1.00) |
0.174 (1.00) |
| AMP PEAK 21(19P13 2) MUTATION ANALYSIS | 3 (21%) | 11 |
0.217 (1.00) |
0.701 (1.00) |
| AMP PEAK 25(XP11 21) MUTATION ANALYSIS | 4 (29%) | 10 |
0.846 (1.00) |
0.0098 (1.00) |
| DEL PEAK 1(1P36 21) MUTATION ANALYSIS | 5 (36%) | 9 |
0.448 (1.00) |
0.616 (1.00) |
| DEL PEAK 2(2Q22 1) MUTATION ANALYSIS | 3 (21%) | 11 |
0.0855 (1.00) |
0.378 (1.00) |
| DEL PEAK 3(3P21 1) MUTATION ANALYSIS | 8 (57%) | 6 |
0.652 (1.00) |
0.86 (1.00) |
| DEL PEAK 4(3P14 1) MUTATION ANALYSIS | 7 (50%) | 7 |
0.382 (1.00) |
0.765 (1.00) |
| DEL PEAK 5(3Q13 31) MUTATION ANALYSIS | 6 (43%) | 8 |
0.98 (1.00) |
0.64 (1.00) |
| DEL PEAK 6(4Q22 1) MUTATION ANALYSIS | 9 (64%) | 5 |
0.185 (1.00) |
0.504 (1.00) |
| DEL PEAK 7(4Q34 3) MUTATION ANALYSIS | 9 (64%) | 5 |
0.185 (1.00) |
0.288 (1.00) |
| DEL PEAK 8(5Q11 2) MUTATION ANALYSIS | 7 (50%) | 7 |
0.774 (1.00) |
0.589 (1.00) |
| DEL PEAK 9(6Q26) MUTATION ANALYSIS | 4 (29%) | 10 |
0.87 (1.00) |
0.307 (1.00) |
| DEL PEAK 10(7Q11 22) MUTATION ANALYSIS | 6 (43%) | 8 |
0.287 (1.00) |
0.993 (1.00) |
| DEL PEAK 12(8P23 2) MUTATION ANALYSIS | 8 (57%) | 6 |
0.635 (1.00) |
0.894 (1.00) |
| DEL PEAK 13(9P23) MUTATION ANALYSIS | 6 (43%) | 8 |
0.127 (1.00) |
0.38 (1.00) |
| DEL PEAK 14(9Q21 13) MUTATION ANALYSIS | 11 (79%) | 3 |
0.379 (1.00) |
0.289 (1.00) |
| DEL PEAK 15(9Q33 3) MUTATION ANALYSIS | 10 (71%) | 4 |
0.436 (1.00) |
0.295 (1.00) |
| DEL PEAK 16(10Q21 1) MUTATION ANALYSIS | 3 (21%) | 11 |
0.744 (1.00) |
0.534 (1.00) |
| DEL PEAK 17(10Q23 31) MUTATION ANALYSIS | 3 (21%) | 11 |
0.503 (1.00) |
0.168 (1.00) |
| DEL PEAK 18(11P15 5) MUTATION ANALYSIS | 4 (29%) | 10 |
0.349 (1.00) |
0.266 (1.00) |
| DEL PEAK 19(11Q14 1) MUTATION ANALYSIS | 7 (50%) | 7 |
0.144 (1.00) |
0.811 (1.00) |
| DEL PEAK 20(11Q24 2) MUTATION ANALYSIS | 7 (50%) | 7 |
0.164 (1.00) |
0.635 (1.00) |
| DEL PEAK 21(12Q23 1) MUTATION ANALYSIS | 3 (21%) | 11 |
0.823 (1.00) |
0.937 (1.00) |
| DEL PEAK 22(12Q24 31) MUTATION ANALYSIS | 4 (29%) | 10 |
0.707 (1.00) |
0.465 (1.00) |
| DEL PEAK 23(13Q12 11) MUTATION ANALYSIS | 7 (50%) | 7 |
0.617 (1.00) |
0.362 (1.00) |
| DEL PEAK 24(13Q14 2) MUTATION ANALYSIS | 7 (50%) | 7 |
0.617 (1.00) |
0.362 (1.00) |
| DEL PEAK 25(14Q21 1) MUTATION ANALYSIS | 9 (64%) | 5 |
0.331 (1.00) |
0.47 (1.00) |
| DEL PEAK 26(15Q14) MUTATION ANALYSIS | 11 (79%) | 3 |
0.675 (1.00) |
0.496 (1.00) |
| DEL PEAK 27(16Q23 1) MUTATION ANALYSIS | 10 (71%) | 4 |
0.295 (1.00) |
0.596 (1.00) |
| DEL PEAK 28(17P13 1) MUTATION ANALYSIS | 10 (71%) | 4 |
0.379 (1.00) |
0.253 (1.00) |
| DEL PEAK 29(17Q21 32) MUTATION ANALYSIS | 4 (29%) | 10 |
0.0886 (1.00) |
0.566 (1.00) |
| DEL PEAK 30(18Q22 2) MUTATION ANALYSIS | 5 (36%) | 9 |
0.355 (1.00) |
0.376 (1.00) |
| DEL PEAK 32(19Q13 33) MUTATION ANALYSIS | 6 (43%) | 8 |
0.302 (1.00) |
0.544 (1.00) |
| DEL PEAK 34(22Q13 31) MUTATION ANALYSIS | 11 (79%) | 3 |
0.391 (1.00) |
0.191 (1.00) |
| DEL PEAK 35(XP21 1) MUTATION ANALYSIS | 8 (57%) | 6 |
0.246 (1.00) |
0.752 (1.00) |
| DEL PEAK 36(XQ25) MUTATION ANALYSIS | 3 (21%) | 11 |
0.269 (1.00) |
0.645 (1.00) |
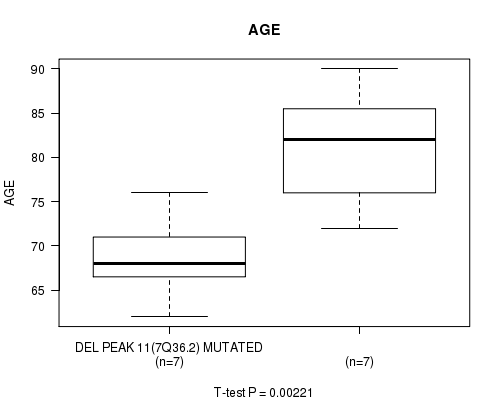
P value = 0.00221 (t-test), Q value = 0.25
Table S1. Gene #33: 'DEL PEAK 11(7Q36.2) MUTATION STATUS' versus Clinical Feature #2: 'AGE'
| nPatients | Mean (Std.Dev) | |
|---|---|---|
| ALL | 14 | 74.9 (8.4) |
| DEL PEAK 11(7Q36.2) MUTATED | 7 | 68.7 (4.6) |
| DEL PEAK 11(7Q36.2) WILD-TYPE | 7 | 81.0 (6.7) |
Figure S1. Get High-res Image Gene #33: 'DEL PEAK 11(7Q36.2) MUTATION STATUS' versus Clinical Feature #2: 'AGE'
-
Copy number data file = transformed.cor.cli.txt
-
Clinical data file = UCS-TP.clin.merged.picked.txt
-
Number of patients = 14
-
Number of significantly focal cnvs = 56
-
Number of selected clinical features = 2
-
Exclude genes that fewer than K tumors have mutations, K = 3
For survival clinical features, the Kaplan-Meier survival curves of tumors with and without gene mutations were plotted and the statistical significance P values were estimated by logrank test (Bland and Altman 2004) using the 'survdiff' function in R
For continuous numerical clinical features, two-tailed Student's t test with unequal variance (Lehmann and Romano 2005) was applied to compare the clinical values between tumors with and without gene mutations using 't.test' function in R
For multiple hypothesis correction, Q value is the False Discovery Rate (FDR) analogue of the P value (Benjamini and Hochberg 1995), defined as the minimum FDR at which the test may be called significant. We used the 'Benjamini and Hochberg' method of 'p.adjust' function in R to convert P values into Q values.
In addition to the links below, the full results of the analysis summarized in this report can also be downloaded programmatically using firehose_get, or interactively from either the Broad GDAC website or TCGA Data Coordination Center Portal.