This pipeline uses various statistical tests to identify mRNAs whose expression levels correlated to selected clinical features.
Testing the association between 18660 genes and 2 clinical features across 15 samples, statistically thresholded by Q value < 0.05, 1 clinical feature related to at least one genes.
-
3 genes correlated to 'AGE'.
-
PIGO|84720 , PPFIBP1|8496 , SPTLC2|9517
-
No genes correlated to 'Time to Death'
Complete statistical result table is provided in Supplement Table 1
Table 1. Get Full Table This table shows the clinical features, statistical methods used, and the number of genes that are significantly associated with each clinical feature at Q value < 0.05.
| Clinical feature | Statistical test | Significant genes | Associated with | Associated with | ||
|---|---|---|---|---|---|---|
| Time to Death | Cox regression test | N=0 | ||||
| AGE | Spearman correlation test | N=3 | older | N=3 | younger | N=0 |
Table S1. Basic characteristics of clinical feature: 'Time to Death'
| Time to Death | Duration (Months) | 4.8-102.4 (median=14.4) |
| censored | N = 9 | |
| death | N = 6 | |
| Significant markers | N = 0 |
Table S2. Basic characteristics of clinical feature: 'AGE'
| AGE | Mean (SD) | 74.2 (8.5) |
| Significant markers | N = 3 | |
| pos. correlated | 3 | |
| neg. correlated | 0 |
Table S3. Get Full Table List of 3 genes significantly correlated to 'AGE' by Spearman correlation test
| SpearmanCorr | corrP | Q | |
|---|---|---|---|
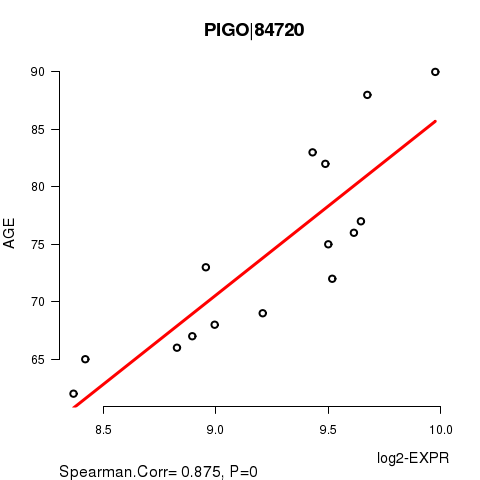
| PIGO|84720 | 0.875 | 0 | 0 |
| PPFIBP1|8496 | 0.8786 | 0 | 0 |
| SPTLC2|9517 | 0.8964 | 0 | 0 |
Figure S1. Get High-res Image As an example, this figure shows the association of PIGO|84720 to 'AGE'. P value = 0 with Spearman correlation analysis. The straight line presents the best linear regression.
-
Expresson data file = UCS-TP.uncv2.mRNAseq_RSEM_normalized_log2.txt
-
Clinical data file = UCS-TP.clin.merged.picked.txt
-
Number of patients = 15
-
Number of genes = 18660
-
Number of clinical features = 2
For survival clinical features, Wald's test in univariate Cox regression analysis with proportional hazards model (Andersen and Gill 1982) was used to estimate the P values using the 'coxph' function in R. Kaplan-Meier survival curves were plot using the four quartile subgroups of patients based on expression levels
For continuous numerical clinical features, Spearman's rank correlation coefficients (Spearman 1904) and two-tailed P values were estimated using 'cor.test' function in R
For multiple hypothesis correction, Q value is the False Discovery Rate (FDR) analogue of the P value (Benjamini and Hochberg 1995), defined as the minimum FDR at which the test may be called significant. We used the 'Benjamini and Hochberg' method of 'p.adjust' function in R to convert P values into Q values.
In addition to the links below, the full results of the analysis summarized in this report can also be downloaded programmatically using firehose_get, or interactively from either the Broad GDAC website or TCGA Data Coordination Center Portal.