This pipeline computes the correlation between significant arm-level copy number variations (cnvs) and molecular subtypes.
Testing the association between copy number variation 80 arm-level events and 10 molecular subtypes across 221 patients, 24 significant findings detected with P value < 0.05 and Q value < 0.25.
-
2p gain cnv correlated to 'CN_CNMF'.
-
7p gain cnv correlated to 'CN_CNMF'.
-
9p gain cnv correlated to 'CN_CNMF'.
-
10p gain cnv correlated to 'CN_CNMF'.
-
12p gain cnv correlated to 'CN_CNMF'.
-
17p gain cnv correlated to 'MIRSEQ_CHIERARCHICAL'.
-
18p gain cnv correlated to 'CN_CNMF'.
-
19q gain cnv correlated to 'CN_CNMF'.
-
21q gain cnv correlated to 'CN_CNMF', 'MIRSEQ_CNMF', and 'MIRSEQ_CHIERARCHICAL'.
-
2q loss cnv correlated to 'CN_CNMF'.
-
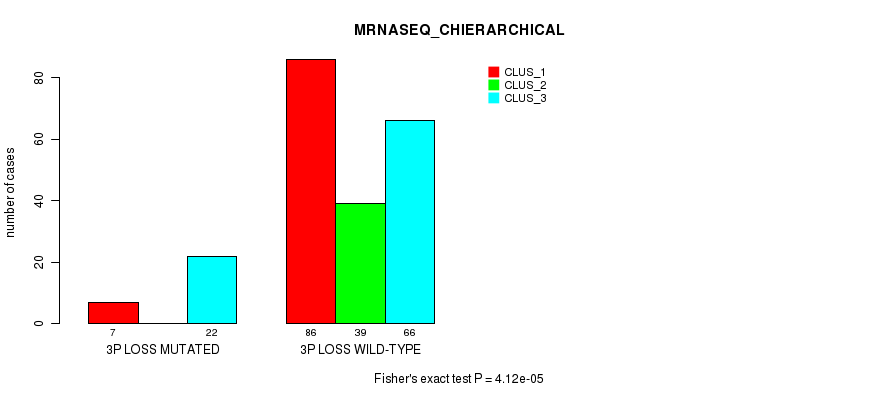
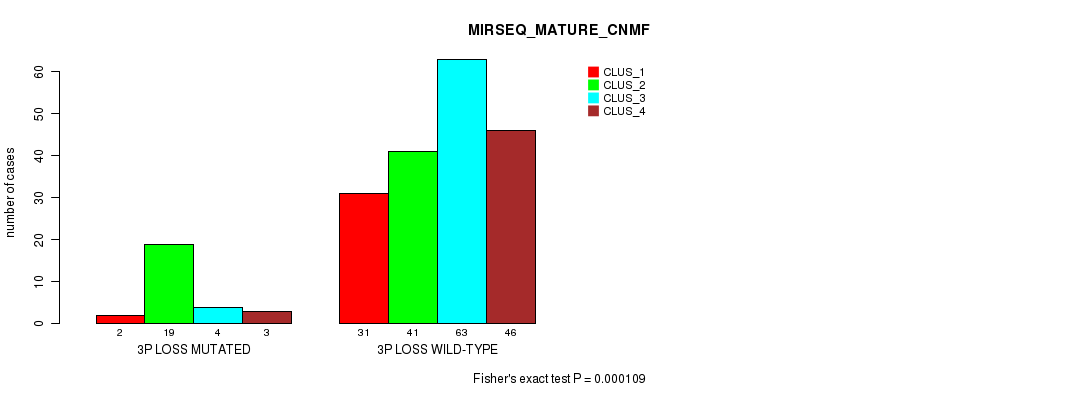
3p loss cnv correlated to 'MRNASEQ_CNMF', 'MRNASEQ_CHIERARCHICAL', and 'MIRSEQ_MATURE_CNMF'.
-
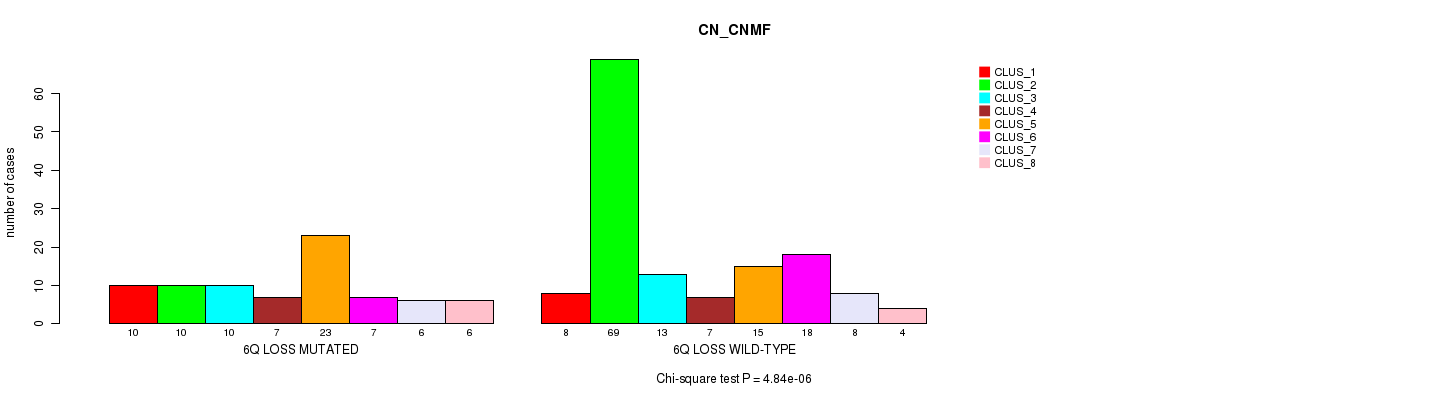
6q loss cnv correlated to 'CN_CNMF'.
-
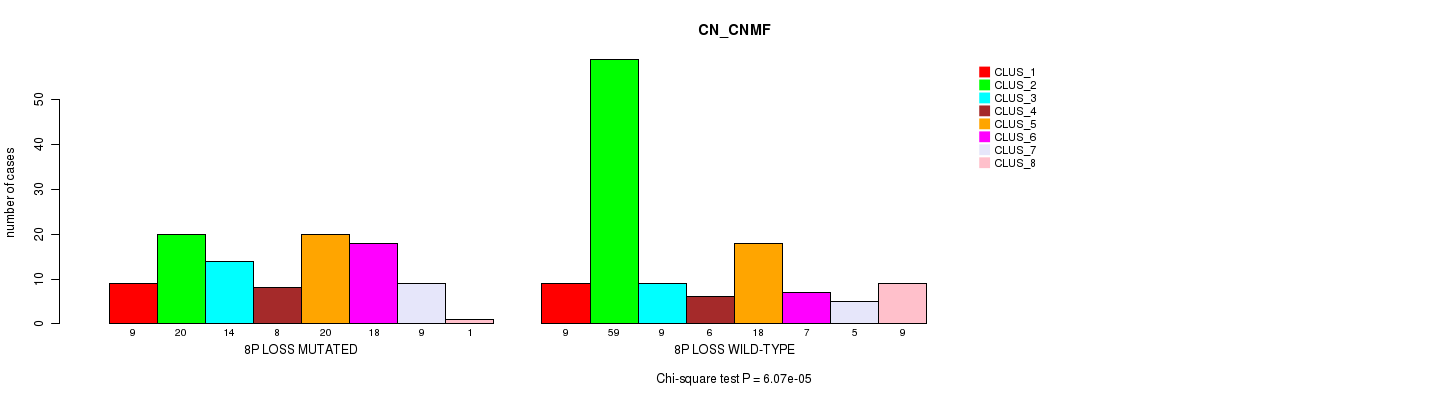
8p loss cnv correlated to 'CN_CNMF'.
-
9q loss cnv correlated to 'MRNASEQ_CHIERARCHICAL'.
-
11p loss cnv correlated to 'CN_CNMF' and 'METHLYATION_CNMF'.
-
11q loss cnv correlated to 'CN_CNMF'.
-
16p loss cnv correlated to 'CN_CNMF'.
-
16q loss cnv correlated to 'CN_CNMF'.
-
22q loss cnv correlated to 'CN_CNMF'.
Table 1. Get Full Table Overview of the association between significant copy number variation of 80 arm-level events and 10 molecular subtypes. Shown in the table are P values (Q values). Thresholded by P value < 0.05 and Q value < 0.25, 24 significant findings detected.
|
Clinical Features |
CN CNMF |
METHLYATION CNMF |
RPPA CNMF |
RPPA CHIERARCHICAL |
MRNASEQ CNMF |
MRNASEQ CHIERARCHICAL |
MIRSEQ CNMF |
MIRSEQ CHIERARCHICAL |
MIRSEQ MATURE CNMF |
MIRSEQ MATURE CHIERARCHICAL |
||
| nCNV (%) | nWild-Type | Chi-square test | Fisher's exact test | Chi-square test | Fisher's exact test | Fisher's exact test | Fisher's exact test | Fisher's exact test | Fisher's exact test | Fisher's exact test | Fisher's exact test | |
| 21q gain | 67 (30%) | 154 |
0.000204 (0.159) |
0.0245 (1.00) |
0.614 (1.00) |
0.568 (1.00) |
0.239 (1.00) |
0.209 (1.00) |
0.000176 (0.137) |
3.34e-05 (0.0263) |
0.0936 (1.00) |
0.00322 (1.00) |
| 3p loss | 29 (13%) | 192 |
0.0967 (1.00) |
0.0938 (1.00) |
0.0181 (1.00) |
0.0612 (1.00) |
1.15e-07 (9.17e-05) |
4.12e-05 (0.0325) |
0.283 (1.00) |
0.0408 (1.00) |
0.000109 (0.0853) |
0.000414 (0.318) |
| 11p loss | 89 (40%) | 132 |
1.08e-05 (0.00857) |
0.000101 (0.0789) |
0.256 (1.00) |
0.803 (1.00) |
0.126 (1.00) |
0.00244 (1.00) |
0.0422 (1.00) |
0.0488 (1.00) |
0.00852 (1.00) |
0.42 (1.00) |
| 2p gain | 66 (30%) | 155 |
6.97e-06 (0.00554) |
0.000868 (0.658) |
0.394 (1.00) |
0.783 (1.00) |
0.146 (1.00) |
0.29 (1.00) |
0.122 (1.00) |
0.0459 (1.00) |
0.175 (1.00) |
0.00973 (1.00) |
| 7p gain | 94 (43%) | 127 |
0.000108 (0.0842) |
0.000934 (0.707) |
0.0232 (1.00) |
0.858 (1.00) |
0.327 (1.00) |
0.89 (1.00) |
0.249 (1.00) |
0.249 (1.00) |
0.192 (1.00) |
0.21 (1.00) |
| 9p gain | 35 (16%) | 186 |
4.39e-05 (0.0346) |
0.756 (1.00) |
0.725 (1.00) |
0.595 (1.00) |
0.182 (1.00) |
0.282 (1.00) |
0.789 (1.00) |
0.94 (1.00) |
0.267 (1.00) |
0.126 (1.00) |
| 10p gain | 64 (29%) | 157 |
2.63e-06 (0.0021) |
0.332 (1.00) |
0.854 (1.00) |
0.493 (1.00) |
0.264 (1.00) |
0.0787 (1.00) |
0.675 (1.00) |
0.499 (1.00) |
0.498 (1.00) |
0.905 (1.00) |
| 12p gain | 67 (30%) | 154 |
9.03e-05 (0.0709) |
0.115 (1.00) |
0.732 (1.00) |
0.526 (1.00) |
0.194 (1.00) |
0.52 (1.00) |
0.521 (1.00) |
0.0474 (1.00) |
0.623 (1.00) |
0.0835 (1.00) |
| 17p gain | 32 (14%) | 189 |
0.00843 (1.00) |
0.11 (1.00) |
0.475 (1.00) |
0.467 (1.00) |
0.633 (1.00) |
0.615 (1.00) |
0.00125 (0.946) |
0.000313 (0.243) |
0.0442 (1.00) |
0.00857 (1.00) |
| 18p gain | 67 (30%) | 154 |
1.04e-07 (8.29e-05) |
0.000325 (0.252) |
0.935 (1.00) |
0.824 (1.00) |
0.000381 (0.294) |
0.181 (1.00) |
0.537 (1.00) |
0.231 (1.00) |
0.24 (1.00) |
0.0769 (1.00) |
| 19q gain | 75 (34%) | 146 |
3.13e-05 (0.0247) |
0.00364 (1.00) |
0.357 (1.00) |
0.773 (1.00) |
0.67 (1.00) |
0.0646 (1.00) |
0.26 (1.00) |
0.125 (1.00) |
0.497 (1.00) |
0.232 (1.00) |
| 2q loss | 50 (23%) | 171 |
0.000228 (0.178) |
0.178 (1.00) |
0.602 (1.00) |
0.308 (1.00) |
0.21 (1.00) |
0.0485 (1.00) |
0.853 (1.00) |
0.884 (1.00) |
0.221 (1.00) |
0.29 (1.00) |
| 6q loss | 79 (36%) | 142 |
4.84e-06 (0.00385) |
0.000744 (0.567) |
0.837 (1.00) |
0.559 (1.00) |
0.578 (1.00) |
0.178 (1.00) |
0.808 (1.00) |
0.0237 (1.00) |
0.0609 (1.00) |
0.0569 (1.00) |
| 8p loss | 99 (45%) | 122 |
6.07e-05 (0.0477) |
0.103 (1.00) |
0.109 (1.00) |
0.0548 (1.00) |
0.0264 (1.00) |
0.0485 (1.00) |
0.0484 (1.00) |
0.0493 (1.00) |
0.02 (1.00) |
0.0686 (1.00) |
| 9q loss | 87 (39%) | 134 |
0.00547 (1.00) |
0.00755 (1.00) |
0.0319 (1.00) |
0.00701 (1.00) |
0.00847 (1.00) |
1.78e-05 (0.0141) |
0.666 (1.00) |
0.331 (1.00) |
0.00924 (1.00) |
0.00883 (1.00) |
| 11q loss | 69 (31%) | 152 |
2.59e-06 (0.00207) |
0.00066 (0.503) |
0.0631 (1.00) |
0.136 (1.00) |
0.0633 (1.00) |
0.0244 (1.00) |
0.645 (1.00) |
0.663 (1.00) |
0.387 (1.00) |
0.667 (1.00) |
| 16p loss | 57 (26%) | 164 |
1.86e-05 (0.0147) |
0.0174 (1.00) |
0.564 (1.00) |
0.471 (1.00) |
0.195 (1.00) |
0.399 (1.00) |
1 (1.00) |
0.307 (1.00) |
0.419 (1.00) |
0.165 (1.00) |
| 16q loss | 52 (24%) | 169 |
0.000184 (0.143) |
0.0228 (1.00) |
0.176 (1.00) |
0.775 (1.00) |
0.417 (1.00) |
0.406 (1.00) |
0.749 (1.00) |
0.157 (1.00) |
0.984 (1.00) |
0.263 (1.00) |
| 22q loss | 84 (38%) | 137 |
3.28e-07 (0.000262) |
0.00503 (1.00) |
0.548 (1.00) |
0.0155 (1.00) |
0.00291 (1.00) |
0.0171 (1.00) |
0.646 (1.00) |
0.034 (1.00) |
0.00938 (1.00) |
0.0195 (1.00) |
| 1p gain | 51 (23%) | 170 |
0.0279 (1.00) |
0.0326 (1.00) |
0.387 (1.00) |
0.449 (1.00) |
0.506 (1.00) |
0.868 (1.00) |
0.599 (1.00) |
0.235 (1.00) |
0.881 (1.00) |
0.885 (1.00) |
| 1q gain | 70 (32%) | 151 |
0.226 (1.00) |
0.238 (1.00) |
0.498 (1.00) |
0.759 (1.00) |
0.296 (1.00) |
0.969 (1.00) |
0.709 (1.00) |
0.572 (1.00) |
0.908 (1.00) |
0.835 (1.00) |
| 2q gain | 31 (14%) | 190 |
0.125 (1.00) |
0.0725 (1.00) |
0.529 (1.00) |
0.702 (1.00) |
0.122 (1.00) |
0.873 (1.00) |
0.308 (1.00) |
0.338 (1.00) |
0.329 (1.00) |
0.206 (1.00) |
| 3p gain | 75 (34%) | 146 |
0.000809 (0.616) |
0.18 (1.00) |
0.0639 (1.00) |
0.309 (1.00) |
0.00507 (1.00) |
0.0667 (1.00) |
0.000818 (0.622) |
0.000452 (0.347) |
0.000825 (0.626) |
0.00245 (1.00) |
| 3q gain | 98 (44%) | 123 |
0.00188 (1.00) |
0.851 (1.00) |
0.431 (1.00) |
0.926 (1.00) |
0.229 (1.00) |
0.217 (1.00) |
0.00331 (1.00) |
0.00623 (1.00) |
0.00035 (0.271) |
0.00233 (1.00) |
| 4p gain | 23 (10%) | 198 |
0.00393 (1.00) |
0.0761 (1.00) |
0.478 (1.00) |
0.655 (1.00) |
0.316 (1.00) |
0.17 (1.00) |
0.0476 (1.00) |
1 (1.00) |
0.0781 (1.00) |
0.122 (1.00) |
| 4q gain | 14 (6%) | 207 |
0.00141 (1.00) |
0.186 (1.00) |
0.569 (1.00) |
0.161 (1.00) |
0.759 (1.00) |
0.549 (1.00) |
0.0175 (1.00) |
0.436 (1.00) |
0.0674 (1.00) |
0.825 (1.00) |
| 5p gain | 91 (41%) | 130 |
0.00178 (1.00) |
0.179 (1.00) |
0.0422 (1.00) |
0.237 (1.00) |
0.08 (1.00) |
0.0125 (1.00) |
0.0548 (1.00) |
0.1 (1.00) |
0.136 (1.00) |
0.109 (1.00) |
| 5q gain | 31 (14%) | 190 |
0.007 (1.00) |
0.367 (1.00) |
0.0172 (1.00) |
0.659 (1.00) |
0.96 (1.00) |
0.388 (1.00) |
0.113 (1.00) |
0.056 (1.00) |
0.334 (1.00) |
0.551 (1.00) |
| 6p gain | 33 (15%) | 188 |
0.384 (1.00) |
0.688 (1.00) |
0.786 (1.00) |
0.177 (1.00) |
0.37 (1.00) |
0.258 (1.00) |
0.384 (1.00) |
0.331 (1.00) |
0.646 (1.00) |
0.378 (1.00) |
| 6q gain | 20 (9%) | 201 |
0.544 (1.00) |
0.636 (1.00) |
0.934 (1.00) |
0.101 (1.00) |
0.0771 (1.00) |
0.273 (1.00) |
0.175 (1.00) |
0.13 (1.00) |
0.333 (1.00) |
0.149 (1.00) |
| 7q gain | 82 (37%) | 139 |
0.000494 (0.379) |
0.00702 (1.00) |
0.183 (1.00) |
0.917 (1.00) |
0.814 (1.00) |
0.372 (1.00) |
0.452 (1.00) |
0.187 (1.00) |
0.35 (1.00) |
0.343 (1.00) |
| 8p gain | 44 (20%) | 177 |
0.0112 (1.00) |
0.119 (1.00) |
0.099 (1.00) |
0.025 (1.00) |
0.0871 (1.00) |
0.451 (1.00) |
0.576 (1.00) |
0.358 (1.00) |
0.0997 (1.00) |
0.00633 (1.00) |
| 8q gain | 101 (46%) | 120 |
0.218 (1.00) |
0.0679 (1.00) |
0.0453 (1.00) |
0.162 (1.00) |
0.619 (1.00) |
0.609 (1.00) |
0.954 (1.00) |
0.864 (1.00) |
0.586 (1.00) |
0.444 (1.00) |
| 9q gain | 29 (13%) | 192 |
0.29 (1.00) |
0.0652 (1.00) |
0.776 (1.00) |
0.0315 (1.00) |
0.0216 (1.00) |
0.0126 (1.00) |
0.743 (1.00) |
0.863 (1.00) |
0.016 (1.00) |
0.0693 (1.00) |
| 10q gain | 18 (8%) | 203 |
0.324 (1.00) |
0.502 (1.00) |
0.335 (1.00) |
0.364 (1.00) |
0.617 (1.00) |
0.0475 (1.00) |
0.384 (1.00) |
0.371 (1.00) |
0.487 (1.00) |
0.226 (1.00) |
| 11p gain | 21 (10%) | 200 |
0.0464 (1.00) |
0.18 (1.00) |
0.105 (1.00) |
0.0836 (1.00) |
0.0125 (1.00) |
0.0421 (1.00) |
0.164 (1.00) |
0.376 (1.00) |
0.0527 (1.00) |
0.153 (1.00) |
| 11q gain | 29 (13%) | 192 |
0.000633 (0.484) |
0.297 (1.00) |
0.158 (1.00) |
0.0176 (1.00) |
0.0444 (1.00) |
0.0271 (1.00) |
0.481 (1.00) |
0.882 (1.00) |
0.0696 (1.00) |
0.503 (1.00) |
| 12q gain | 49 (22%) | 172 |
0.00233 (1.00) |
0.121 (1.00) |
0.0991 (1.00) |
0.0241 (1.00) |
0.182 (1.00) |
0.273 (1.00) |
0.231 (1.00) |
0.158 (1.00) |
0.368 (1.00) |
0.201 (1.00) |
| 13q gain | 57 (26%) | 164 |
0.154 (1.00) |
0.78 (1.00) |
0.94 (1.00) |
0.93 (1.00) |
0.191 (1.00) |
0.69 (1.00) |
0.742 (1.00) |
0.514 (1.00) |
0.728 (1.00) |
0.139 (1.00) |
| 14q gain | 37 (17%) | 184 |
0.0097 (1.00) |
0.126 (1.00) |
0.364 (1.00) |
0.525 (1.00) |
0.0148 (1.00) |
0.1 (1.00) |
0.908 (1.00) |
0.775 (1.00) |
0.185 (1.00) |
0.406 (1.00) |
| 15q gain | 22 (10%) | 199 |
0.168 (1.00) |
0.0901 (1.00) |
0.576 (1.00) |
0.396 (1.00) |
0.297 (1.00) |
0.156 (1.00) |
0.172 (1.00) |
0.802 (1.00) |
0.829 (1.00) |
0.908 (1.00) |
| 16p gain | 39 (18%) | 182 |
0.0761 (1.00) |
0.963 (1.00) |
0.238 (1.00) |
0.304 (1.00) |
0.63 (1.00) |
0.0708 (1.00) |
0.841 (1.00) |
0.575 (1.00) |
0.773 (1.00) |
0.861 (1.00) |
| 16q gain | 48 (22%) | 173 |
0.1 (1.00) |
0.815 (1.00) |
0.0986 (1.00) |
0.438 (1.00) |
0.642 (1.00) |
0.163 (1.00) |
0.61 (1.00) |
0.489 (1.00) |
0.687 (1.00) |
0.924 (1.00) |
| 17q gain | 77 (35%) | 144 |
0.0704 (1.00) |
0.00753 (1.00) |
0.364 (1.00) |
0.626 (1.00) |
0.254 (1.00) |
0.181 (1.00) |
0.0204 (1.00) |
0.0109 (1.00) |
0.0272 (1.00) |
0.0212 (1.00) |
| 18q gain | 32 (14%) | 189 |
0.0206 (1.00) |
0.0731 (1.00) |
0.199 (1.00) |
0.171 (1.00) |
0.00698 (1.00) |
0.58 (1.00) |
0.0672 (1.00) |
0.265 (1.00) |
0.341 (1.00) |
0.623 (1.00) |
| 19p gain | 44 (20%) | 177 |
0.0678 (1.00) |
0.0526 (1.00) |
0.44 (1.00) |
0.775 (1.00) |
0.0774 (1.00) |
0.00779 (1.00) |
0.295 (1.00) |
0.267 (1.00) |
0.238 (1.00) |
0.11 (1.00) |
| 20p gain | 114 (52%) | 107 |
0.0105 (1.00) |
0.0298 (1.00) |
0.863 (1.00) |
0.0188 (1.00) |
0.596 (1.00) |
0.0299 (1.00) |
0.141 (1.00) |
0.0349 (1.00) |
0.0265 (1.00) |
0.0802 (1.00) |
| 20q gain | 127 (57%) | 94 |
0.00193 (1.00) |
0.0197 (1.00) |
0.737 (1.00) |
0.12 (1.00) |
0.837 (1.00) |
0.253 (1.00) |
0.253 (1.00) |
0.0531 (1.00) |
0.042 (1.00) |
0.169 (1.00) |
| 22q gain | 32 (14%) | 189 |
0.000496 (0.379) |
0.0151 (1.00) |
0.475 (1.00) |
0.62 (1.00) |
0.148 (1.00) |
0.123 (1.00) |
0.0434 (1.00) |
0.65 (1.00) |
0.252 (1.00) |
0.412 (1.00) |
| xq gain | 23 (10%) | 198 |
0.709 (1.00) |
0.128 (1.00) |
0.401 (1.00) |
0.848 (1.00) |
0.0584 (1.00) |
0.836 (1.00) |
0.741 (1.00) |
0.342 (1.00) |
0.637 (1.00) |
0.796 (1.00) |
| 1p loss | 18 (8%) | 203 |
0.0178 (1.00) |
0.103 (1.00) |
0.333 (1.00) |
0.143 (1.00) |
0.415 (1.00) |
0.0747 (1.00) |
0.706 (1.00) |
0.173 (1.00) |
0.751 (1.00) |
0.617 (1.00) |
| 1q loss | 20 (9%) | 201 |
0.0823 (1.00) |
0.188 (1.00) |
0.342 (1.00) |
0.96 (1.00) |
0.444 (1.00) |
0.041 (1.00) |
1 (1.00) |
0.0812 (1.00) |
0.382 (1.00) |
0.271 (1.00) |
| 2p loss | 23 (10%) | 198 |
0.165 (1.00) |
0.419 (1.00) |
0.841 (1.00) |
0.759 (1.00) |
0.475 (1.00) |
0.14 (1.00) |
0.366 (1.00) |
0.809 (1.00) |
0.354 (1.00) |
0.841 (1.00) |
| 3q loss | 11 (5%) | 210 |
0.632 (1.00) |
0.275 (1.00) |
0.00159 (1.00) |
0.0123 (1.00) |
0.0142 (1.00) |
0.0777 (1.00) |
0.589 (1.00) |
0.463 (1.00) |
0.0275 (1.00) |
0.0227 (1.00) |
| 4p loss | 77 (35%) | 144 |
0.00112 (0.849) |
0.568 (1.00) |
0.627 (1.00) |
0.443 (1.00) |
0.0629 (1.00) |
0.00869 (1.00) |
0.0688 (1.00) |
0.426 (1.00) |
0.0409 (1.00) |
0.785 (1.00) |
| 4q loss | 80 (36%) | 141 |
0.000402 (0.309) |
0.249 (1.00) |
0.239 (1.00) |
0.158 (1.00) |
0.0712 (1.00) |
0.0356 (1.00) |
0.0394 (1.00) |
0.333 (1.00) |
0.00734 (1.00) |
0.351 (1.00) |
| 5p loss | 34 (15%) | 187 |
0.748 (1.00) |
0.836 (1.00) |
0.391 (1.00) |
0.602 (1.00) |
0.324 (1.00) |
0.069 (1.00) |
0.628 (1.00) |
0.756 (1.00) |
0.413 (1.00) |
0.905 (1.00) |
| 5q loss | 84 (38%) | 137 |
0.0944 (1.00) |
0.149 (1.00) |
0.8 (1.00) |
0.266 (1.00) |
0.0156 (1.00) |
0.000361 (0.279) |
0.749 (1.00) |
0.0251 (1.00) |
0.217 (1.00) |
0.159 (1.00) |
| 6p loss | 54 (24%) | 167 |
0.0388 (1.00) |
0.00329 (1.00) |
0.815 (1.00) |
0.741 (1.00) |
0.945 (1.00) |
0.181 (1.00) |
0.395 (1.00) |
0.123 (1.00) |
0.381 (1.00) |
0.153 (1.00) |
| 7p loss | 8 (4%) | 213 |
0.667 (1.00) |
1 (1.00) |
0.385 (1.00) |
0.924 (1.00) |
0.461 (1.00) |
0.575 (1.00) |
0.373 (1.00) |
0.117 (1.00) |
0.287 (1.00) |
0.61 (1.00) |
| 7q loss | 13 (6%) | 208 |
0.507 (1.00) |
1 (1.00) |
0.312 (1.00) |
0.833 (1.00) |
0.261 (1.00) |
0.607 (1.00) |
0.365 (1.00) |
0.00218 (1.00) |
0.605 (1.00) |
0.0744 (1.00) |
| 8q loss | 21 (10%) | 200 |
0.0642 (1.00) |
0.624 (1.00) |
0.333 (1.00) |
0.0167 (1.00) |
0.127 (1.00) |
0.0556 (1.00) |
0.0517 (1.00) |
0.0109 (1.00) |
0.0136 (1.00) |
0.0412 (1.00) |
| 9p loss | 93 (42%) | 128 |
0.000344 (0.266) |
0.0776 (1.00) |
0.3 (1.00) |
0.0697 (1.00) |
0.0581 (1.00) |
0.0201 (1.00) |
0.613 (1.00) |
0.256 (1.00) |
0.231 (1.00) |
0.2 (1.00) |
| 10p loss | 41 (19%) | 180 |
0.00931 (1.00) |
0.0881 (1.00) |
0.699 (1.00) |
0.585 (1.00) |
0.182 (1.00) |
0.141 (1.00) |
0.692 (1.00) |
0.267 (1.00) |
0.0609 (1.00) |
0.0628 (1.00) |
| 10q loss | 75 (34%) | 146 |
0.00118 (0.892) |
0.00233 (1.00) |
0.468 (1.00) |
0.904 (1.00) |
0.141 (1.00) |
0.145 (1.00) |
0.124 (1.00) |
0.265 (1.00) |
0.193 (1.00) |
0.205 (1.00) |
| 12p loss | 21 (10%) | 200 |
0.488 (1.00) |
0.451 (1.00) |
0.87 (1.00) |
0.41 (1.00) |
0.724 (1.00) |
0.784 (1.00) |
0.336 (1.00) |
0.232 (1.00) |
0.918 (1.00) |
0.845 (1.00) |
| 12q loss | 28 (13%) | 193 |
0.103 (1.00) |
0.815 (1.00) |
0.333 (1.00) |
0.542 (1.00) |
0.608 (1.00) |
0.172 (1.00) |
0.78 (1.00) |
0.521 (1.00) |
0.617 (1.00) |
0.232 (1.00) |
| 13q loss | 47 (21%) | 174 |
0.0168 (1.00) |
0.151 (1.00) |
0.00573 (1.00) |
0.0292 (1.00) |
0.00398 (1.00) |
0.303 (1.00) |
0.647 (1.00) |
0.486 (1.00) |
0.0873 (1.00) |
0.00204 (1.00) |
| 14q loss | 62 (28%) | 159 |
0.00457 (1.00) |
0.159 (1.00) |
0.118 (1.00) |
0.048 (1.00) |
0.15 (1.00) |
0.0404 (1.00) |
0.0109 (1.00) |
0.0386 (1.00) |
0.0407 (1.00) |
0.206 (1.00) |
| 15q loss | 74 (33%) | 147 |
0.000383 (0.295) |
0.00133 (0.998) |
0.0999 (1.00) |
0.289 (1.00) |
0.00908 (1.00) |
0.0435 (1.00) |
0.17 (1.00) |
0.131 (1.00) |
0.146 (1.00) |
0.259 (1.00) |
| 17p loss | 97 (44%) | 124 |
0.00459 (1.00) |
0.542 (1.00) |
0.805 (1.00) |
0.554 (1.00) |
0.106 (1.00) |
0.569 (1.00) |
0.437 (1.00) |
0.693 (1.00) |
0.418 (1.00) |
0.299 (1.00) |
| 17q loss | 26 (12%) | 195 |
0.42 (1.00) |
0.391 (1.00) |
0.896 (1.00) |
0.783 (1.00) |
0.11 (1.00) |
0.77 (1.00) |
0.863 (1.00) |
0.882 (1.00) |
0.568 (1.00) |
0.582 (1.00) |
| 18p loss | 50 (23%) | 171 |
0.199 (1.00) |
0.781 (1.00) |
0.478 (1.00) |
0.257 (1.00) |
0.483 (1.00) |
0.133 (1.00) |
0.43 (1.00) |
0.053 (1.00) |
0.319 (1.00) |
0.647 (1.00) |
| 18q loss | 78 (35%) | 143 |
0.023 (1.00) |
0.455 (1.00) |
0.561 (1.00) |
0.955 (1.00) |
0.462 (1.00) |
0.957 (1.00) |
0.0232 (1.00) |
0.0013 (0.976) |
0.252 (1.00) |
0.435 (1.00) |
| 19p loss | 57 (26%) | 164 |
0.00502 (1.00) |
0.481 (1.00) |
0.767 (1.00) |
0.37 (1.00) |
0.00251 (1.00) |
0.0375 (1.00) |
0.674 (1.00) |
0.125 (1.00) |
0.488 (1.00) |
0.593 (1.00) |
| 19q loss | 33 (15%) | 188 |
0.0877 (1.00) |
1 (1.00) |
0.208 (1.00) |
0.101 (1.00) |
0.284 (1.00) |
0.478 (1.00) |
0.209 (1.00) |
0.894 (1.00) |
0.207 (1.00) |
0.166 (1.00) |
| 20p loss | 14 (6%) | 207 |
0.0969 (1.00) |
0.547 (1.00) |
0.282 (1.00) |
0.0238 (1.00) |
0.734 (1.00) |
0.252 (1.00) |
0.392 (1.00) |
0.524 (1.00) |
0.325 (1.00) |
0.944 (1.00) |
| 20q loss | 6 (3%) | 215 |
0.0444 (1.00) |
0.513 (1.00) |
0.331 (1.00) |
0.287 (1.00) |
0.618 (1.00) |
0.868 (1.00) |
1 (1.00) |
0.593 (1.00) |
1 (1.00) |
0.804 (1.00) |
| 21q loss | 35 (16%) | 186 |
0.694 (1.00) |
0.324 (1.00) |
0.114 (1.00) |
0.189 (1.00) |
0.0468 (1.00) |
0.176 (1.00) |
0.583 (1.00) |
0.753 (1.00) |
0.0772 (1.00) |
0.326 (1.00) |
| xq loss | 48 (22%) | 173 |
0.000495 (0.379) |
0.115 (1.00) |
0.981 (1.00) |
1 (1.00) |
0.466 (1.00) |
0.59 (1.00) |
0.082 (1.00) |
0.789 (1.00) |
0.494 (1.00) |
0.482 (1.00) |
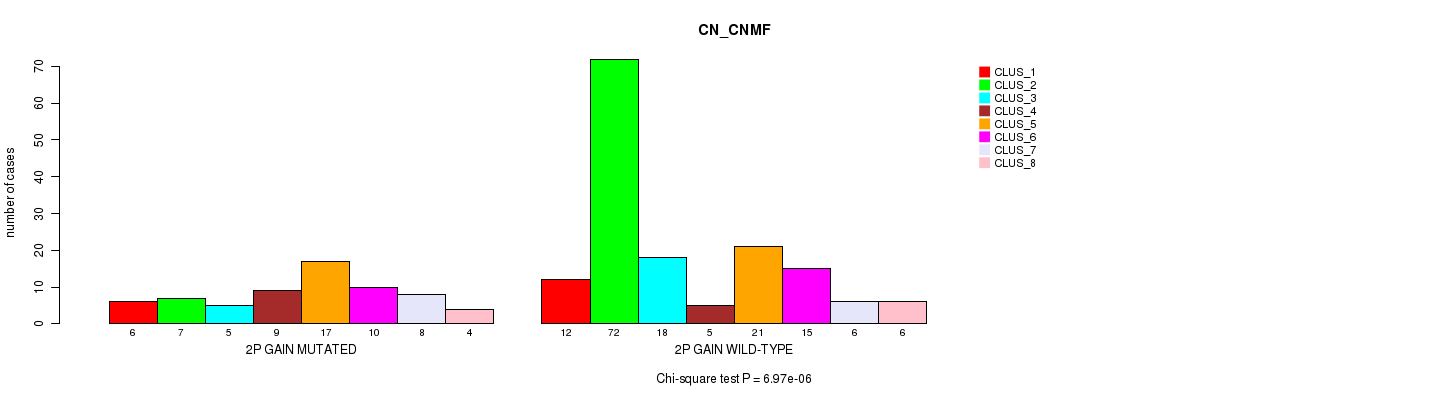
P value = 6.97e-06 (Chi-square test), Q value = 0.0055
Table S1. Gene #3: '2p gain' versus Molecular Subtype #1: 'CN_CNMF'
| nPatients | CLUS_1 | CLUS_2 | CLUS_3 | CLUS_4 | CLUS_5 | CLUS_6 | CLUS_7 | CLUS_8 |
|---|---|---|---|---|---|---|---|---|
| ALL | 18 | 79 | 23 | 14 | 38 | 25 | 14 | 10 |
| 2P GAIN MUTATED | 6 | 7 | 5 | 9 | 17 | 10 | 8 | 4 |
| 2P GAIN WILD-TYPE | 12 | 72 | 18 | 5 | 21 | 15 | 6 | 6 |
Figure S1. Get High-res Image Gene #3: '2p gain' versus Molecular Subtype #1: 'CN_CNMF'
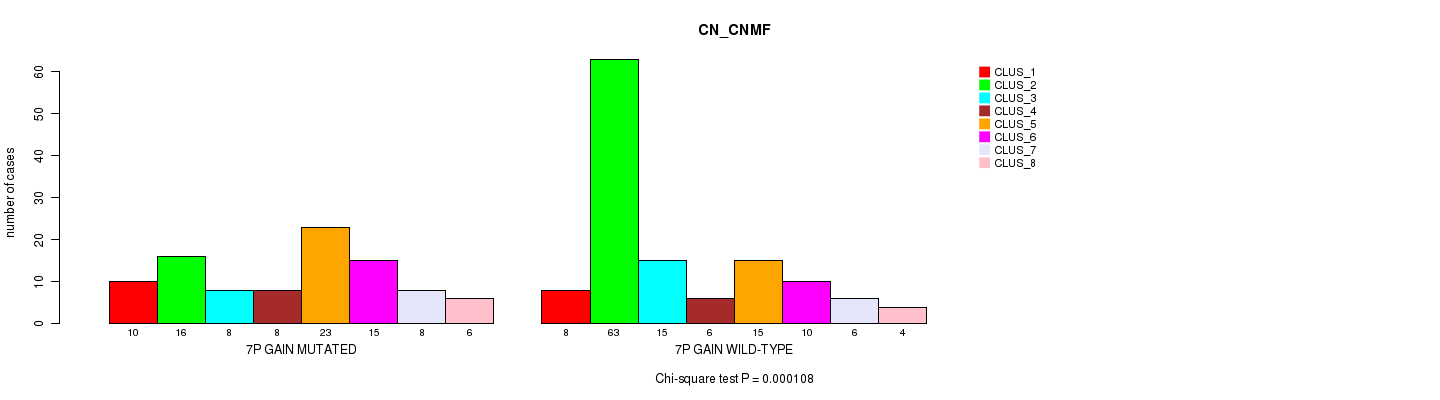
P value = 0.000108 (Chi-square test), Q value = 0.084
Table S2. Gene #13: '7p gain' versus Molecular Subtype #1: 'CN_CNMF'
| nPatients | CLUS_1 | CLUS_2 | CLUS_3 | CLUS_4 | CLUS_5 | CLUS_6 | CLUS_7 | CLUS_8 |
|---|---|---|---|---|---|---|---|---|
| ALL | 18 | 79 | 23 | 14 | 38 | 25 | 14 | 10 |
| 7P GAIN MUTATED | 10 | 16 | 8 | 8 | 23 | 15 | 8 | 6 |
| 7P GAIN WILD-TYPE | 8 | 63 | 15 | 6 | 15 | 10 | 6 | 4 |
Figure S2. Get High-res Image Gene #13: '7p gain' versus Molecular Subtype #1: 'CN_CNMF'
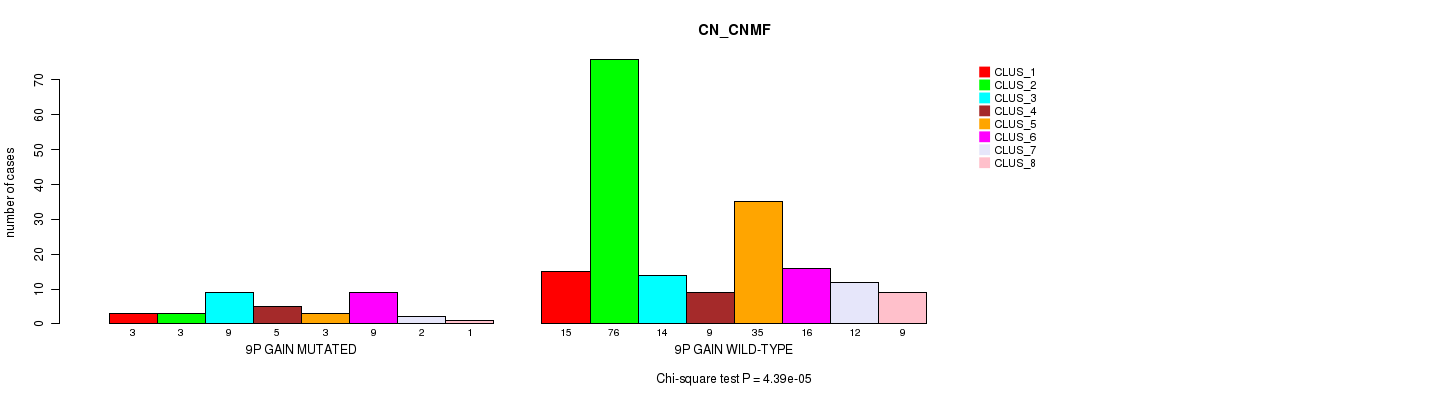
P value = 4.39e-05 (Chi-square test), Q value = 0.035
Table S3. Gene #17: '9p gain' versus Molecular Subtype #1: 'CN_CNMF'
| nPatients | CLUS_1 | CLUS_2 | CLUS_3 | CLUS_4 | CLUS_5 | CLUS_6 | CLUS_7 | CLUS_8 |
|---|---|---|---|---|---|---|---|---|
| ALL | 18 | 79 | 23 | 14 | 38 | 25 | 14 | 10 |
| 9P GAIN MUTATED | 3 | 3 | 9 | 5 | 3 | 9 | 2 | 1 |
| 9P GAIN WILD-TYPE | 15 | 76 | 14 | 9 | 35 | 16 | 12 | 9 |
Figure S3. Get High-res Image Gene #17: '9p gain' versus Molecular Subtype #1: 'CN_CNMF'
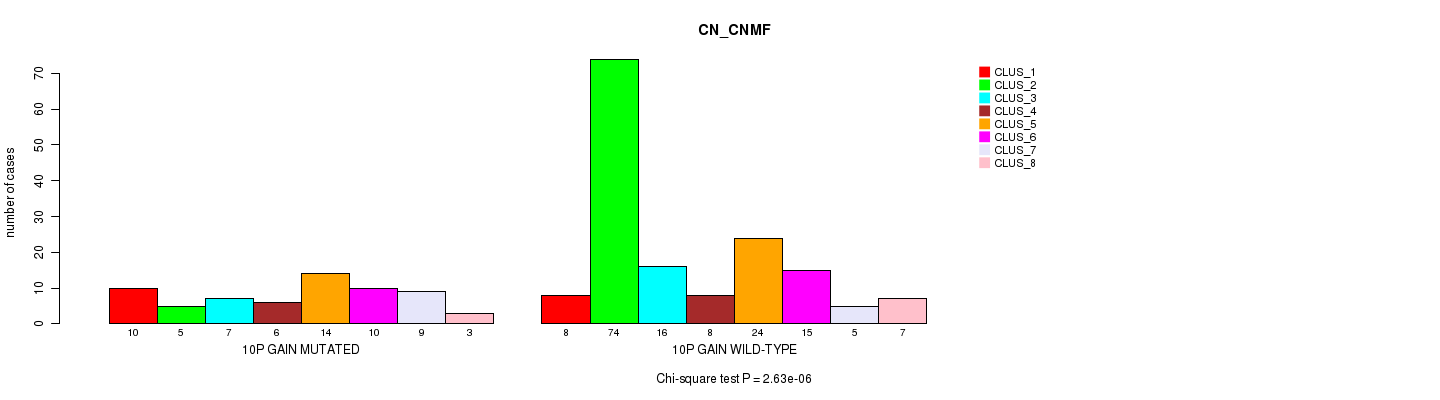
P value = 2.63e-06 (Chi-square test), Q value = 0.0021
Table S4. Gene #19: '10p gain' versus Molecular Subtype #1: 'CN_CNMF'
| nPatients | CLUS_1 | CLUS_2 | CLUS_3 | CLUS_4 | CLUS_5 | CLUS_6 | CLUS_7 | CLUS_8 |
|---|---|---|---|---|---|---|---|---|
| ALL | 18 | 79 | 23 | 14 | 38 | 25 | 14 | 10 |
| 10P GAIN MUTATED | 10 | 5 | 7 | 6 | 14 | 10 | 9 | 3 |
| 10P GAIN WILD-TYPE | 8 | 74 | 16 | 8 | 24 | 15 | 5 | 7 |
Figure S4. Get High-res Image Gene #19: '10p gain' versus Molecular Subtype #1: 'CN_CNMF'
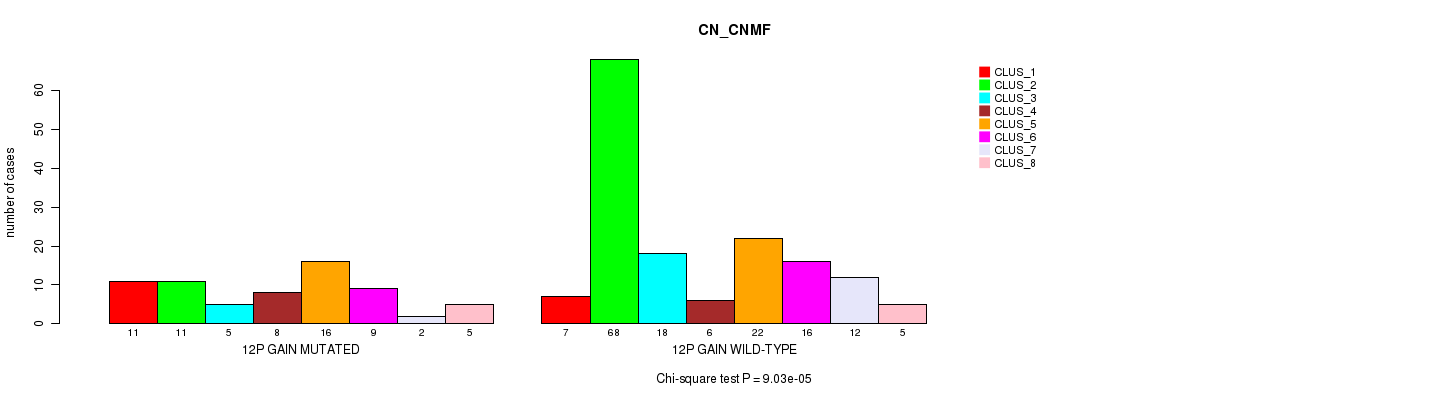
P value = 9.03e-05 (Chi-square test), Q value = 0.071
Table S5. Gene #23: '12p gain' versus Molecular Subtype #1: 'CN_CNMF'
| nPatients | CLUS_1 | CLUS_2 | CLUS_3 | CLUS_4 | CLUS_5 | CLUS_6 | CLUS_7 | CLUS_8 |
|---|---|---|---|---|---|---|---|---|
| ALL | 18 | 79 | 23 | 14 | 38 | 25 | 14 | 10 |
| 12P GAIN MUTATED | 11 | 11 | 5 | 8 | 16 | 9 | 2 | 5 |
| 12P GAIN WILD-TYPE | 7 | 68 | 18 | 6 | 22 | 16 | 12 | 5 |
Figure S5. Get High-res Image Gene #23: '12p gain' versus Molecular Subtype #1: 'CN_CNMF'
P value = 0.000313 (Fisher's exact test), Q value = 0.24
Table S6. Gene #30: '17p gain' versus Molecular Subtype #8: 'MIRSEQ_CHIERARCHICAL'
| nPatients | CLUS_1 | CLUS_2 | CLUS_3 |
|---|---|---|---|
| ALL | 145 | 16 | 48 |
| 17P GAIN MUTATED | 13 | 1 | 16 |
| 17P GAIN WILD-TYPE | 132 | 15 | 32 |
Figure S6. Get High-res Image Gene #30: '17p gain' versus Molecular Subtype #8: 'MIRSEQ_CHIERARCHICAL'

P value = 1.04e-07 (Chi-square test), Q value = 8.3e-05
Table S7. Gene #32: '18p gain' versus Molecular Subtype #1: 'CN_CNMF'
| nPatients | CLUS_1 | CLUS_2 | CLUS_3 | CLUS_4 | CLUS_5 | CLUS_6 | CLUS_7 | CLUS_8 |
|---|---|---|---|---|---|---|---|---|
| ALL | 18 | 79 | 23 | 14 | 38 | 25 | 14 | 10 |
| 18P GAIN MUTATED | 5 | 4 | 14 | 6 | 17 | 12 | 7 | 2 |
| 18P GAIN WILD-TYPE | 13 | 75 | 9 | 8 | 21 | 13 | 7 | 8 |
Figure S7. Get High-res Image Gene #32: '18p gain' versus Molecular Subtype #1: 'CN_CNMF'
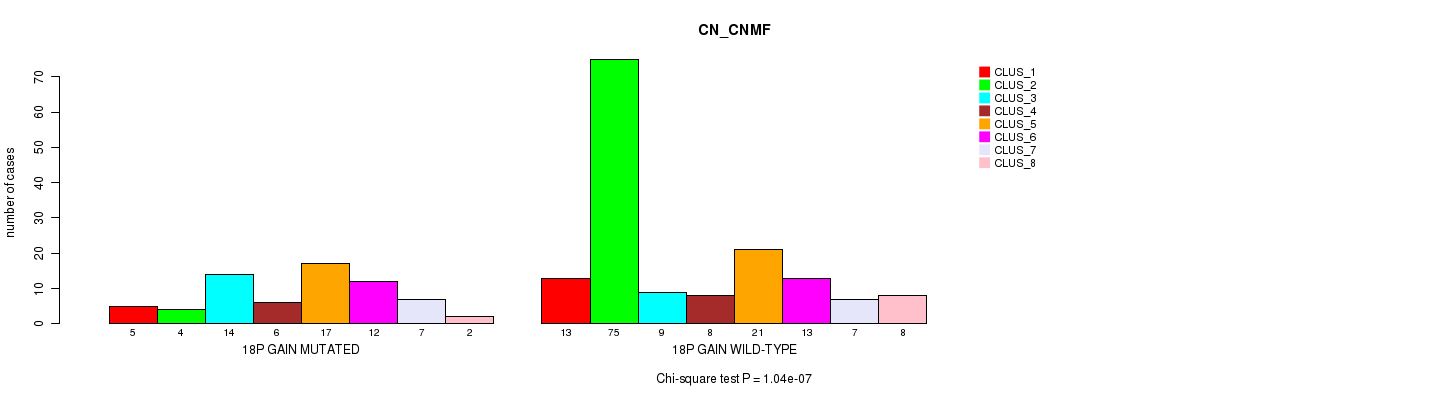
P value = 3.13e-05 (Chi-square test), Q value = 0.025
Table S8. Gene #35: '19q gain' versus Molecular Subtype #1: 'CN_CNMF'
| nPatients | CLUS_1 | CLUS_2 | CLUS_3 | CLUS_4 | CLUS_5 | CLUS_6 | CLUS_7 | CLUS_8 |
|---|---|---|---|---|---|---|---|---|
| ALL | 18 | 79 | 23 | 14 | 38 | 25 | 14 | 10 |
| 19Q GAIN MUTATED | 5 | 13 | 4 | 8 | 22 | 12 | 8 | 3 |
| 19Q GAIN WILD-TYPE | 13 | 66 | 19 | 6 | 16 | 13 | 6 | 7 |
Figure S8. Get High-res Image Gene #35: '19q gain' versus Molecular Subtype #1: 'CN_CNMF'
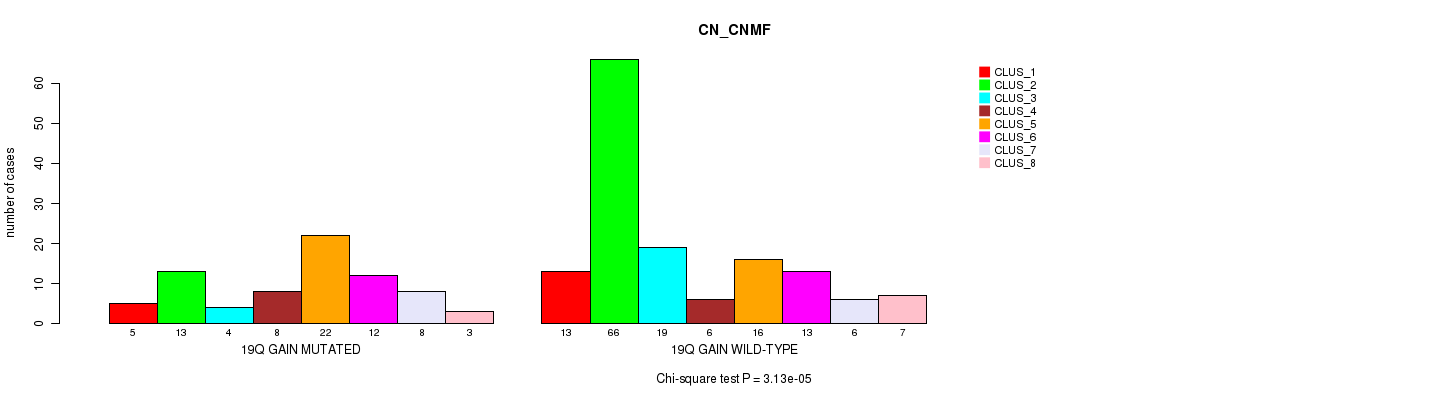
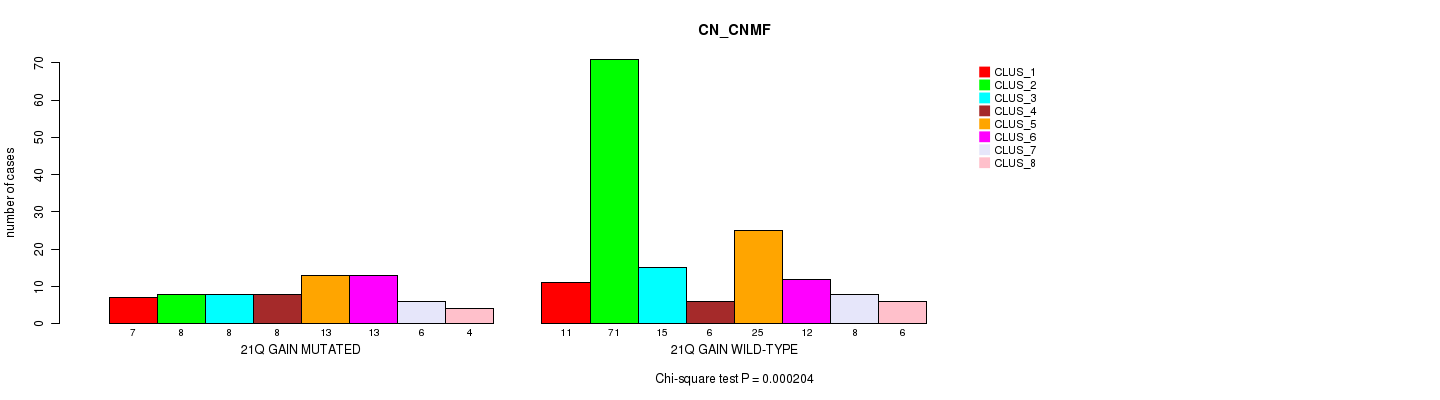
P value = 0.000204 (Chi-square test), Q value = 0.16
Table S9. Gene #38: '21q gain' versus Molecular Subtype #1: 'CN_CNMF'
| nPatients | CLUS_1 | CLUS_2 | CLUS_3 | CLUS_4 | CLUS_5 | CLUS_6 | CLUS_7 | CLUS_8 |
|---|---|---|---|---|---|---|---|---|
| ALL | 18 | 79 | 23 | 14 | 38 | 25 | 14 | 10 |
| 21Q GAIN MUTATED | 7 | 8 | 8 | 8 | 13 | 13 | 6 | 4 |
| 21Q GAIN WILD-TYPE | 11 | 71 | 15 | 6 | 25 | 12 | 8 | 6 |
Figure S9. Get High-res Image Gene #38: '21q gain' versus Molecular Subtype #1: 'CN_CNMF'
P value = 0.000176 (Fisher's exact test), Q value = 0.14
Table S10. Gene #38: '21q gain' versus Molecular Subtype #7: 'MIRSEQ_CNMF'
| nPatients | CLUS_1 | CLUS_2 | CLUS_3 |
|---|---|---|---|
| ALL | 47 | 97 | 65 |
| 21Q GAIN MUTATED | 26 | 21 | 16 |
| 21Q GAIN WILD-TYPE | 21 | 76 | 49 |
Figure S10. Get High-res Image Gene #38: '21q gain' versus Molecular Subtype #7: 'MIRSEQ_CNMF'
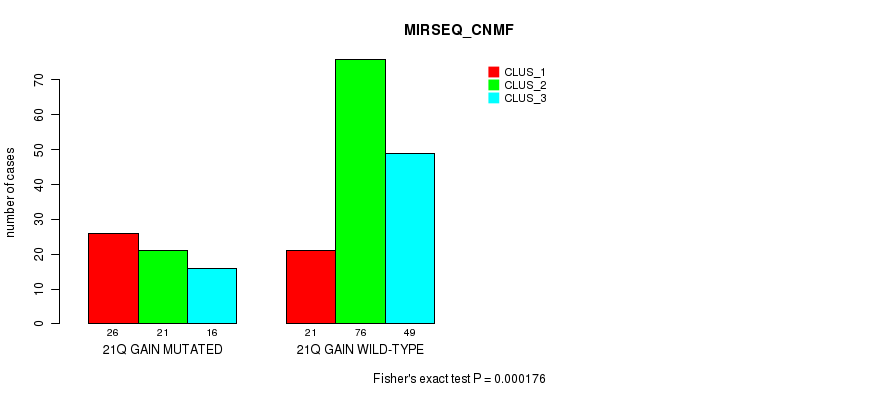
P value = 3.34e-05 (Fisher's exact test), Q value = 0.026
Table S11. Gene #38: '21q gain' versus Molecular Subtype #8: 'MIRSEQ_CHIERARCHICAL'
| nPatients | CLUS_1 | CLUS_2 | CLUS_3 |
|---|---|---|---|
| ALL | 145 | 16 | 48 |
| 21Q GAIN MUTATED | 30 | 7 | 26 |
| 21Q GAIN WILD-TYPE | 115 | 9 | 22 |
Figure S11. Get High-res Image Gene #38: '21q gain' versus Molecular Subtype #8: 'MIRSEQ_CHIERARCHICAL'
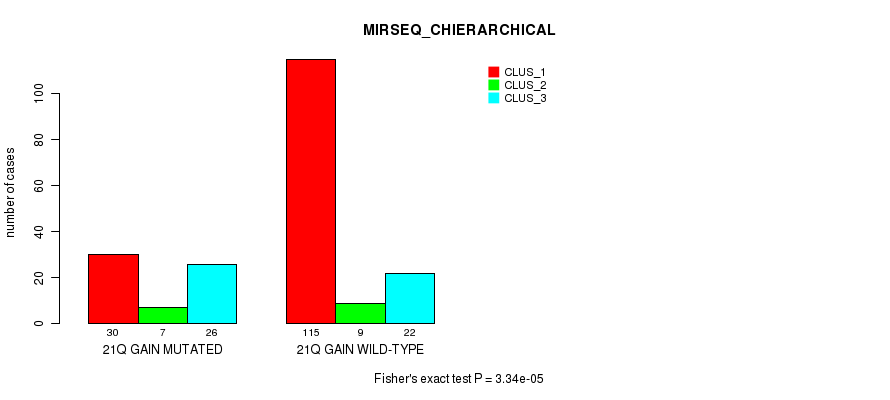
P value = 0.000228 (Chi-square test), Q value = 0.18
Table S12. Gene #44: '2q loss' versus Molecular Subtype #1: 'CN_CNMF'
| nPatients | CLUS_1 | CLUS_2 | CLUS_3 | CLUS_4 | CLUS_5 | CLUS_6 | CLUS_7 | CLUS_8 |
|---|---|---|---|---|---|---|---|---|
| ALL | 18 | 79 | 23 | 14 | 38 | 25 | 14 | 10 |
| 2Q LOSS MUTATED | 4 | 5 | 7 | 2 | 16 | 6 | 7 | 3 |
| 2Q LOSS WILD-TYPE | 14 | 74 | 16 | 12 | 22 | 19 | 7 | 7 |
Figure S12. Get High-res Image Gene #44: '2q loss' versus Molecular Subtype #1: 'CN_CNMF'
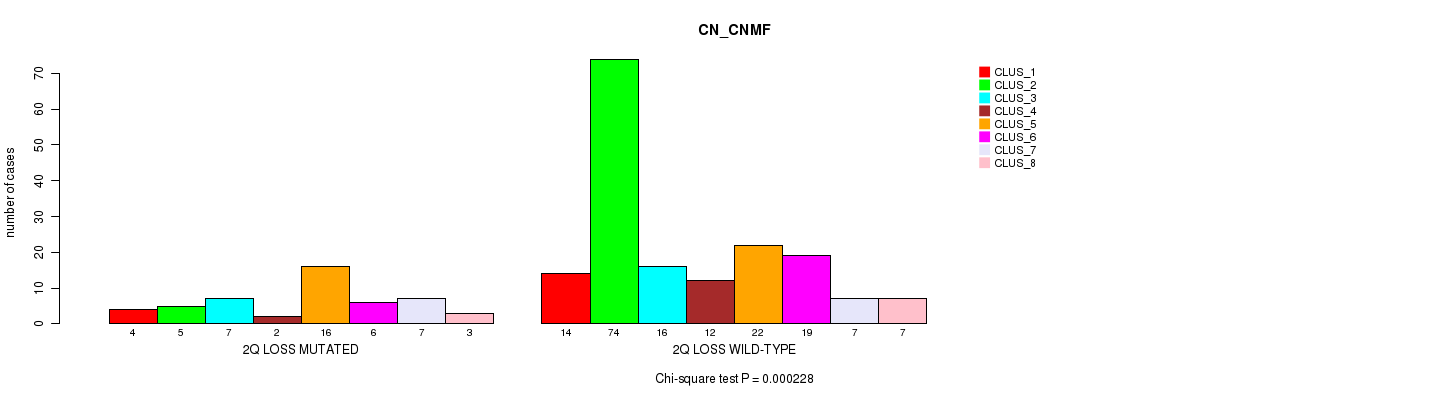
P value = 1.15e-07 (Fisher's exact test), Q value = 9.2e-05
Table S13. Gene #45: '3p loss' versus Molecular Subtype #5: 'MRNASEQ_CNMF'
| nPatients | CLUS_1 | CLUS_2 | CLUS_3 | CLUS_4 |
|---|---|---|---|---|
| ALL | 33 | 63 | 45 | 79 |
| 3P LOSS MUTATED | 3 | 22 | 0 | 4 |
| 3P LOSS WILD-TYPE | 30 | 41 | 45 | 75 |
Figure S13. Get High-res Image Gene #45: '3p loss' versus Molecular Subtype #5: 'MRNASEQ_CNMF'
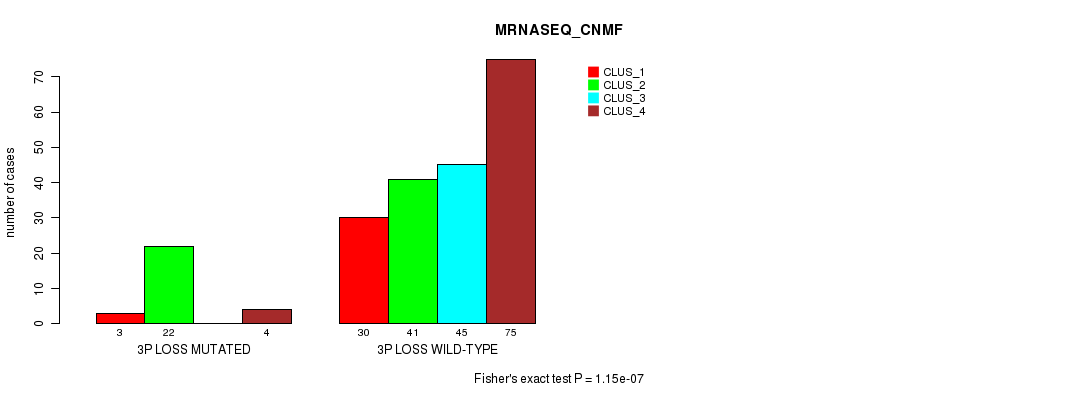
P value = 4.12e-05 (Fisher's exact test), Q value = 0.032
Table S14. Gene #45: '3p loss' versus Molecular Subtype #6: 'MRNASEQ_CHIERARCHICAL'
| nPatients | CLUS_1 | CLUS_2 | CLUS_3 |
|---|---|---|---|
| ALL | 93 | 39 | 88 |
| 3P LOSS MUTATED | 7 | 0 | 22 |
| 3P LOSS WILD-TYPE | 86 | 39 | 66 |
Figure S14. Get High-res Image Gene #45: '3p loss' versus Molecular Subtype #6: 'MRNASEQ_CHIERARCHICAL'
P value = 0.000109 (Fisher's exact test), Q value = 0.085
Table S15. Gene #45: '3p loss' versus Molecular Subtype #9: 'MIRSEQ_MATURE_CNMF'
| nPatients | CLUS_1 | CLUS_2 | CLUS_3 | CLUS_4 |
|---|---|---|---|---|
| ALL | 33 | 60 | 67 | 49 |
| 3P LOSS MUTATED | 2 | 19 | 4 | 3 |
| 3P LOSS WILD-TYPE | 31 | 41 | 63 | 46 |
Figure S15. Get High-res Image Gene #45: '3p loss' versus Molecular Subtype #9: 'MIRSEQ_MATURE_CNMF'
P value = 4.84e-06 (Chi-square test), Q value = 0.0038
Table S16. Gene #52: '6q loss' versus Molecular Subtype #1: 'CN_CNMF'
| nPatients | CLUS_1 | CLUS_2 | CLUS_3 | CLUS_4 | CLUS_5 | CLUS_6 | CLUS_7 | CLUS_8 |
|---|---|---|---|---|---|---|---|---|
| ALL | 18 | 79 | 23 | 14 | 38 | 25 | 14 | 10 |
| 6Q LOSS MUTATED | 10 | 10 | 10 | 7 | 23 | 7 | 6 | 6 |
| 6Q LOSS WILD-TYPE | 8 | 69 | 13 | 7 | 15 | 18 | 8 | 4 |
Figure S16. Get High-res Image Gene #52: '6q loss' versus Molecular Subtype #1: 'CN_CNMF'
P value = 6.07e-05 (Chi-square test), Q value = 0.048
Table S17. Gene #55: '8p loss' versus Molecular Subtype #1: 'CN_CNMF'
| nPatients | CLUS_1 | CLUS_2 | CLUS_3 | CLUS_4 | CLUS_5 | CLUS_6 | CLUS_7 | CLUS_8 |
|---|---|---|---|---|---|---|---|---|
| ALL | 18 | 79 | 23 | 14 | 38 | 25 | 14 | 10 |
| 8P LOSS MUTATED | 9 | 20 | 14 | 8 | 20 | 18 | 9 | 1 |
| 8P LOSS WILD-TYPE | 9 | 59 | 9 | 6 | 18 | 7 | 5 | 9 |
Figure S17. Get High-res Image Gene #55: '8p loss' versus Molecular Subtype #1: 'CN_CNMF'
P value = 1.78e-05 (Fisher's exact test), Q value = 0.014
Table S18. Gene #58: '9q loss' versus Molecular Subtype #6: 'MRNASEQ_CHIERARCHICAL'
| nPatients | CLUS_1 | CLUS_2 | CLUS_3 |
|---|---|---|---|
| ALL | 93 | 39 | 88 |
| 9Q LOSS MUTATED | 42 | 25 | 20 |
| 9Q LOSS WILD-TYPE | 51 | 14 | 68 |
Figure S18. Get High-res Image Gene #58: '9q loss' versus Molecular Subtype #6: 'MRNASEQ_CHIERARCHICAL'

P value = 1.08e-05 (Chi-square test), Q value = 0.0086
Table S19. Gene #61: '11p loss' versus Molecular Subtype #1: 'CN_CNMF'
| nPatients | CLUS_1 | CLUS_2 | CLUS_3 | CLUS_4 | CLUS_5 | CLUS_6 | CLUS_7 | CLUS_8 |
|---|---|---|---|---|---|---|---|---|
| ALL | 18 | 79 | 23 | 14 | 38 | 25 | 14 | 10 |
| 11P LOSS MUTATED | 11 | 16 | 5 | 7 | 26 | 11 | 7 | 6 |
| 11P LOSS WILD-TYPE | 7 | 63 | 18 | 7 | 12 | 14 | 7 | 4 |
Figure S19. Get High-res Image Gene #61: '11p loss' versus Molecular Subtype #1: 'CN_CNMF'
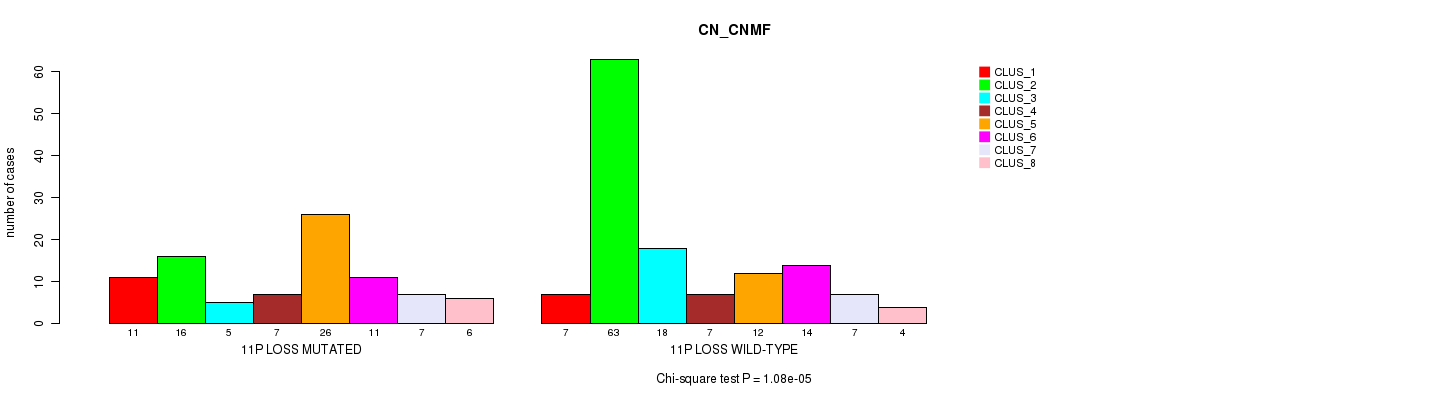
P value = 0.000101 (Fisher's exact test), Q value = 0.079
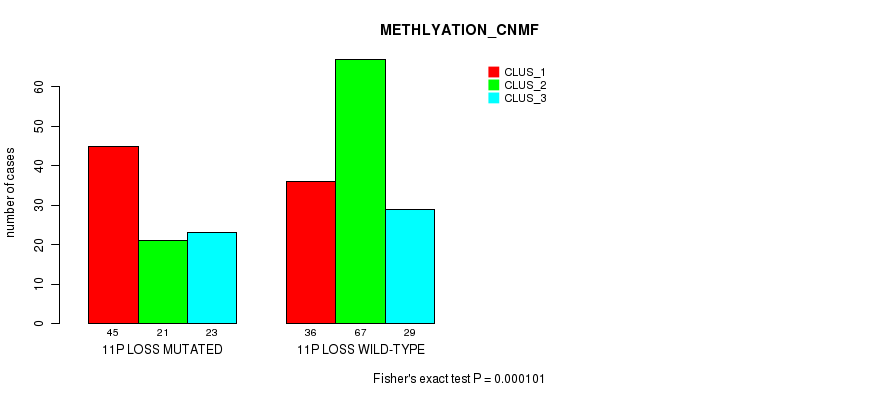
Table S20. Gene #61: '11p loss' versus Molecular Subtype #2: 'METHLYATION_CNMF'
| nPatients | CLUS_1 | CLUS_2 | CLUS_3 |
|---|---|---|---|
| ALL | 81 | 88 | 52 |
| 11P LOSS MUTATED | 45 | 21 | 23 |
| 11P LOSS WILD-TYPE | 36 | 67 | 29 |
Figure S20. Get High-res Image Gene #61: '11p loss' versus Molecular Subtype #2: 'METHLYATION_CNMF'
P value = 2.59e-06 (Chi-square test), Q value = 0.0021
Table S21. Gene #62: '11q loss' versus Molecular Subtype #1: 'CN_CNMF'
| nPatients | CLUS_1 | CLUS_2 | CLUS_3 | CLUS_4 | CLUS_5 | CLUS_6 | CLUS_7 | CLUS_8 |
|---|---|---|---|---|---|---|---|---|
| ALL | 18 | 79 | 23 | 14 | 38 | 25 | 14 | 10 |
| 11Q LOSS MUTATED | 8 | 8 | 4 | 5 | 23 | 11 | 6 | 4 |
| 11Q LOSS WILD-TYPE | 10 | 71 | 19 | 9 | 15 | 14 | 8 | 6 |
Figure S21. Get High-res Image Gene #62: '11q loss' versus Molecular Subtype #1: 'CN_CNMF'
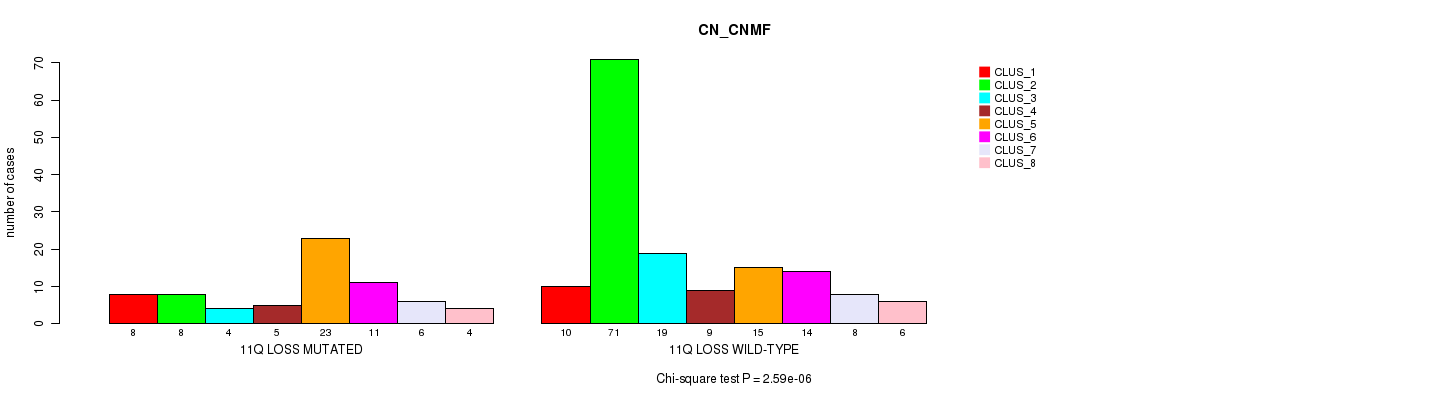
P value = 1.86e-05 (Chi-square test), Q value = 0.015
Table S22. Gene #68: '16p loss' versus Molecular Subtype #1: 'CN_CNMF'
| nPatients | CLUS_1 | CLUS_2 | CLUS_3 | CLUS_4 | CLUS_5 | CLUS_6 | CLUS_7 | CLUS_8 |
|---|---|---|---|---|---|---|---|---|
| ALL | 18 | 79 | 23 | 14 | 38 | 25 | 14 | 10 |
| 16P LOSS MUTATED | 7 | 4 | 12 | 3 | 15 | 9 | 5 | 2 |
| 16P LOSS WILD-TYPE | 11 | 75 | 11 | 11 | 23 | 16 | 9 | 8 |
Figure S22. Get High-res Image Gene #68: '16p loss' versus Molecular Subtype #1: 'CN_CNMF'

P value = 0.000184 (Chi-square test), Q value = 0.14
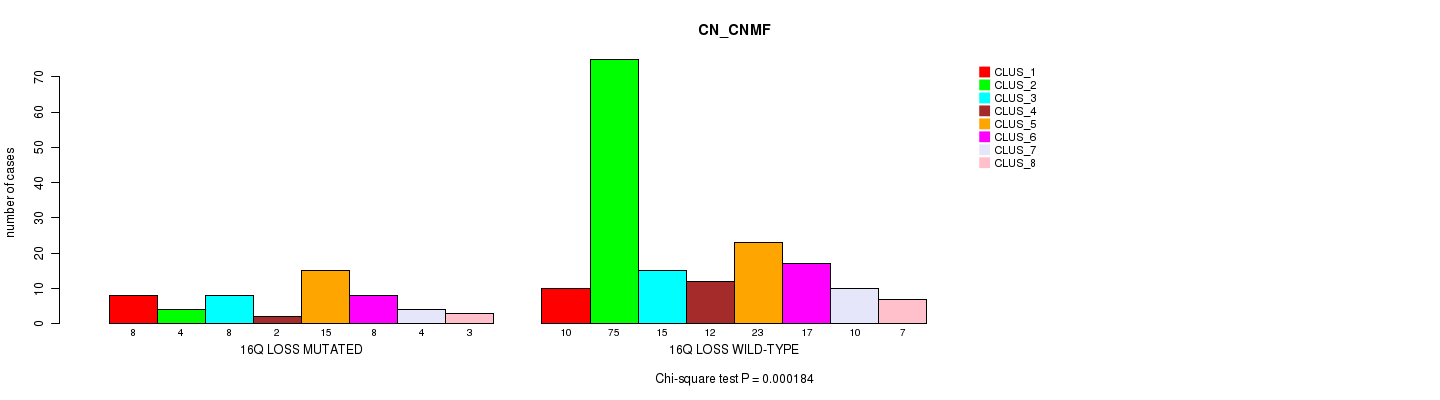
Table S23. Gene #69: '16q loss' versus Molecular Subtype #1: 'CN_CNMF'
| nPatients | CLUS_1 | CLUS_2 | CLUS_3 | CLUS_4 | CLUS_5 | CLUS_6 | CLUS_7 | CLUS_8 |
|---|---|---|---|---|---|---|---|---|
| ALL | 18 | 79 | 23 | 14 | 38 | 25 | 14 | 10 |
| 16Q LOSS MUTATED | 8 | 4 | 8 | 2 | 15 | 8 | 4 | 3 |
| 16Q LOSS WILD-TYPE | 10 | 75 | 15 | 12 | 23 | 17 | 10 | 7 |
Figure S23. Get High-res Image Gene #69: '16q loss' versus Molecular Subtype #1: 'CN_CNMF'
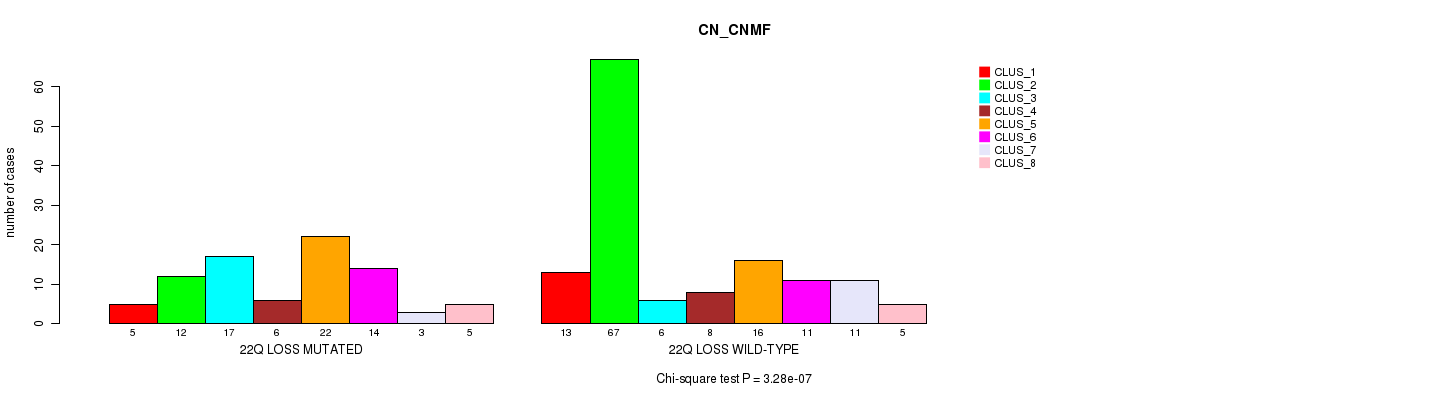
P value = 3.28e-07 (Chi-square test), Q value = 0.00026
Table S24. Gene #79: '22q loss' versus Molecular Subtype #1: 'CN_CNMF'
| nPatients | CLUS_1 | CLUS_2 | CLUS_3 | CLUS_4 | CLUS_5 | CLUS_6 | CLUS_7 | CLUS_8 |
|---|---|---|---|---|---|---|---|---|
| ALL | 18 | 79 | 23 | 14 | 38 | 25 | 14 | 10 |
| 22Q LOSS MUTATED | 5 | 12 | 17 | 6 | 22 | 14 | 3 | 5 |
| 22Q LOSS WILD-TYPE | 13 | 67 | 6 | 8 | 16 | 11 | 11 | 5 |
Figure S24. Get High-res Image Gene #79: '22q loss' versus Molecular Subtype #1: 'CN_CNMF'
-
Copy number data file = transformed.cor.cli.txt
-
Molecular subtypes file = BLCA-TP.transferedmergedcluster.txt
-
Number of patients = 221
-
Number of significantly arm-level cnvs = 80
-
Number of molecular subtypes = 10
-
Exclude genes that fewer than K tumors have mutations, K = 3
For multi-class clinical features (nominal or ordinal), Chi-square tests (Greenwood and Nikulin 1996) were used to estimate the P values using the 'chisq.test' function in R
For binary or multi-class clinical features (nominal or ordinal), two-tailed Fisher's exact tests (Fisher 1922) were used to estimate the P values using the 'fisher.test' function in R
For multiple hypothesis correction, Q value is the False Discovery Rate (FDR) analogue of the P value (Benjamini and Hochberg 1995), defined as the minimum FDR at which the test may be called significant. We used the 'Benjamini and Hochberg' method of 'p.adjust' function in R to convert P values into Q values.
In addition to the links below, the full results of the analysis summarized in this report can also be downloaded programmatically using firehose_get, or interactively from either the Broad GDAC website or TCGA Data Coordination Center Portal.