This pipeline computes the correlation between significant copy number variation (cnv focal) genes and selected clinical features.
Testing the association between copy number variation 53 focal events and 9 clinical features across 78 patients, 3 significant findings detected with Q value < 0.25.
-
amp_19q13.13 cnv correlated to 'Time to Death'.
-
del_7q34 cnv correlated to 'Time to Death'.
-
del_14q32.31 cnv correlated to 'NUMBER.OF.LYMPH.NODES'.
Table 1. Get Full Table Overview of the association between significant copy number variation of 53 focal events and 9 clinical features. Shown in the table are P values (Q values). Thresholded by Q value < 0.25, 3 significant findings detected.
|
Clinical Features |
Time to Death |
AGE |
PATHOLOGY T STAGE |
PATHOLOGY N STAGE |
PATHOLOGY M STAGE |
HISTOLOGICAL TYPE |
RADIATIONS RADIATION REGIMENINDICATION |
NUMBERPACKYEARSSMOKED |
NUMBER OF LYMPH NODES |
||
| nCNV (%) | nWild-Type | logrank test | t-test | Fisher's exact test | Fisher's exact test | Fisher's exact test | Chi-square test | Fisher's exact test | t-test | t-test | |
| amp 19q13 13 | 23 (29%) | 55 |
0.000486 (0.226) |
0.982 (1.00) |
0.405 (1.00) |
0.263 (1.00) |
0.705 (1.00) |
0.516 (1.00) |
0.00141 (0.65) |
0.935 (1.00) |
0.0954 (1.00) |
| del 7q34 | 14 (18%) | 64 |
0.000262 (0.122) |
0.421 (1.00) |
0.312 (1.00) |
0.286 (1.00) |
0.122 (1.00) |
0.882 (1.00) |
0.0499 (1.00) |
0.722 (1.00) |
0.109 (1.00) |
| del 14q32 31 | 10 (13%) | 68 |
0.167 (1.00) |
0.138 (1.00) |
0.273 (1.00) |
0.262 (1.00) |
0.485 (1.00) |
0.0762 (1.00) |
1 (1.00) |
0.000254 (0.118) |
|
| amp 1q21 3 | 42 (54%) | 36 |
0.0407 (1.00) |
0.451 (1.00) |
0.206 (1.00) |
0.795 (1.00) |
0.176 (1.00) |
0.279 (1.00) |
0.361 (1.00) |
0.96 (1.00) |
0.332 (1.00) |
| amp 2p24 3 | 18 (23%) | 60 |
0.876 (1.00) |
0.0464 (1.00) |
0.362 (1.00) |
1 (1.00) |
1 (1.00) |
0.331 (1.00) |
1 (1.00) |
0.809 (1.00) |
0.689 (1.00) |
| amp 3q26 2 | 59 (76%) | 19 |
0.84 (1.00) |
0.994 (1.00) |
0.269 (1.00) |
0.554 (1.00) |
0.58 (1.00) |
0.00162 (0.745) |
0.169 (1.00) |
0.746 (1.00) |
0.0334 (1.00) |
| amp 3q28 | 58 (74%) | 20 |
0.659 (1.00) |
0.866 (1.00) |
0.26 (1.00) |
0.776 (1.00) |
0.676 (1.00) |
0.003 (1.00) |
0.496 (1.00) |
0.746 (1.00) |
0.391 (1.00) |
| amp 4q12 | 8 (10%) | 70 |
0.534 (1.00) |
0.792 (1.00) |
0.376 (1.00) |
1 (1.00) |
0.716 (1.00) |
0.0402 (1.00) |
0.614 (1.00) |
0.946 (1.00) |
0.284 (1.00) |
| amp 5p15 33 | 28 (36%) | 50 |
0.565 (1.00) |
0.509 (1.00) |
1 (1.00) |
0.785 (1.00) |
0.82 (1.00) |
0.0937 (1.00) |
0.761 (1.00) |
0.306 (1.00) |
0.426 (1.00) |
| amp 6p21 33 | 21 (27%) | 57 |
0.831 (1.00) |
0.53 (1.00) |
1 (1.00) |
0.77 (1.00) |
0.509 (1.00) |
0.31 (1.00) |
0.74 (1.00) |
0.787 (1.00) |
0.176 (1.00) |
| amp 7p11 2 | 15 (19%) | 63 |
0.0225 (1.00) |
0.699 (1.00) |
0.18 (1.00) |
0.163 (1.00) |
1 (1.00) |
0.852 (1.00) |
0.115 (1.00) |
0.0975 (1.00) |
|
| amp 8q24 21 | 33 (42%) | 45 |
0.588 (1.00) |
0.191 (1.00) |
0.21 (1.00) |
1 (1.00) |
0.493 (1.00) |
0.446 (1.00) |
0.54 (1.00) |
0.183 (1.00) |
0.99 (1.00) |
| amp 9p24 1 | 12 (15%) | 66 |
0.0937 (1.00) |
0.644 (1.00) |
0.18 (1.00) |
0.163 (1.00) |
0.825 (1.00) |
0.93 (1.00) |
0.678 (1.00) |
0.242 (1.00) |
0.605 (1.00) |
| amp 11p13 | 6 (8%) | 72 |
0.0073 (1.00) |
0.677 (1.00) |
0.238 (1.00) |
1 (1.00) |
0.661 (1.00) |
0.964 (1.00) |
1 (1.00) |
||
| amp 11q13 3 | 10 (13%) | 68 |
0.675 (1.00) |
0.267 (1.00) |
1 (1.00) |
1 (1.00) |
0.567 (1.00) |
0.122 (1.00) |
0.357 (1.00) |
0.299 (1.00) |
0.666 (1.00) |
| amp 11q22 1 | 13 (17%) | 65 |
0.33 (1.00) |
0.000691 (0.32) |
0.74 (1.00) |
0.743 (1.00) |
1 (1.00) |
0.908 (1.00) |
0.214 (1.00) |
0.445 (1.00) |
|
| amp 13q22 1 | 13 (17%) | 65 |
0.0577 (1.00) |
0.912 (1.00) |
1 (1.00) |
0.286 (1.00) |
1 (1.00) |
0.878 (1.00) |
0.683 (1.00) |
0.00221 (1.00) |
0.113 (1.00) |
| amp 15q26 1 | 16 (21%) | 62 |
0.61 (1.00) |
0.724 (1.00) |
0.122 (1.00) |
0.745 (1.00) |
0.708 (1.00) |
0.141 (1.00) |
0.723 (1.00) |
0.744 (1.00) |
|
| amp 16p13 13 | 14 (18%) | 64 |
0.839 (1.00) |
0.052 (1.00) |
0.00276 (1.00) |
0.0494 (1.00) |
0.205 (1.00) |
0.554 (1.00) |
0.693 (1.00) |
0.012 (1.00) |
0.235 (1.00) |
| amp 17q12 | 9 (12%) | 69 |
1 (1.00) |
0.39 (1.00) |
0.0255 (1.00) |
0.116 (1.00) |
0.594 (1.00) |
0.968 (1.00) |
0.64 (1.00) |
0.565 (1.00) |
|
| amp 17q25 1 | 20 (26%) | 58 |
0.809 (1.00) |
0.47 (1.00) |
0.15 (1.00) |
0.078 (1.00) |
1 (1.00) |
0.654 (1.00) |
1 (1.00) |
0.735 (1.00) |
0.311 (1.00) |
| amp 19q13 32 | 22 (28%) | 56 |
0.0257 (1.00) |
0.804 (1.00) |
0.782 (1.00) |
0.576 (1.00) |
0.888 (1.00) |
0.563 (1.00) |
0.000915 (0.423) |
0.801 (1.00) |
0.4 (1.00) |
| amp 20q11 21 | 31 (40%) | 47 |
0.354 (1.00) |
0.581 (1.00) |
0.435 (1.00) |
0.187 (1.00) |
0.413 (1.00) |
0.553 (1.00) |
1 (1.00) |
0.855 (1.00) |
0.62 (1.00) |
| amp xq28 | 14 (18%) | 64 |
0.186 (1.00) |
0.0773 (1.00) |
0.352 (1.00) |
0.202 (1.00) |
1 (1.00) |
0.17 (1.00) |
1 (1.00) |
0.237 (1.00) |
0.0479 (1.00) |
| del 1p36 23 | 12 (15%) | 66 |
0.93 (1.00) |
0.829 (1.00) |
1 (1.00) |
1 (1.00) |
0.341 (1.00) |
0.149 (1.00) |
0.411 (1.00) |
0.322 (1.00) |
0.703 (1.00) |
| del 2q22 1 | 12 (15%) | 66 |
0.96 (1.00) |
0.109 (1.00) |
0.312 (1.00) |
0.723 (1.00) |
0.809 (1.00) |
0.442 (1.00) |
0.0242 (1.00) |
0.244 (1.00) |
0.544 (1.00) |
| del 2q37 1 | 31 (40%) | 47 |
0.467 (1.00) |
0.00839 (1.00) |
0.195 (1.00) |
0.794 (1.00) |
0.661 (1.00) |
0.675 (1.00) |
0.758 (1.00) |
0.316 (1.00) |
0.15 (1.00) |
| del 3p14 2 | 31 (40%) | 47 |
0.0786 (1.00) |
0.524 (1.00) |
0.444 (1.00) |
0.0319 (1.00) |
0.661 (1.00) |
0.0528 (1.00) |
0.12 (1.00) |
0.639 (1.00) |
0.0333 (1.00) |
| del 4q22 1 | 15 (19%) | 63 |
0.00737 (1.00) |
0.374 (1.00) |
0.756 (1.00) |
0.102 (1.00) |
0.708 (1.00) |
0.497 (1.00) |
0.115 (1.00) |
0.784 (1.00) |
0.131 (1.00) |
| del 4q35 2 | 21 (27%) | 57 |
0.0301 (1.00) |
0.503 (1.00) |
0.775 (1.00) |
0.559 (1.00) |
0.668 (1.00) |
0.128 (1.00) |
0.32 (1.00) |
0.328 (1.00) |
0.179 (1.00) |
| del 5q15 | 21 (27%) | 57 |
0.0437 (1.00) |
0.128 (1.00) |
0.39 (1.00) |
0.143 (1.00) |
0.758 (1.00) |
0.265 (1.00) |
0.32 (1.00) |
0.842 (1.00) |
0.188 (1.00) |
| del 5q35 2 | 22 (28%) | 56 |
0.0521 (1.00) |
0.196 (1.00) |
0.775 (1.00) |
0.242 (1.00) |
1 (1.00) |
0.304 (1.00) |
0.5 (1.00) |
0.842 (1.00) |
0.144 (1.00) |
| del 6p24 2 | 9 (12%) | 69 |
0.654 (1.00) |
0.024 (1.00) |
1 (1.00) |
0.0471 (1.00) |
0.764 (1.00) |
0.968 (1.00) |
1 (1.00) |
0.389 (1.00) |
|
| del 6q26 | 23 (29%) | 55 |
0.106 (1.00) |
0.457 (1.00) |
1 (1.00) |
0.559 (1.00) |
0.546 (1.00) |
0.508 (1.00) |
0.324 (1.00) |
0.101 (1.00) |
0.824 (1.00) |
| del 10q23 31 | 18 (23%) | 60 |
0.0468 (1.00) |
0.602 (1.00) |
0.762 (1.00) |
0.0642 (1.00) |
0.734 (1.00) |
0.867 (1.00) |
0.164 (1.00) |
0.442 (1.00) |
0.0648 (1.00) |
| del 11p15 1 | 27 (35%) | 51 |
0.302 (1.00) |
0.842 (1.00) |
1 (1.00) |
0.412 (1.00) |
0.579 (1.00) |
0.341 (1.00) |
1 (1.00) |
0.516 (1.00) |
0.179 (1.00) |
| del 11q23 3 | 44 (56%) | 34 |
0.778 (1.00) |
0.595 (1.00) |
0.314 (1.00) |
1 (1.00) |
1 (1.00) |
0.0679 (1.00) |
0.37 (1.00) |
0.419 (1.00) |
0.617 (1.00) |
| del 11q25 | 49 (63%) | 29 |
0.229 (1.00) |
0.418 (1.00) |
0.438 (1.00) |
0.603 (1.00) |
1 (1.00) |
0.0181 (1.00) |
0.351 (1.00) |
0.883 (1.00) |
0.675 (1.00) |
| del 13q12 12 | 24 (31%) | 54 |
0.317 (1.00) |
0.593 (1.00) |
1 (1.00) |
0.398 (1.00) |
0.355 (1.00) |
0.178 (1.00) |
1 (1.00) |
0.628 (1.00) |
0.152 (1.00) |
| del 13q14 2 | 26 (33%) | 52 |
0.0831 (1.00) |
0.267 (1.00) |
1 (1.00) |
0.412 (1.00) |
0.578 (1.00) |
0.131 (1.00) |
1 (1.00) |
0.652 (1.00) |
0.263 (1.00) |
| del 15q15 1 | 17 (22%) | 61 |
0.516 (1.00) |
0.562 (1.00) |
1 (1.00) |
0.358 (1.00) |
0.861 (1.00) |
0.285 (1.00) |
0.277 (1.00) |
0.387 (1.00) |
0.976 (1.00) |
| del 16q12 1 | 16 (21%) | 62 |
0.82 (1.00) |
0.00863 (1.00) |
0.525 (1.00) |
0.0501 (1.00) |
1 (1.00) |
0.036 (1.00) |
0.0591 (1.00) |
0.302 (1.00) |
|
| del 16q23 1 | 14 (18%) | 64 |
0.571 (1.00) |
0.0488 (1.00) |
0.743 (1.00) |
0.741 (1.00) |
1 (1.00) |
0.00223 (1.00) |
0.443 (1.00) |
0.409 (1.00) |
0.937 (1.00) |
| del 17p12 | 22 (28%) | 56 |
0.302 (1.00) |
0.965 (1.00) |
0.39 (1.00) |
1 (1.00) |
0.381 (1.00) |
0.781 (1.00) |
1 (1.00) |
0.845 (1.00) |
0.793 (1.00) |
| del 17q25 3 | 14 (18%) | 64 |
0.0333 (1.00) |
0.686 (1.00) |
0.74 (1.00) |
0.489 (1.00) |
0.825 (1.00) |
0.541 (1.00) |
1 (1.00) |
0.752 (1.00) |
0.67 (1.00) |
| del 18q21 2 | 19 (24%) | 59 |
0.866 (1.00) |
0.39 (1.00) |
0.554 (1.00) |
0.24 (1.00) |
0.419 (1.00) |
0.1 (1.00) |
0.724 (1.00) |
0.282 (1.00) |
0.337 (1.00) |
| del 19p13 3 | 18 (23%) | 60 |
0.449 (1.00) |
0.528 (1.00) |
0.121 (1.00) |
1 (1.00) |
1 (1.00) |
0.373 (1.00) |
0.164 (1.00) |
0.504 (1.00) |
0.415 (1.00) |
| del 19q13 33 | 9 (12%) | 69 |
0.0916 (1.00) |
0.342 (1.00) |
0.257 (1.00) |
1 (1.00) |
0.218 (1.00) |
0.968 (1.00) |
1 (1.00) |
0.412 (1.00) |
|
| del 20p12 1 | 13 (17%) | 65 |
0.185 (1.00) |
0.522 (1.00) |
0.74 (1.00) |
1 (1.00) |
0.825 (1.00) |
0.492 (1.00) |
0.11 (1.00) |
0.677 (1.00) |
0.805 (1.00) |
| del 21q21 1 | 14 (18%) | 64 |
0.031 (1.00) |
0.29 (1.00) |
0.756 (1.00) |
0.745 (1.00) |
1 (1.00) |
0.882 (1.00) |
1 (1.00) |
0.234 (1.00) |
|
| del 22q13 32 | 18 (23%) | 60 |
0.405 (1.00) |
0.34 (1.00) |
0.761 (1.00) |
0.356 (1.00) |
0.734 (1.00) |
0.292 (1.00) |
0.483 (1.00) |
0.0522 (1.00) |
0.135 (1.00) |
| del xp11 3 | 22 (28%) | 56 |
0.275 (1.00) |
0.721 (1.00) |
0.775 (1.00) |
1 (1.00) |
0.776 (1.00) |
0.304 (1.00) |
0.174 (1.00) |
0.0488 (1.00) |
0.529 (1.00) |
| del xq21 33 | 15 (19%) | 63 |
0.00347 (1.00) |
0.686 (1.00) |
0.529 (1.00) |
0.511 (1.00) |
0.825 (1.00) |
0.852 (1.00) |
0.262 (1.00) |
0.411 (1.00) |
0.393 (1.00) |
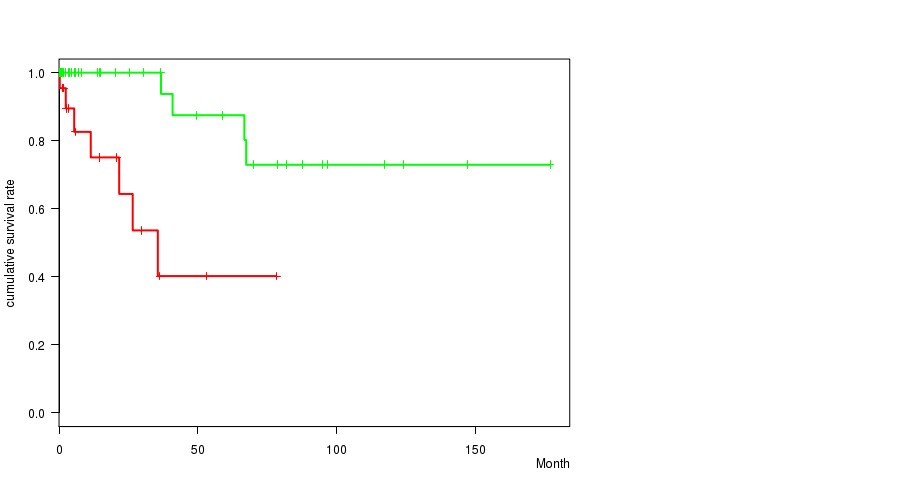
P value = 0.000486 (logrank test), Q value = 0.23
Table S1. Gene #19: 'amp_19q13.13' versus Clinical Feature #1: 'Time to Death'
| nPatients | nDeath | Duration Range (Median), Month | |
|---|---|---|---|
| ALL | 76 | 11 | 0.0 - 177.0 (6.0) |
| AMP PEAK 19(19Q13.13) MUTATED | 23 | 7 | 0.1 - 78.3 (6.0) |
| AMP PEAK 19(19Q13.13) WILD-TYPE | 53 | 4 | 0.0 - 177.0 (6.1) |
Figure S1. Get High-res Image Gene #19: 'amp_19q13.13' versus Clinical Feature #1: 'Time to Death'
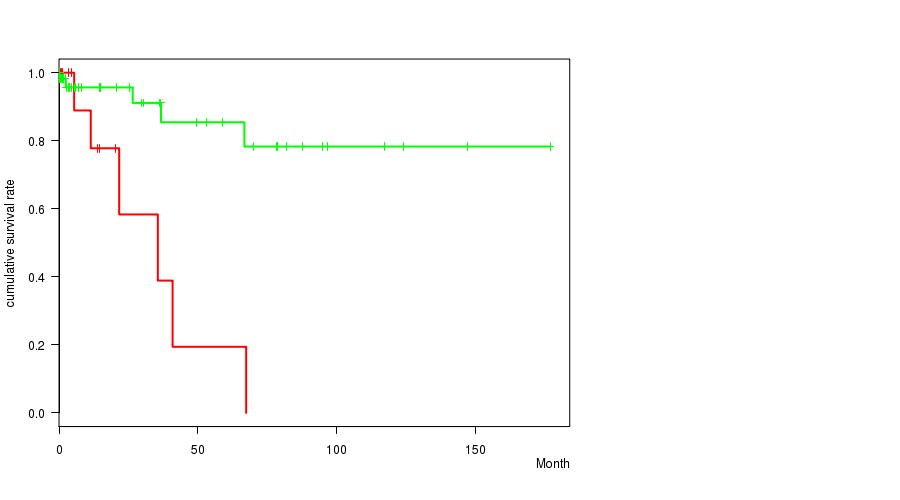
P value = 0.000262 (logrank test), Q value = 0.12
Table S2. Gene #33: 'del_7q34' versus Clinical Feature #1: 'Time to Death'
| nPatients | nDeath | Duration Range (Median), Month | |
|---|---|---|---|
| ALL | 76 | 11 | 0.0 - 177.0 (6.0) |
| DEL PEAK 11(7Q34) MUTATED | 14 | 6 | 0.6 - 67.5 (12.7) |
| DEL PEAK 11(7Q34) WILD-TYPE | 62 | 5 | 0.0 - 177.0 (5.9) |
Figure S2. Get High-res Image Gene #33: 'del_7q34' versus Clinical Feature #1: 'Time to Death'
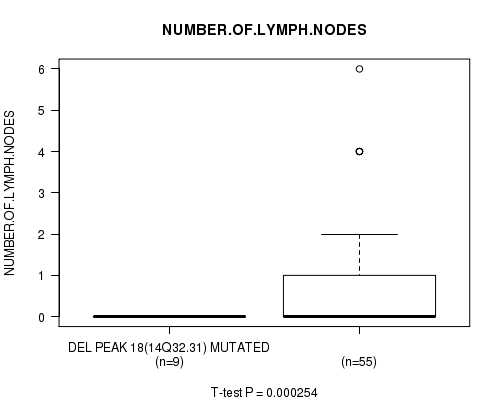
P value = 0.000254 (t-test), Q value = 0.12
Table S3. Gene #40: 'del_14q32.31' versus Clinical Feature #9: 'NUMBER.OF.LYMPH.NODES'
| nPatients | Mean (Std.Dev) | |
|---|---|---|
| ALL | 64 | 0.6 (1.3) |
| DEL PEAK 18(14Q32.31) MUTATED | 9 | 0.0 (0.0) |
| DEL PEAK 18(14Q32.31) WILD-TYPE | 55 | 0.7 (1.3) |
Figure S3. Get High-res Image Gene #40: 'del_14q32.31' versus Clinical Feature #9: 'NUMBER.OF.LYMPH.NODES'
-
Copy number data file = transformed.cor.cli.txt
-
Clinical data file = CESC-TP.merged_data.txt
-
Number of patients = 78
-
Number of significantly focal cnvs = 53
-
Number of selected clinical features = 9
-
Exclude genes that fewer than K tumors have mutations, K = 3
For survival clinical features, the Kaplan-Meier survival curves of tumors with and without gene mutations were plotted and the statistical significance P values were estimated by logrank test (Bland and Altman 2004) using the 'survdiff' function in R
For continuous numerical clinical features, two-tailed Student's t test with unequal variance (Lehmann and Romano 2005) was applied to compare the clinical values between tumors with and without gene mutations using 't.test' function in R
For binary or multi-class clinical features (nominal or ordinal), two-tailed Fisher's exact tests (Fisher 1922) were used to estimate the P values using the 'fisher.test' function in R
For multi-class clinical features (nominal or ordinal), Chi-square tests (Greenwood and Nikulin 1996) were used to estimate the P values using the 'chisq.test' function in R
For multiple hypothesis correction, Q value is the False Discovery Rate (FDR) analogue of the P value (Benjamini and Hochberg 1995), defined as the minimum FDR at which the test may be called significant. We used the 'Benjamini and Hochberg' method of 'p.adjust' function in R to convert P values into Q values.
In addition to the links below, the full results of the analysis summarized in this report can also be downloaded programmatically using firehose_get, or interactively from either the Broad GDAC website or TCGA Data Coordination Center Portal.