This pipeline uses various statistical tests to identify miRs whose expression levels correlated to selected clinical features.
Testing the association between 539 miRs and 9 clinical features across 78 samples, statistically thresholded by Q value < 0.05, 4 clinical features related to at least one miRs.
-
1 miR correlated to 'AGE'.
-
HSA-MIR-424
-
6 miRs correlated to 'PATHOLOGY.M.STAGE'.
-
HSA-MIR-202 , HSA-MIR-514-1 , HSA-MIR-514-3 , HSA-MIR-514-2 , HSA-MIR-509-3 , ...
-
11 miRs correlated to 'HISTOLOGICAL.TYPE'.
-
HSA-MIR-205 , HSA-MIR-944 , HSA-MIR-194-2 , HSA-MIR-192 , HSA-MIR-194-1 , ...
-
4 miRs correlated to 'RADIATIONS.RADIATION.REGIMENINDICATION'.
-
HSA-MIR-338 , HSA-MIR-660 , HSA-MIR-532 , HSA-MIR-362
-
No miRs correlated to 'Time to Death', 'PATHOLOGY.T.STAGE', 'PATHOLOGY.N.STAGE', 'NUMBERPACKYEARSSMOKED', and 'NUMBER.OF.LYMPH.NODES'.
Complete statistical result table is provided in Supplement Table 1
Table 1. Get Full Table This table shows the clinical features, statistical methods used, and the number of miRs that are significantly associated with each clinical feature at Q value < 0.05.
| Clinical feature | Statistical test | Significant miRs | Associated with | Associated with | ||
|---|---|---|---|---|---|---|
| Time to Death | Cox regression test | N=0 | ||||
| AGE | Spearman correlation test | N=1 | older | N=0 | younger | N=1 |
| PATHOLOGY T STAGE | Spearman correlation test | N=0 | ||||
| PATHOLOGY N STAGE | t test | N=0 | ||||
| PATHOLOGY M STAGE | ANOVA test | N=6 | ||||
| HISTOLOGICAL TYPE | ANOVA test | N=11 | ||||
| RADIATIONS RADIATION REGIMENINDICATION | t test | N=4 | yes | N=4 | no | N=0 |
| NUMBERPACKYEARSSMOKED | Spearman correlation test | N=0 | ||||
| NUMBER OF LYMPH NODES | Spearman correlation test | N=0 |
Table S1. Basic characteristics of clinical feature: 'Time to Death'
| Time to Death | Duration (Months) | 0.1-177 (median=10.1) |
| censored | N = 62 | |
| death | N = 14 | |
| Significant markers | N = 0 |
Table S2. Basic characteristics of clinical feature: 'AGE'
| AGE | Mean (SD) | 48.09 (13) |
| Significant markers | N = 1 | |
| pos. correlated | 0 | |
| neg. correlated | 1 |
Table S3. Get Full Table List of one miR significantly correlated to 'AGE' by Spearman correlation test
| SpearmanCorr | corrP | Q | |
|---|---|---|---|
| HSA-MIR-424 | -0.4656 | 1.984e-05 | 0.0107 |
Figure S1. Get High-res Image As an example, this figure shows the association of HSA-MIR-424 to 'AGE'. P value = 1.98e-05 with Spearman correlation analysis. The straight line presents the best linear regression.
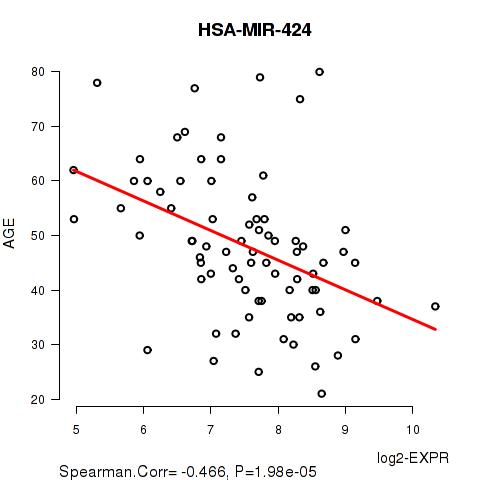
Table S4. Basic characteristics of clinical feature: 'PATHOLOGY.T.STAGE'
| PATHOLOGY.T.STAGE | Mean (SD) | 1.41 (0.66) |
| N | ||
| 1 | 49 | |
| 2 | 22 | |
| 3 | 1 | |
| 4 | 2 | |
| Significant markers | N = 0 |
Table S5. Basic characteristics of clinical feature: 'PATHOLOGY.N.STAGE'
| PATHOLOGY.N.STAGE | Labels | N |
| class0 | 49 | |
| class1 | 24 | |
| Significant markers | N = 0 |
Table S6. Basic characteristics of clinical feature: 'PATHOLOGY.M.STAGE'
| PATHOLOGY.M.STAGE | Labels | N |
| M0 | 48 | |
| M1 | 2 | |
| MX | 23 | |
| Significant markers | N = 6 |
Table S7. Get Full Table List of 6 miRs differentially expressed by 'PATHOLOGY.M.STAGE'
| ANOVA_P | Q | |
|---|---|---|
| HSA-MIR-202 | 5.325e-07 | 0.000287 |
| HSA-MIR-514-1 | 2.612e-05 | 0.0141 |
| HSA-MIR-514-3 | 5.878e-05 | 0.0316 |
| HSA-MIR-514-2 | 6.079e-05 | 0.0326 |
| HSA-MIR-509-3 | 6.346e-05 | 0.034 |
| HSA-MIR-452 | 8.615e-05 | 0.046 |
Figure S2. Get High-res Image As an example, this figure shows the association of HSA-MIR-202 to 'PATHOLOGY.M.STAGE'. P value = 5.32e-07 with ANOVA analysis.
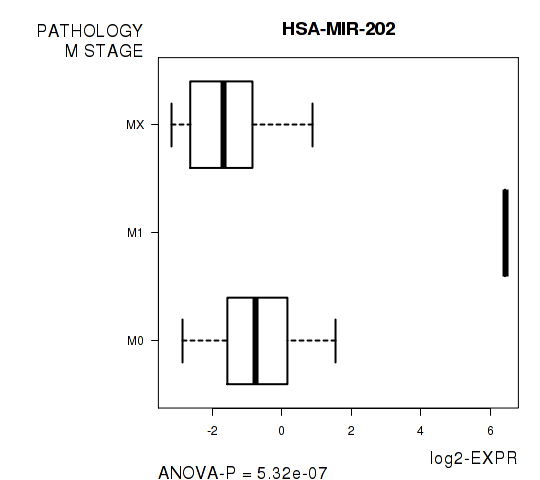
Table S8. Basic characteristics of clinical feature: 'HISTOLOGICAL.TYPE'
| HISTOLOGICAL.TYPE | Labels | N |
| CERVICAL SQUAMOUS CELL CARCINOMA | 67 | |
| ENDOCERVICAL ADENOCARCINOMA OF THE USUAL TYPE | 1 | |
| ENDOCERVICAL TYPE OF ADENOCARCINOMA | 8 | |
| ENDOMETRIOID ADENOCARCINOMA OF ENDOCERVIX | 1 | |
| MUCINOUS ADENOCARCINOMA OF ENDOCERVICAL TYPE | 1 | |
| Significant markers | N = 11 |
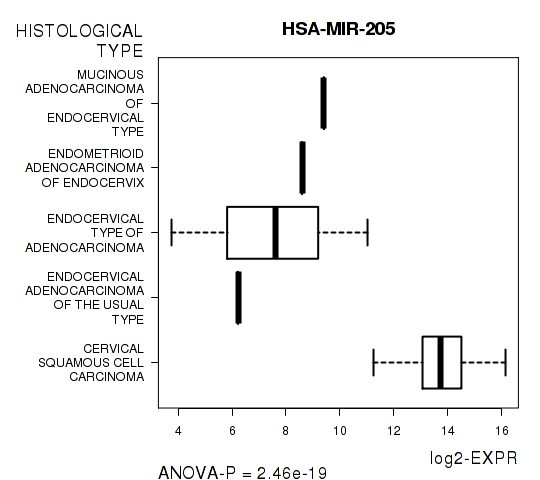
Table S9. Get Full Table List of top 10 miRs differentially expressed by 'HISTOLOGICAL.TYPE'
| ANOVA_P | Q | |
|---|---|---|
| HSA-MIR-205 | 2.464e-19 | 1.32e-16 |
| HSA-MIR-944 | 3.302e-15 | 1.77e-12 |
| HSA-MIR-194-2 | 9.301e-15 | 4.98e-12 |
| HSA-MIR-192 | 1.71e-14 | 9.13e-12 |
| HSA-MIR-194-1 | 2.291e-13 | 1.22e-10 |
| HSA-MIR-375 | 3.566e-07 | 0.00019 |
| HSA-MIR-10A | 2.367e-06 | 0.00126 |
| HSA-MIR-215 | 5.668e-06 | 0.003 |
| HSA-MIR-449A | 2.611e-05 | 0.0138 |
| HSA-MIR-155 | 2.892e-05 | 0.0153 |
Figure S3. Get High-res Image As an example, this figure shows the association of HSA-MIR-205 to 'HISTOLOGICAL.TYPE'. P value = 2.46e-19 with ANOVA analysis.
4 miRs related to 'RADIATIONS.RADIATION.REGIMENINDICATION'.
Table S10. Basic characteristics of clinical feature: 'RADIATIONS.RADIATION.REGIMENINDICATION'
| RADIATIONS.RADIATION.REGIMENINDICATION | Labels | N |
| NO | 17 | |
| YES | 61 | |
| Significant markers | N = 4 | |
| Higher in YES | 4 | |
| Higher in NO | 0 |
Table S11. Get Full Table List of 4 miRs differentially expressed by 'RADIATIONS.RADIATION.REGIMENINDICATION'
| T(pos if higher in 'YES') | ttestP | Q | AUC | |
|---|---|---|---|---|
| HSA-MIR-338 | 5.09 | 1.263e-05 | 0.00678 | 0.8245 |
| HSA-MIR-660 | 5.21 | 2.116e-05 | 0.0113 | 0.8467 |
| HSA-MIR-532 | 4.79 | 4.653e-05 | 0.0249 | 0.811 |
| HSA-MIR-362 | 4.47 | 9.061e-05 | 0.0484 | 0.8014 |
Figure S4. Get High-res Image As an example, this figure shows the association of HSA-MIR-338 to 'RADIATIONS.RADIATION.REGIMENINDICATION'. P value = 1.26e-05 with T-test analysis.
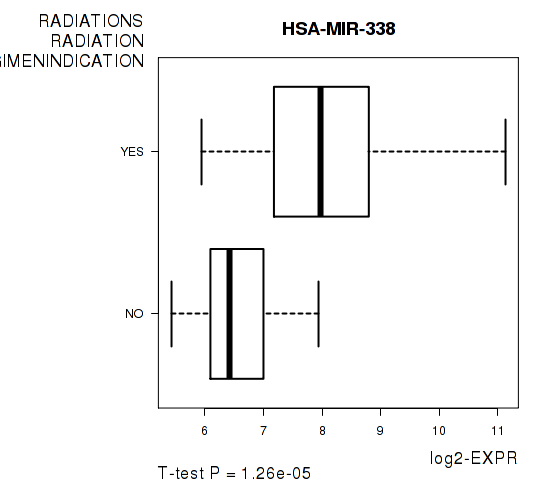
Table S12. Basic characteristics of clinical feature: 'NUMBERPACKYEARSSMOKED'
| NUMBERPACKYEARSSMOKED | Mean (SD) | 19.24 (13) |
| Significant markers | N = 0 |
-
Expresson data file = CESC-TP.miRseq_RPKM_log2.txt
-
Clinical data file = CESC-TP.merged_data.txt
-
Number of patients = 78
-
Number of miRs = 539
-
Number of clinical features = 9
For survival clinical features, Wald's test in univariate Cox regression analysis with proportional hazards model (Andersen and Gill 1982) was used to estimate the P values using the 'coxph' function in R. Kaplan-Meier survival curves were plot using the four quartile subgroups of patients based on expression levels
For continuous numerical clinical features, Spearman's rank correlation coefficients (Spearman 1904) and two-tailed P values were estimated using 'cor.test' function in R
For two-class clinical features, two-tailed Student's t test with unequal variance (Lehmann and Romano 2005) was applied to compare the log2-expression levels between the two clinical classes using 't.test' function in R
For multi-class clinical features (ordinal or nominal), one-way analysis of variance (Howell 2002) was applied to compare the log2-expression levels between different clinical classes using 'anova' function in R
For multiple hypothesis correction, Q value is the False Discovery Rate (FDR) analogue of the P value (Benjamini and Hochberg 1995), defined as the minimum FDR at which the test may be called significant. We used the 'Benjamini and Hochberg' method of 'p.adjust' function in R to convert P values into Q values.
In addition to the links below, the full results of the analysis summarized in this report can also be downloaded programmatically using firehose_get, or interactively from either the Broad GDAC website or TCGA Data Coordination Center Portal.