This pipeline computes the correlation between significantly recurrent gene mutations and selected clinical features.
Testing the association between mutation status of 24 genes and 11 clinical features across 223 patients, 8 significant findings detected with Q value < 0.25.
-
BRAF mutation correlated to 'HISTOLOGICAL.TYPE'.
-
TP53 mutation correlated to 'HISTOLOGICAL.TYPE'.
-
PIK3CA mutation correlated to 'NUMBER.OF.LYMPH.NODES'.
-
ACVR2A mutation correlated to 'NUMBER.OF.LYMPH.NODES'.
-
CRTC1 mutation correlated to 'NUMBER.OF.LYMPH.NODES'.
-
KRTAP5-5 mutation correlated to 'NUMBER.OF.LYMPH.NODES'.
-
PCBP1 mutation correlated to 'NEOPLASM.DISEASESTAGE'.
-
GGT1 mutation correlated to 'NUMBER.OF.LYMPH.NODES'.
Table 1. Get Full Table Overview of the association between mutation status of 24 genes and 11 clinical features. Shown in the table are P values (Q values). Thresholded by Q value < 0.25, 8 significant findings detected.
|
Clinical Features |
Time to Death |
AGE |
PRIMARY SITE OF DISEASE |
NEOPLASM DISEASESTAGE |
PATHOLOGY T STAGE |
PATHOLOGY N STAGE |
PATHOLOGY M STAGE |
GENDER |
HISTOLOGICAL TYPE |
COMPLETENESS OF RESECTION |
NUMBER OF LYMPH NODES |
||
| nMutated (%) | nWild-Type | logrank test | t-test | Fisher's exact test | Chi-square test | Fisher's exact test | Fisher's exact test | Fisher's exact test | Fisher's exact test | Fisher's exact test | Fisher's exact test | t-test | |
| BRAF | 22 (10%) | 201 |
0.667 (1.00) |
0.0902 (1.00) |
0.0261 (1.00) |
0.154 (1.00) |
0.0799 (1.00) |
0.904 (1.00) |
0.395 (1.00) |
0.0703 (1.00) |
9.61e-06 (0.00245) |
0.612 (1.00) |
0.589 (1.00) |
| TP53 | 119 (53%) | 104 |
0.485 (1.00) |
0.0778 (1.00) |
0.013 (1.00) |
0.344 (1.00) |
0.928 (1.00) |
0.258 (1.00) |
0.885 (1.00) |
0.285 (1.00) |
0.000164 (0.0415) |
0.566 (1.00) |
0.43 (1.00) |
| PIK3CA | 33 (15%) | 190 |
0.925 (1.00) |
0.0966 (1.00) |
0.226 (1.00) |
0.0202 (1.00) |
0.916 (1.00) |
0.022 (1.00) |
0.133 (1.00) |
0.851 (1.00) |
0.0297 (1.00) |
0.304 (1.00) |
1.26e-05 (0.00321) |
| ACVR2A | 9 (4%) | 214 |
0.217 (1.00) |
0.443 (1.00) |
0.281 (1.00) |
0.492 (1.00) |
0.905 (1.00) |
0.353 (1.00) |
1 (1.00) |
0.0912 (1.00) |
0.704 (1.00) |
1 (1.00) |
3.99e-08 (1.03e-05) |
| CRTC1 | 6 (3%) | 217 |
0.0354 (1.00) |
0.669 (1.00) |
0.266 (1.00) |
0.205 (1.00) |
0.536 (1.00) |
0.609 (1.00) |
0.43 (1.00) |
0.745 (1.00) |
1 (1.00) |
0.000473 (0.119) |
|
| KRTAP5-5 | 4 (2%) | 219 |
0.912 (1.00) |
0.589 (1.00) |
0.0263 (1.00) |
0.431 (1.00) |
0.479 (1.00) |
1 (1.00) |
1 (1.00) |
0.773 (1.00) |
1 (1.00) |
3.21e-11 (8.31e-09) |
|
| PCBP1 | 6 (3%) | 217 |
0.541 (1.00) |
0.777 (1.00) |
1 (1.00) |
5.52e-06 (0.00141) |
0.508 (1.00) |
0.536 (1.00) |
0.0311 (1.00) |
0.685 (1.00) |
1 (1.00) |
1 (1.00) |
0.0129 (1.00) |
| GGT1 | 3 (1%) | 220 |
0.957 (1.00) |
0.554 (1.00) |
0.929 (1.00) |
0.704 (1.00) |
0.567 (1.00) |
1 (1.00) |
0.609 (1.00) |
0.715 (1.00) |
1 (1.00) |
3.24e-11 (8.37e-09) |
|
| APC | 160 (72%) | 63 |
0.5 (1.00) |
0.293 (1.00) |
0.0232 (1.00) |
0.953 (1.00) |
0.945 (1.00) |
0.865 (1.00) |
0.609 (1.00) |
0.0531 (1.00) |
0.128 (1.00) |
0.186 (1.00) |
0.899 (1.00) |
| FBXW7 | 38 (17%) | 185 |
0.977 (1.00) |
0.0623 (1.00) |
0.34 (1.00) |
0.0561 (1.00) |
0.117 (1.00) |
0.745 (1.00) |
0.00355 (0.889) |
0.374 (1.00) |
0.0316 (1.00) |
0.0346 (1.00) |
0.855 (1.00) |
| NRAS | 20 (9%) | 203 |
0.145 (1.00) |
0.0391 (1.00) |
0.623 (1.00) |
0.414 (1.00) |
0.292 (1.00) |
0.0366 (1.00) |
0.542 (1.00) |
0.0357 (1.00) |
1 (1.00) |
0.471 (1.00) |
0.0251 (1.00) |
| KRAS | 96 (43%) | 127 |
0.0338 (1.00) |
0.141 (1.00) |
0.0272 (1.00) |
0.739 (1.00) |
0.296 (1.00) |
0.291 (1.00) |
0.172 (1.00) |
0.591 (1.00) |
0.0856 (1.00) |
0.0365 (1.00) |
0.194 (1.00) |
| SMAD4 | 26 (12%) | 197 |
0.613 (1.00) |
0.951 (1.00) |
1 (1.00) |
0.97 (1.00) |
0.87 (1.00) |
1 (1.00) |
0.796 (1.00) |
0.838 (1.00) |
0.0143 (1.00) |
0.831 (1.00) |
0.318 (1.00) |
| FAM123B | 25 (11%) | 198 |
0.801 (1.00) |
0.896 (1.00) |
0.499 (1.00) |
0.888 (1.00) |
0.705 (1.00) |
0.316 (1.00) |
0.782 (1.00) |
1 (1.00) |
0.856 (1.00) |
0.646 (1.00) |
0.498 (1.00) |
| SMAD2 | 15 (7%) | 208 |
0.98 (1.00) |
0.689 (1.00) |
0.78 (1.00) |
0.00267 (0.671) |
0.373 (1.00) |
0.27 (1.00) |
1 (1.00) |
0.291 (1.00) |
0.38 (1.00) |
0.748 (1.00) |
0.0341 (1.00) |
| TCF7L2 | 18 (8%) | 205 |
0.243 (1.00) |
0.385 (1.00) |
0.785 (1.00) |
0.865 (1.00) |
0.337 (1.00) |
0.943 (1.00) |
0.737 (1.00) |
0.624 (1.00) |
0.481 (1.00) |
0.575 (1.00) |
0.108 (1.00) |
| SOX9 | 10 (4%) | 213 |
0.68 (1.00) |
0.274 (1.00) |
0.181 (1.00) |
0.309 (1.00) |
0.155 (1.00) |
0.902 (1.00) |
1 (1.00) |
0.526 (1.00) |
0.608 (1.00) |
1 (1.00) |
0.203 (1.00) |
| ELF3 | 6 (3%) | 217 |
0.616 (1.00) |
0.197 (1.00) |
0.375 (1.00) |
0.974 (1.00) |
0.205 (1.00) |
1 (1.00) |
1 (1.00) |
0.685 (1.00) |
0.831 (1.00) |
0.595 (1.00) |
0.626 (1.00) |
| TNFRSF10C | 6 (3%) | 217 |
0.854 (1.00) |
0.181 (1.00) |
0.337 (1.00) |
0.0712 (1.00) |
0.195 (1.00) |
0.064 (1.00) |
0.685 (1.00) |
0.423 (1.00) |
0.0799 (1.00) |
0.184 (1.00) |
|
| KIAA1804 | 15 (7%) | 208 |
0.251 (1.00) |
0.78 (1.00) |
0.0181 (1.00) |
0.843 (1.00) |
0.732 (1.00) |
0.345 (1.00) |
1 (1.00) |
0.425 (1.00) |
0.0223 (1.00) |
0.748 (1.00) |
0.0129 (1.00) |
| PTEN | 7 (3%) | 216 |
0.49 (1.00) |
0.0292 (1.00) |
0.679 (1.00) |
0.247 (1.00) |
0.175 (1.00) |
1 (1.00) |
1 (1.00) |
0.713 (1.00) |
0.223 (1.00) |
0.595 (1.00) |
0.14 (1.00) |
| ACOT4 | 3 (1%) | 220 |
0.0271 (1.00) |
0.554 (1.00) |
0.986 (1.00) |
0.0642 (1.00) |
1 (1.00) |
0.376 (1.00) |
1 (1.00) |
0.379 (1.00) |
0.361 (1.00) |
0.653 (1.00) |
|
| MYO1B | 13 (6%) | 210 |
0.318 (1.00) |
0.611 (1.00) |
1 (1.00) |
0.263 (1.00) |
0.683 (1.00) |
0.53 (1.00) |
0.267 (1.00) |
0.778 (1.00) |
0.308 (1.00) |
0.458 (1.00) |
0.123 (1.00) |
| ACVR1B | 14 (6%) | 209 |
0.775 (1.00) |
0.809 (1.00) |
0.0692 (1.00) |
0.268 (1.00) |
0.0397 (1.00) |
1 (1.00) |
0.717 (1.00) |
1 (1.00) |
0.021 (1.00) |
1 (1.00) |
0.477 (1.00) |
P value = 9.61e-06 (Fisher's exact test), Q value = 0.0024
Table S1. Gene #4: 'BRAF MUTATION STATUS' versus Clinical Feature #9: 'HISTOLOGICAL.TYPE'
| nPatients | COLON ADENOCARCINOMA | COLON MUCINOUS ADENOCARCINOMA | RECTAL ADENOCARCINOMA | RECTAL MUCINOUS ADENOCARCINOMA |
|---|---|---|---|---|
| ALL | 130 | 22 | 57 | 8 |
| BRAF MUTATED | 10 | 10 | 1 | 1 |
| BRAF WILD-TYPE | 120 | 12 | 56 | 7 |
Figure S1. Get High-res Image Gene #4: 'BRAF MUTATION STATUS' versus Clinical Feature #9: 'HISTOLOGICAL.TYPE'

P value = 0.000164 (Fisher's exact test), Q value = 0.042
Table S2. Gene #6: 'TP53 MUTATION STATUS' versus Clinical Feature #9: 'HISTOLOGICAL.TYPE'
| nPatients | COLON ADENOCARCINOMA | COLON MUCINOUS ADENOCARCINOMA | RECTAL ADENOCARCINOMA | RECTAL MUCINOUS ADENOCARCINOMA |
|---|---|---|---|---|
| ALL | 130 | 22 | 57 | 8 |
| TP53 MUTATED | 68 | 4 | 41 | 4 |
| TP53 WILD-TYPE | 62 | 18 | 16 | 4 |
Figure S2. Get High-res Image Gene #6: 'TP53 MUTATION STATUS' versus Clinical Feature #9: 'HISTOLOGICAL.TYPE'

P value = 1.26e-05 (t-test), Q value = 0.0032
Table S3. Gene #9: 'PIK3CA MUTATION STATUS' versus Clinical Feature #11: 'NUMBER.OF.LYMPH.NODES'
| nPatients | Mean (Std.Dev) | |
|---|---|---|
| ALL | 222 | 2.3 (4.8) |
| PIK3CA MUTATED | 33 | 0.5 (1.4) |
| PIK3CA WILD-TYPE | 189 | 2.6 (5.1) |
Figure S3. Get High-res Image Gene #9: 'PIK3CA MUTATION STATUS' versus Clinical Feature #11: 'NUMBER.OF.LYMPH.NODES'

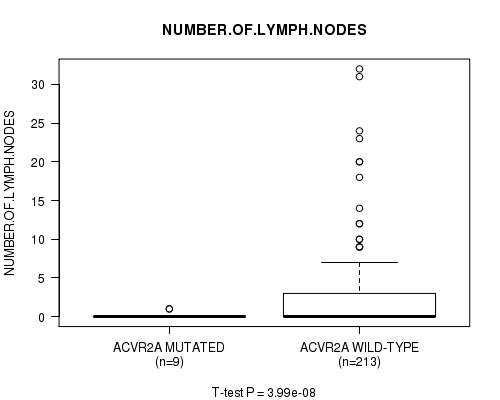
P value = 3.99e-08 (t-test), Q value = 1e-05
Table S4. Gene #12: 'ACVR2A MUTATION STATUS' versus Clinical Feature #11: 'NUMBER.OF.LYMPH.NODES'
| nPatients | Mean (Std.Dev) | |
|---|---|---|
| ALL | 222 | 2.3 (4.8) |
| ACVR2A MUTATED | 9 | 0.2 (0.4) |
| ACVR2A WILD-TYPE | 213 | 2.3 (4.9) |
Figure S4. Get High-res Image Gene #12: 'ACVR2A MUTATION STATUS' versus Clinical Feature #11: 'NUMBER.OF.LYMPH.NODES'
P value = 0.000473 (t-test), Q value = 0.12
Table S5. Gene #15: 'CRTC1 MUTATION STATUS' versus Clinical Feature #11: 'NUMBER.OF.LYMPH.NODES'
| nPatients | Mean (Std.Dev) | |
|---|---|---|
| ALL | 222 | 2.3 (4.8) |
| CRTC1 MUTATED | 6 | 0.3 (0.8) |
| CRTC1 WILD-TYPE | 216 | 2.3 (4.9) |
Figure S5. Get High-res Image Gene #15: 'CRTC1 MUTATION STATUS' versus Clinical Feature #11: 'NUMBER.OF.LYMPH.NODES'

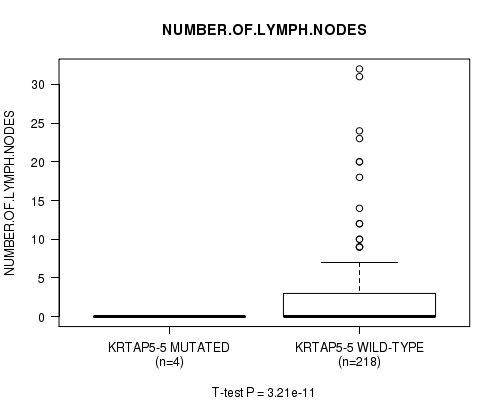
P value = 3.21e-11 (t-test), Q value = 8.3e-09
Table S6. Gene #18: 'KRTAP5-5 MUTATION STATUS' versus Clinical Feature #11: 'NUMBER.OF.LYMPH.NODES'
| nPatients | Mean (Std.Dev) | |
|---|---|---|
| ALL | 222 | 2.3 (4.8) |
| KRTAP5-5 MUTATED | 4 | 0.0 (0.0) |
| KRTAP5-5 WILD-TYPE | 218 | 2.3 (4.8) |
Figure S6. Get High-res Image Gene #18: 'KRTAP5-5 MUTATION STATUS' versus Clinical Feature #11: 'NUMBER.OF.LYMPH.NODES'
P value = 5.52e-06 (Chi-square test), Q value = 0.0014
Table S7. Gene #22: 'PCBP1 MUTATION STATUS' versus Clinical Feature #4: 'NEOPLASM.DISEASESTAGE'
| nPatients | STAGE I | STAGE II | STAGE IIA | STAGE IIB | STAGE III | STAGE IIIA | STAGE IIIB | STAGE IIIC | STAGE IV | STAGE IVA |
|---|---|---|---|---|---|---|---|---|---|---|
| ALL | 49 | 20 | 57 | 4 | 18 | 2 | 20 | 20 | 30 | 1 |
| PCBP1 MUTATED | 2 | 0 | 3 | 0 | 0 | 0 | 0 | 0 | 0 | 1 |
| PCBP1 WILD-TYPE | 47 | 20 | 54 | 4 | 18 | 2 | 20 | 20 | 30 | 0 |
Figure S7. Get High-res Image Gene #22: 'PCBP1 MUTATION STATUS' versus Clinical Feature #4: 'NEOPLASM.DISEASESTAGE'

P value = 3.24e-11 (t-test), Q value = 8.4e-09
Table S8. Gene #23: 'GGT1 MUTATION STATUS' versus Clinical Feature #11: 'NUMBER.OF.LYMPH.NODES'
| nPatients | Mean (Std.Dev) | |
|---|---|---|
| ALL | 222 | 2.3 (4.8) |
| GGT1 MUTATED | 3 | 0.0 (0.0) |
| GGT1 WILD-TYPE | 219 | 2.3 (4.8) |
Figure S8. Get High-res Image Gene #23: 'GGT1 MUTATION STATUS' versus Clinical Feature #11: 'NUMBER.OF.LYMPH.NODES'

-
Mutation data file = transformed.cor.cli.txt
-
Clinical data file = COADREAD-TP.merged_data.txt
-
Number of patients = 223
-
Number of significantly mutated genes = 24
-
Number of selected clinical features = 11
-
Exclude genes that fewer than K tumors have mutations, K = 3
For survival clinical features, the Kaplan-Meier survival curves of tumors with and without gene mutations were plotted and the statistical significance P values were estimated by logrank test (Bland and Altman 2004) using the 'survdiff' function in R
For continuous numerical clinical features, two-tailed Student's t test with unequal variance (Lehmann and Romano 2005) was applied to compare the clinical values between tumors with and without gene mutations using 't.test' function in R
For binary or multi-class clinical features (nominal or ordinal), two-tailed Fisher's exact tests (Fisher 1922) were used to estimate the P values using the 'fisher.test' function in R
For multi-class clinical features (nominal or ordinal), Chi-square tests (Greenwood and Nikulin 1996) were used to estimate the P values using the 'chisq.test' function in R
For multiple hypothesis correction, Q value is the False Discovery Rate (FDR) analogue of the P value (Benjamini and Hochberg 1995), defined as the minimum FDR at which the test may be called significant. We used the 'Benjamini and Hochberg' method of 'p.adjust' function in R to convert P values into Q values.
In addition to the links below, the full results of the analysis summarized in this report can also be downloaded programmatically using firehose_get, or interactively from either the Broad GDAC website or TCGA Data Coordination Center Portal.