This pipeline uses various statistical tests to identify mRNAs whose expression levels correlated to selected clinical features.
Testing the association between 17576 genes and 3 clinical features across 21 samples, statistically thresholded by Q value < 0.05, 1 clinical feature related to at least one genes.
-
7 genes correlated to 'GENDER'.
-
RPS4Y1|6192 , TSIX|9383 , DDX3Y|8653 , PRKY|5616 , EIF1AY|9086 , ...
-
No genes correlated to 'Time to Death', and 'AGE'.
Complete statistical result table is provided in Supplement Table 1
Table 1. Get Full Table This table shows the clinical features, statistical methods used, and the number of genes that are significantly associated with each clinical feature at Q value < 0.05.
| Clinical feature | Statistical test | Significant genes | Associated with | Associated with | ||
|---|---|---|---|---|---|---|
| Time to Death | Cox regression test | N=0 | ||||
| AGE | Spearman correlation test | N=0 | ||||
| GENDER | t test | N=7 | male | N=5 | female | N=2 |
Table S1. Basic characteristics of clinical feature: 'Time to Death'
| Time to Death | Duration (Months) | 2-211.2 (median=31.7) |
| censored | N = 17 | |
| death | N = 4 | |
| Significant markers | N = 0 |
Table S2. Basic characteristics of clinical feature: 'AGE'
| AGE | Mean (SD) | 53.95 (12) |
| Significant markers | N = 0 |
Table S3. Basic characteristics of clinical feature: 'GENDER'
| GENDER | Labels | N |
| FEMALE | 13 | |
| MALE | 8 | |
| Significant markers | N = 7 | |
| Higher in MALE | 5 | |
| Higher in FEMALE | 2 |
Table S4. Get Full Table List of 7 genes differentially expressed by 'GENDER'
| T(pos if higher in 'MALE') | ttestP | Q | AUC | |
|---|---|---|---|---|
| RPS4Y1|6192 | 13.46 | 2.056e-10 | 3.53e-06 | 1 |
| TSIX|9383 | -13.05 | 2.967e-10 | 5.09e-06 | 1 |
| DDX3Y|8653 | 19.73 | 4.682e-10 | 8.04e-06 | 1 |
| PRKY|5616 | 11.3 | 3.182e-08 | 0.000546 | 1 |
| EIF1AY|9086 | 13.09 | 5.071e-08 | 0.00087 | 1 |
| CYORF15A|246126 | 11.94 | 3.058e-07 | 0.00525 | 1 |
| XIST|7503 | -7.27 | 1.222e-06 | 0.021 | 1 |
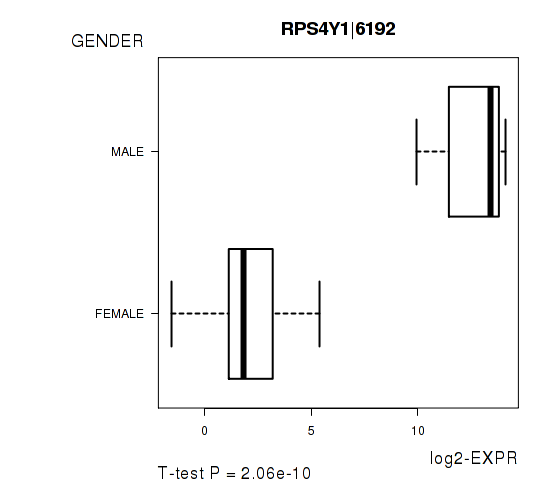
Figure S1. Get High-res Image As an example, this figure shows the association of RPS4Y1|6192 to 'GENDER'. P value = 2.06e-10 with T-test analysis.
-
Expresson data file = DLBC-TP.uncv2.mRNAseq_RSEM_normalized_log2.txt
-
Clinical data file = DLBC-TP.merged_data.txt
-
Number of patients = 21
-
Number of genes = 17576
-
Number of clinical features = 3
For survival clinical features, Wald's test in univariate Cox regression analysis with proportional hazards model (Andersen and Gill 1982) was used to estimate the P values using the 'coxph' function in R. Kaplan-Meier survival curves were plot using the four quartile subgroups of patients based on expression levels
For continuous numerical clinical features, Spearman's rank correlation coefficients (Spearman 1904) and two-tailed P values were estimated using 'cor.test' function in R
For two-class clinical features, two-tailed Student's t test with unequal variance (Lehmann and Romano 2005) was applied to compare the log2-expression levels between the two clinical classes using 't.test' function in R
For multiple hypothesis correction, Q value is the False Discovery Rate (FDR) analogue of the P value (Benjamini and Hochberg 1995), defined as the minimum FDR at which the test may be called significant. We used the 'Benjamini and Hochberg' method of 'p.adjust' function in R to convert P values into Q values.
In addition to the links below, the full results of the analysis summarized in this report can also be downloaded programmatically using firehose_get, or interactively from either the Broad GDAC website or TCGA Data Coordination Center Portal.