This pipeline computes the correlation between significant arm-level copy number variations (cnvs) and selected clinical features.
Testing the association between copy number variation 80 arm-level events and 6 clinical features across 553 patients, 11 significant findings detected with Q value < 0.25.
-
7p gain cnv correlated to 'Time to Death' and 'AGE'.
-
7q gain cnv correlated to 'Time to Death' and 'AGE'.
-
10p gain cnv correlated to 'KARNOFSKY.PERFORMANCE.SCORE'.
-
20p gain cnv correlated to 'AGE'.
-
20q gain cnv correlated to 'AGE'.
-
10p loss cnv correlated to 'Time to Death' and 'AGE'.
-
10q loss cnv correlated to 'Time to Death' and 'AGE'.
Table 1. Get Full Table Overview of the association between significant copy number variation of 80 arm-level events and 6 clinical features. Shown in the table are P values (Q values). Thresholded by Q value < 0.25, 11 significant findings detected.
|
Clinical Features |
Time to Death |
AGE | GENDER |
KARNOFSKY PERFORMANCE SCORE |
HISTOLOGICAL TYPE |
RADIATIONS RADIATION REGIMENINDICATION |
||
| nCNV (%) | nWild-Type | logrank test | t-test | Fisher's exact test | t-test | Fisher's exact test | Fisher's exact test | |
| 7p gain | 449 (81%) | 104 |
9.02e-05 (0.0426) |
1.45e-06 (0.000691) |
1 (1.00) |
0.574 (1.00) |
0.0104 (1.00) |
0.159 (1.00) |
| 7q gain | 453 (82%) | 100 |
0.000226 (0.106) |
7.13e-06 (0.00339) |
0.43 (1.00) |
0.766 (1.00) |
0.00729 (1.00) |
0.188 (1.00) |
| 10p loss | 461 (83%) | 92 |
2.48e-05 (0.0118) |
1.41e-07 (6.76e-05) |
0.199 (1.00) |
0.175 (1.00) |
0.00117 (0.547) |
0.805 (1.00) |
| 10q loss | 472 (85%) | 81 |
6.88e-05 (0.0326) |
1.16e-06 (0.000553) |
0.462 (1.00) |
0.0059 (1.00) |
0.0202 (1.00) |
0.796 (1.00) |
| 10p gain | 12 (2%) | 541 |
0.00435 (1.00) |
0.0026 (1.00) |
0.0712 (1.00) |
0.00032 (0.15) |
0.467 (1.00) |
1 (1.00) |
| 20p gain | 214 (39%) | 339 |
0.679 (1.00) |
3.69e-05 (0.0175) |
0.327 (1.00) |
0.403 (1.00) |
0.549 (1.00) |
0.572 (1.00) |
| 20q gain | 212 (38%) | 341 |
0.965 (1.00) |
0.000177 (0.0833) |
0.283 (1.00) |
0.527 (1.00) |
0.522 (1.00) |
0.51 (1.00) |
| 1p gain | 81 (15%) | 472 |
0.167 (1.00) |
0.564 (1.00) |
0.624 (1.00) |
0.347 (1.00) |
0.372 (1.00) |
0.515 (1.00) |
| 1q gain | 87 (16%) | 466 |
0.452 (1.00) |
0.838 (1.00) |
0.404 (1.00) |
0.374 (1.00) |
0.444 (1.00) |
0.528 (1.00) |
| 2p gain | 36 (7%) | 517 |
0.618 (1.00) |
0.906 (1.00) |
0.112 (1.00) |
0.6 (1.00) |
0.664 (1.00) |
0.714 (1.00) |
| 2q gain | 35 (6%) | 518 |
0.504 (1.00) |
0.637 (1.00) |
0.285 (1.00) |
0.45 (1.00) |
0.651 (1.00) |
1 (1.00) |
| 3p gain | 56 (10%) | 497 |
0.927 (1.00) |
0.0177 (1.00) |
0.471 (1.00) |
0.644 (1.00) |
0.771 (1.00) |
0.879 (1.00) |
| 3q gain | 62 (11%) | 491 |
0.826 (1.00) |
0.092 (1.00) |
0.493 (1.00) |
0.549 (1.00) |
0.696 (1.00) |
0.773 (1.00) |
| 4p gain | 35 (6%) | 518 |
0.959 (1.00) |
0.236 (1.00) |
0.722 (1.00) |
0.0834 (1.00) |
1 (1.00) |
0.574 (1.00) |
| 4q gain | 33 (6%) | 520 |
0.688 (1.00) |
0.51 (1.00) |
0.277 (1.00) |
0.146 (1.00) |
1 (1.00) |
0.248 (1.00) |
| 5p gain | 47 (8%) | 506 |
0.855 (1.00) |
0.572 (1.00) |
0.118 (1.00) |
0.199 (1.00) |
0.0816 (1.00) |
0.87 (1.00) |
| 5q gain | 39 (7%) | 514 |
0.709 (1.00) |
0.5 (1.00) |
0.0625 (1.00) |
0.704 (1.00) |
0.168 (1.00) |
0.722 (1.00) |
| 6p gain | 23 (4%) | 530 |
0.48 (1.00) |
0.571 (1.00) |
0.514 (1.00) |
0.543 (1.00) |
1 (1.00) |
0.174 (1.00) |
| 6q gain | 22 (4%) | 531 |
0.417 (1.00) |
0.3 (1.00) |
0.827 (1.00) |
0.489 (1.00) |
1 (1.00) |
0.486 (1.00) |
| 8p gain | 51 (9%) | 502 |
0.708 (1.00) |
0.464 (1.00) |
0.652 (1.00) |
0.798 (1.00) |
0.645 (1.00) |
0.751 (1.00) |
| 8q gain | 58 (10%) | 495 |
0.56 (1.00) |
0.136 (1.00) |
0.396 (1.00) |
0.918 (1.00) |
0.679 (1.00) |
1 (1.00) |
| 9p gain | 47 (8%) | 506 |
0.554 (1.00) |
0.848 (1.00) |
0.165 (1.00) |
0.881 (1.00) |
0.514 (1.00) |
0.624 (1.00) |
| 9q gain | 71 (13%) | 482 |
0.636 (1.00) |
0.945 (1.00) |
0.121 (1.00) |
0.69 (1.00) |
0.656 (1.00) |
0.891 (1.00) |
| 10q gain | 3 (1%) | 550 |
0.454 (1.00) |
0.907 (1.00) |
0.565 (1.00) |
1 (1.00) |
0.227 (1.00) |
|
| 11p gain | 18 (3%) | 535 |
0.467 (1.00) |
0.524 (1.00) |
0.635 (1.00) |
0.316 (1.00) |
1 (1.00) |
0.605 (1.00) |
| 11q gain | 15 (3%) | 538 |
0.161 (1.00) |
0.074 (1.00) |
0.179 (1.00) |
0.0605 (1.00) |
0.546 (1.00) |
0.165 (1.00) |
| 12p gain | 57 (10%) | 496 |
0.746 (1.00) |
0.181 (1.00) |
0.477 (1.00) |
0.417 (1.00) |
1 (1.00) |
0.762 (1.00) |
| 12q gain | 47 (8%) | 506 |
0.973 (1.00) |
0.578 (1.00) |
0.28 (1.00) |
0.657 (1.00) |
0.436 (1.00) |
0.742 (1.00) |
| 13q gain | 9 (2%) | 544 |
0.702 (1.00) |
0.0191 (1.00) |
0.165 (1.00) |
0.0966 (1.00) |
1 (1.00) |
0.143 (1.00) |
| 14q gain | 22 (4%) | 531 |
0.229 (1.00) |
0.141 (1.00) |
0.512 (1.00) |
0.41 (1.00) |
0.0163 (1.00) |
0.639 (1.00) |
| 15q gain | 24 (4%) | 529 |
0.46 (1.00) |
0.969 (1.00) |
0.528 (1.00) |
0.131 (1.00) |
0.346 (1.00) |
0.117 (1.00) |
| 16p gain | 37 (7%) | 516 |
0.027 (1.00) |
0.584 (1.00) |
0.296 (1.00) |
0.699 (1.00) |
1 (1.00) |
0.0446 (1.00) |
| 16q gain | 36 (7%) | 517 |
0.105 (1.00) |
0.528 (1.00) |
0.597 (1.00) |
0.984 (1.00) |
1 (1.00) |
0.0624 (1.00) |
| 17p gain | 45 (8%) | 508 |
0.403 (1.00) |
0.153 (1.00) |
0.153 (1.00) |
0.7 (1.00) |
0.853 (1.00) |
0.503 (1.00) |
| 17q gain | 56 (10%) | 497 |
0.0742 (1.00) |
0.0573 (1.00) |
0.392 (1.00) |
0.763 (1.00) |
0.884 (1.00) |
0.446 (1.00) |
| 18p gain | 57 (10%) | 496 |
0.674 (1.00) |
0.778 (1.00) |
0.67 (1.00) |
0.282 (1.00) |
0.278 (1.00) |
1 (1.00) |
| 18q gain | 56 (10%) | 497 |
0.535 (1.00) |
0.573 (1.00) |
0.313 (1.00) |
0.253 (1.00) |
0.272 (1.00) |
0.762 (1.00) |
| 19p gain | 216 (39%) | 337 |
0.36 (1.00) |
0.663 (1.00) |
0.789 (1.00) |
0.81 (1.00) |
0.351 (1.00) |
0.778 (1.00) |
| 19q gain | 190 (34%) | 363 |
0.454 (1.00) |
0.213 (1.00) |
0.583 (1.00) |
0.901 (1.00) |
0.811 (1.00) |
0.561 (1.00) |
| 21q gain | 60 (11%) | 493 |
0.491 (1.00) |
0.0397 (1.00) |
1 (1.00) |
0.167 (1.00) |
0.115 (1.00) |
1 (1.00) |
| 22q gain | 34 (6%) | 519 |
0.374 (1.00) |
0.687 (1.00) |
1 (1.00) |
0.446 (1.00) |
0.799 (1.00) |
0.85 (1.00) |
| xq gain | 16 (3%) | 537 |
0.976 (1.00) |
0.32 (1.00) |
1 (1.00) |
0.371 (1.00) |
0.192 (1.00) |
0.104 (1.00) |
| 1p loss | 15 (3%) | 538 |
0.299 (1.00) |
0.0288 (1.00) |
0.424 (1.00) |
0.887 (1.00) |
0.546 (1.00) |
0.413 (1.00) |
| 1q loss | 14 (3%) | 539 |
0.476 (1.00) |
0.00333 (1.00) |
1 (1.00) |
0.204 (1.00) |
1 (1.00) |
0.381 (1.00) |
| 2p loss | 30 (5%) | 523 |
0.908 (1.00) |
0.359 (1.00) |
0.0551 (1.00) |
0.902 (1.00) |
1 (1.00) |
0.155 (1.00) |
| 2q loss | 30 (5%) | 523 |
0.742 (1.00) |
0.607 (1.00) |
0.125 (1.00) |
0.819 (1.00) |
0.579 (1.00) |
0.0672 (1.00) |
| 3p loss | 38 (7%) | 515 |
0.26 (1.00) |
0.0373 (1.00) |
0.734 (1.00) |
0.767 (1.00) |
0.552 (1.00) |
0.0442 (1.00) |
| 3q loss | 32 (6%) | 521 |
0.704 (1.00) |
0.42 (1.00) |
0.456 (1.00) |
0.908 (1.00) |
1 (1.00) |
0.326 (1.00) |
| 4p loss | 52 (9%) | 501 |
0.614 (1.00) |
0.475 (1.00) |
0.233 (1.00) |
0.449 (1.00) |
0.302 (1.00) |
0.637 (1.00) |
| 4q loss | 53 (10%) | 500 |
0.229 (1.00) |
0.187 (1.00) |
0.883 (1.00) |
0.188 (1.00) |
0.766 (1.00) |
0.756 (1.00) |
| 5p loss | 42 (8%) | 511 |
0.0463 (1.00) |
0.342 (1.00) |
1 (1.00) |
0.811 (1.00) |
1 (1.00) |
0.0379 (1.00) |
| 5q loss | 43 (8%) | 510 |
0.0912 (1.00) |
0.312 (1.00) |
1 (1.00) |
0.972 (1.00) |
0.592 (1.00) |
0.17 (1.00) |
| 6p loss | 83 (15%) | 470 |
0.0119 (1.00) |
0.451 (1.00) |
0.626 (1.00) |
0.529 (1.00) |
0.347 (1.00) |
0.797 (1.00) |
| 6q loss | 119 (22%) | 434 |
0.387 (1.00) |
0.72 (1.00) |
0.291 (1.00) |
0.392 (1.00) |
0.206 (1.00) |
0.738 (1.00) |
| 7p loss | 8 (1%) | 545 |
0.372 (1.00) |
0.153 (1.00) |
1 (1.00) |
0.628 (1.00) |
1 (1.00) |
0.445 (1.00) |
| 7q loss | 6 (1%) | 547 |
0.544 (1.00) |
0.0995 (1.00) |
1 (1.00) |
0.22 (1.00) |
1 (1.00) |
0.672 (1.00) |
| 8p loss | 58 (10%) | 495 |
0.628 (1.00) |
0.189 (1.00) |
0.157 (1.00) |
0.789 (1.00) |
0.886 (1.00) |
0.653 (1.00) |
| 8q loss | 42 (8%) | 511 |
0.23 (1.00) |
0.0748 (1.00) |
0.418 (1.00) |
0.508 (1.00) |
0.839 (1.00) |
1 (1.00) |
| 9p loss | 190 (34%) | 363 |
0.32 (1.00) |
0.568 (1.00) |
0.583 (1.00) |
0.975 (1.00) |
0.856 (1.00) |
0.498 (1.00) |
| 9q loss | 85 (15%) | 468 |
0.388 (1.00) |
0.558 (1.00) |
0.28 (1.00) |
0.517 (1.00) |
0.914 (1.00) |
0.611 (1.00) |
| 11p loss | 95 (17%) | 458 |
0.159 (1.00) |
0.889 (1.00) |
0.0508 (1.00) |
0.59 (1.00) |
0.404 (1.00) |
0.543 (1.00) |
| 11q loss | 89 (16%) | 464 |
0.865 (1.00) |
0.158 (1.00) |
0.407 (1.00) |
0.981 (1.00) |
1 (1.00) |
0.263 (1.00) |
| 12p loss | 59 (11%) | 494 |
0.976 (1.00) |
0.632 (1.00) |
0.4 (1.00) |
0.655 (1.00) |
0.886 (1.00) |
0.554 (1.00) |
| 12q loss | 57 (10%) | 496 |
0.866 (1.00) |
0.639 (1.00) |
0.567 (1.00) |
0.498 (1.00) |
0.886 (1.00) |
0.881 (1.00) |
| 13q loss | 180 (33%) | 373 |
0.965 (1.00) |
0.772 (1.00) |
0.853 (1.00) |
0.655 (1.00) |
0.687 (1.00) |
0.556 (1.00) |
| 14q loss | 140 (25%) | 413 |
0.759 (1.00) |
0.965 (1.00) |
0.484 (1.00) |
0.494 (1.00) |
0.11 (1.00) |
0.673 (1.00) |
| 15q loss | 99 (18%) | 454 |
0.729 (1.00) |
0.167 (1.00) |
0.498 (1.00) |
0.425 (1.00) |
0.286 (1.00) |
0.0925 (1.00) |
| 16p loss | 62 (11%) | 491 |
0.0888 (1.00) |
0.491 (1.00) |
0.783 (1.00) |
0.994 (1.00) |
0.235 (1.00) |
0.0574 (1.00) |
| 16q loss | 80 (14%) | 473 |
0.0407 (1.00) |
0.756 (1.00) |
1 (1.00) |
0.744 (1.00) |
0.368 (1.00) |
0.0363 (1.00) |
| 17p loss | 61 (11%) | 492 |
0.873 (1.00) |
0.474 (1.00) |
0.271 (1.00) |
0.88 (1.00) |
0.887 (1.00) |
0.143 (1.00) |
| 17q loss | 40 (7%) | 513 |
0.903 (1.00) |
0.448 (1.00) |
0.503 (1.00) |
0.552 (1.00) |
0.829 (1.00) |
0.0216 (1.00) |
| 18p loss | 67 (12%) | 486 |
0.179 (1.00) |
0.822 (1.00) |
0.594 (1.00) |
0.475 (1.00) |
0.798 (1.00) |
0.889 (1.00) |
| 18q loss | 60 (11%) | 493 |
0.237 (1.00) |
0.972 (1.00) |
0.89 (1.00) |
0.191 (1.00) |
0.886 (1.00) |
0.304 (1.00) |
| 19p loss | 26 (5%) | 527 |
0.628 (1.00) |
0.54 (1.00) |
0.838 (1.00) |
0.795 (1.00) |
0.515 (1.00) |
0.668 (1.00) |
| 19q loss | 34 (6%) | 519 |
0.628 (1.00) |
0.552 (1.00) |
1 (1.00) |
0.79 (1.00) |
0.277 (1.00) |
0.85 (1.00) |
| 20p loss | 18 (3%) | 535 |
0.901 (1.00) |
0.273 (1.00) |
0.219 (1.00) |
0.714 (1.00) |
1 (1.00) |
0.8 (1.00) |
| 20q loss | 16 (3%) | 537 |
0.807 (1.00) |
0.656 (1.00) |
0.197 (1.00) |
0.846 (1.00) |
1 (1.00) |
0.588 (1.00) |
| 21q loss | 40 (7%) | 513 |
0.919 (1.00) |
0.639 (1.00) |
0.503 (1.00) |
0.175 (1.00) |
1 (1.00) |
0.376 (1.00) |
| 22q loss | 172 (31%) | 381 |
0.46 (1.00) |
0.153 (1.00) |
1 (1.00) |
0.495 (1.00) |
0.85 (1.00) |
1 (1.00) |
| xq loss | 102 (18%) | 451 |
0.114 (1.00) |
0.373 (1.00) |
0.575 (1.00) |
0.35 (1.00) |
0.297 (1.00) |
0.477 (1.00) |
P value = 9.02e-05 (logrank test), Q value = 0.043
Table S1. Gene #13: '7p gain' versus Clinical Feature #1: 'Time to Death'
| nPatients | nDeath | Duration Range (Median), Month | |
|---|---|---|---|
| ALL | 553 | 445 | 0.1 - 127.6 (9.9) |
| 7P GAIN MUTATED | 449 | 368 | 0.1 - 127.6 (9.6) |
| 7P GAIN WILD-TYPE | 104 | 77 | 0.2 - 108.8 (13.0) |
Figure S1. Get High-res Image Gene #13: '7p gain' versus Clinical Feature #1: 'Time to Death'
P value = 1.45e-06 (t-test), Q value = 0.00069
Table S2. Gene #13: '7p gain' versus Clinical Feature #2: 'AGE'
| nPatients | Mean (Std.Dev) | |
|---|---|---|
| ALL | 553 | 57.8 (14.4) |
| 7P GAIN MUTATED | 449 | 59.7 (12.4) |
| 7P GAIN WILD-TYPE | 104 | 49.7 (19.2) |
Figure S2. Get High-res Image Gene #13: '7p gain' versus Clinical Feature #2: 'AGE'

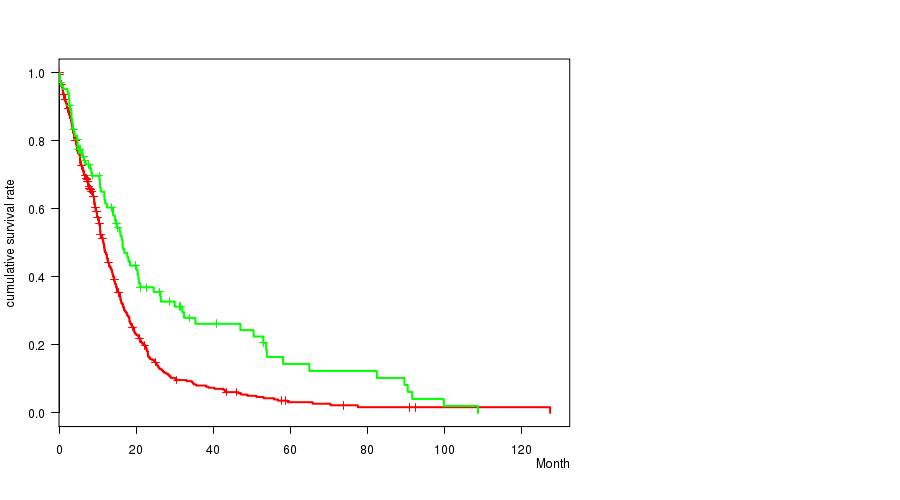
P value = 0.000226 (logrank test), Q value = 0.11
Table S3. Gene #14: '7q gain' versus Clinical Feature #1: 'Time to Death'
| nPatients | nDeath | Duration Range (Median), Month | |
|---|---|---|---|
| ALL | 553 | 445 | 0.1 - 127.6 (9.9) |
| 7Q GAIN MUTATED | 453 | 369 | 0.1 - 127.6 (9.6) |
| 7Q GAIN WILD-TYPE | 100 | 76 | 0.2 - 108.8 (13.8) |
Figure S3. Get High-res Image Gene #14: '7q gain' versus Clinical Feature #1: 'Time to Death'
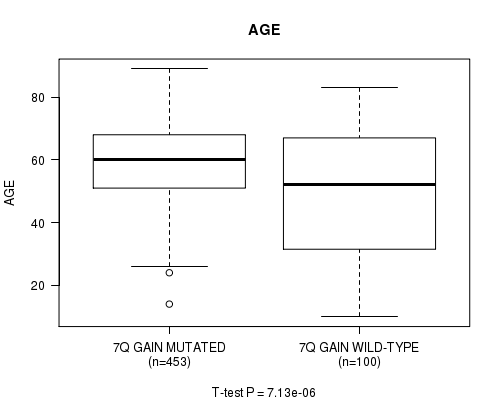
P value = 7.13e-06 (t-test), Q value = 0.0034
Table S4. Gene #14: '7q gain' versus Clinical Feature #2: 'AGE'
| nPatients | Mean (Std.Dev) | |
|---|---|---|
| ALL | 553 | 57.8 (14.4) |
| 7Q GAIN MUTATED | 453 | 59.6 (12.2) |
| 7Q GAIN WILD-TYPE | 100 | 49.8 (20.1) |
Figure S4. Get High-res Image Gene #14: '7q gain' versus Clinical Feature #2: 'AGE'
P value = 0.00032 (t-test), Q value = 0.15
Table S5. Gene #19: '10p gain' versus Clinical Feature #4: 'KARNOFSKY.PERFORMANCE.SCORE'
| nPatients | Mean (Std.Dev) | |
|---|---|---|
| ALL | 408 | 77.4 (14.7) |
| 10P GAIN MUTATED | 11 | 80.0 (0.0) |
| 10P GAIN WILD-TYPE | 397 | 77.3 (14.9) |
Figure S5. Get High-res Image Gene #19: '10p gain' versus Clinical Feature #4: 'KARNOFSKY.PERFORMANCE.SCORE'

P value = 3.69e-05 (t-test), Q value = 0.017
Table S6. Gene #36: '20p gain' versus Clinical Feature #2: 'AGE'
| nPatients | Mean (Std.Dev) | |
|---|---|---|
| ALL | 553 | 57.8 (14.4) |
| 20P GAIN MUTATED | 214 | 60.9 (13.0) |
| 20P GAIN WILD-TYPE | 339 | 55.9 (15.0) |
Figure S6. Get High-res Image Gene #36: '20p gain' versus Clinical Feature #2: 'AGE'

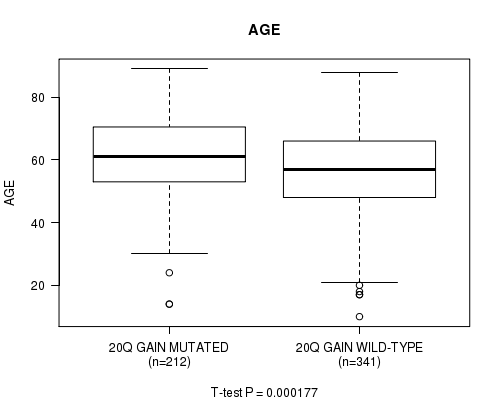
P value = 0.000177 (t-test), Q value = 0.083
Table S7. Gene #37: '20q gain' versus Clinical Feature #2: 'AGE'
| nPatients | Mean (Std.Dev) | |
|---|---|---|
| ALL | 553 | 57.8 (14.4) |
| 20Q GAIN MUTATED | 212 | 60.7 (13.3) |
| 20Q GAIN WILD-TYPE | 341 | 56.1 (14.9) |
Figure S7. Get High-res Image Gene #37: '20q gain' versus Clinical Feature #2: 'AGE'
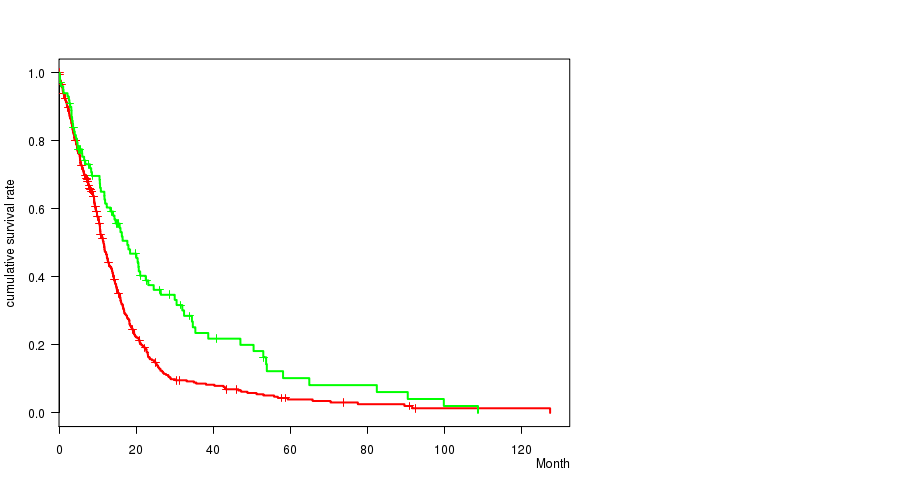
P value = 2.48e-05 (logrank test), Q value = 0.012
Table S8. Gene #59: '10p loss' versus Clinical Feature #1: 'Time to Death'
| nPatients | nDeath | Duration Range (Median), Month | |
|---|---|---|---|
| ALL | 553 | 445 | 0.1 - 127.6 (9.9) |
| 10P LOSS MUTATED | 461 | 376 | 0.1 - 127.6 (9.8) |
| 10P LOSS WILD-TYPE | 92 | 69 | 0.2 - 108.8 (12.5) |
Figure S8. Get High-res Image Gene #59: '10p loss' versus Clinical Feature #1: 'Time to Death'

P value = 1.41e-07 (t-test), Q value = 6.8e-05
Table S9. Gene #59: '10p loss' versus Clinical Feature #2: 'AGE'
| nPatients | Mean (Std.Dev) | |
|---|---|---|
| ALL | 553 | 57.8 (14.4) |
| 10P LOSS MUTATED | 461 | 59.7 (12.5) |
| 10P LOSS WILD-TYPE | 92 | 48.2 (18.9) |
Figure S9. Get High-res Image Gene #59: '10p loss' versus Clinical Feature #2: 'AGE'

P value = 6.88e-05 (logrank test), Q value = 0.033
Table S10. Gene #60: '10q loss' versus Clinical Feature #1: 'Time to Death'
| nPatients | nDeath | Duration Range (Median), Month | |
|---|---|---|---|
| ALL | 553 | 445 | 0.1 - 127.6 (9.9) |
| 10Q LOSS MUTATED | 472 | 385 | 0.1 - 127.6 (9.8) |
| 10Q LOSS WILD-TYPE | 81 | 60 | 0.2 - 108.8 (12.0) |
Figure S10. Get High-res Image Gene #60: '10q loss' versus Clinical Feature #1: 'Time to Death'

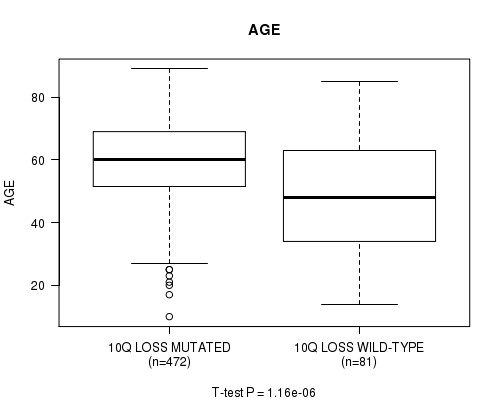
P value = 1.16e-06 (t-test), Q value = 0.00055
Table S11. Gene #60: '10q loss' versus Clinical Feature #2: 'AGE'
| nPatients | Mean (Std.Dev) | |
|---|---|---|
| ALL | 553 | 57.8 (14.4) |
| 10Q LOSS MUTATED | 472 | 59.5 (12.9) |
| 10Q LOSS WILD-TYPE | 81 | 48.3 (18.6) |
Figure S11. Get High-res Image Gene #60: '10q loss' versus Clinical Feature #2: 'AGE'
-
Copy number data file = transformed.cor.cli.txt
-
Clinical data file = GBM-TP.merged_data.txt
-
Number of patients = 553
-
Number of significantly arm-level cnvs = 80
-
Number of selected clinical features = 6
-
Exclude regions that fewer than K tumors have mutations, K = 3
For survival clinical features, the Kaplan-Meier survival curves of tumors with and without gene mutations were plotted and the statistical significance P values were estimated by logrank test (Bland and Altman 2004) using the 'survdiff' function in R
For continuous numerical clinical features, two-tailed Student's t test with unequal variance (Lehmann and Romano 2005) was applied to compare the clinical values between tumors with and without gene mutations using 't.test' function in R
For binary or multi-class clinical features (nominal or ordinal), two-tailed Fisher's exact tests (Fisher 1922) were used to estimate the P values using the 'fisher.test' function in R
For multiple hypothesis correction, Q value is the False Discovery Rate (FDR) analogue of the P value (Benjamini and Hochberg 1995), defined as the minimum FDR at which the test may be called significant. We used the 'Benjamini and Hochberg' method of 'p.adjust' function in R to convert P values into Q values.
In addition to the links below, the full results of the analysis summarized in this report can also be downloaded programmatically using firehose_get, or interactively from either the Broad GDAC website or TCGA Data Coordination Center Portal.