This pipeline computes the correlation between significant copy number variation (cnv focal) genes and selected clinical features.
Testing the association between copy number variation 68 focal events and 6 clinical features across 553 patients, 18 significant findings detected with Q value < 0.25.
-
amp_7p11.2 cnv correlated to 'Time to Death' and 'AGE'.
-
amp_7q11.21 cnv correlated to 'Time to Death' and 'AGE'.
-
amp_7q21.2 cnv correlated to 'Time to Death' and 'AGE'.
-
amp_7q31.2 cnv correlated to 'AGE'.
-
del_9p21.3 cnv correlated to 'AGE'.
-
del_10p15.3 cnv correlated to 'Time to Death' and 'AGE'.
-
del_10p13 cnv correlated to 'Time to Death' and 'AGE'.
-
del_10p11.23 cnv correlated to 'Time to Death', 'AGE', and 'HISTOLOGICAL.TYPE'.
-
del_10q23.31 cnv correlated to 'Time to Death' and 'AGE'.
-
del_10q26.3 cnv correlated to 'AGE'.
Table 1. Get Full Table Overview of the association between significant copy number variation of 68 focal events and 6 clinical features. Shown in the table are P values (Q values). Thresholded by Q value < 0.25, 18 significant findings detected.
|
Clinical Features |
Time to Death |
AGE | GENDER |
KARNOFSKY PERFORMANCE SCORE |
HISTOLOGICAL TYPE |
RADIATIONS RADIATION REGIMENINDICATION |
||
| nCNV (%) | nWild-Type | logrank test | t-test | Fisher's exact test | t-test | Fisher's exact test | Fisher's exact test | |
| del 10p11 23 | 455 (82%) | 98 |
9.13e-08 (3.69e-05) |
1.06e-08 (4.33e-06) |
0.171 (1.00) |
0.244 (1.00) |
0.000576 (0.225) |
0.81 (1.00) |
| amp 7p11 2 | 485 (88%) | 68 |
3.9e-07 (0.000157) |
1.4e-09 (5.72e-07) |
0.428 (1.00) |
0.0373 (1.00) |
0.0194 (1.00) |
0.0949 (1.00) |
| amp 7q11 21 | 444 (80%) | 109 |
2.87e-05 (0.0114) |
5.93e-08 (2.4e-05) |
0.276 (1.00) |
0.679 (1.00) |
0.00207 (0.804) |
0.133 (1.00) |
| amp 7q21 2 | 458 (83%) | 95 |
0.000303 (0.119) |
9.4e-06 (0.00374) |
0.566 (1.00) |
0.491 (1.00) |
0.0207 (1.00) |
0.223 (1.00) |
| del 10p15 3 | 449 (81%) | 104 |
1.91e-06 (0.000765) |
3.76e-08 (1.53e-05) |
0.121 (1.00) |
0.617 (1.00) |
0.00306 (1.00) |
0.64 (1.00) |
| del 10p13 | 451 (82%) | 102 |
1.27e-06 (0.000508) |
1.82e-07 (7.33e-05) |
0.0564 (1.00) |
0.86 (1.00) |
0.00228 (0.883) |
0.906 (1.00) |
| del 10q23 31 | 491 (89%) | 62 |
1.08e-05 (0.00429) |
6.33e-06 (0.00253) |
0.681 (1.00) |
0.0789 (1.00) |
0.00239 (0.922) |
1 (1.00) |
| amp 7q31 2 | 451 (82%) | 102 |
0.0039 (1.00) |
0.000444 (0.174) |
0.433 (1.00) |
0.721 (1.00) |
0.0222 (1.00) |
0.0764 (1.00) |
| del 9p21 3 | 402 (73%) | 151 |
0.023 (1.00) |
0.000304 (0.119) |
0.558 (1.00) |
0.096 (1.00) |
0.176 (1.00) |
0.471 (1.00) |
| del 10q26 3 | 492 (89%) | 61 |
0.00133 (0.517) |
5.9e-05 (0.0233) |
0.582 (1.00) |
0.0647 (1.00) |
0.006 (1.00) |
1 (1.00) |
| amp 1p36 21 | 91 (16%) | 462 |
0.0364 (1.00) |
0.226 (1.00) |
0.483 (1.00) |
0.423 (1.00) |
0.208 (1.00) |
1 (1.00) |
| amp 1q32 1 | 152 (27%) | 401 |
0.506 (1.00) |
0.202 (1.00) |
0.846 (1.00) |
0.273 (1.00) |
0.554 (1.00) |
0.757 (1.00) |
| amp 1q44 | 97 (18%) | 456 |
0.298 (1.00) |
0.939 (1.00) |
0.304 (1.00) |
0.598 (1.00) |
0.447 (1.00) |
0.717 (1.00) |
| amp 2p24 3 | 48 (9%) | 505 |
0.308 (1.00) |
0.24 (1.00) |
0.357 (1.00) |
0.929 (1.00) |
0.867 (1.00) |
0.871 (1.00) |
| amp 3q26 33 | 108 (20%) | 445 |
0.16 (1.00) |
0.0116 (1.00) |
0.585 (1.00) |
0.888 (1.00) |
0.0184 (1.00) |
0.728 (1.00) |
| amp 4p16 3 | 47 (8%) | 506 |
0.981 (1.00) |
0.723 (1.00) |
0.28 (1.00) |
0.439 (1.00) |
1 (1.00) |
0.742 (1.00) |
| amp 4q12 | 104 (19%) | 449 |
0.338 (1.00) |
0.342 (1.00) |
0.436 (1.00) |
0.737 (1.00) |
0.281 (1.00) |
0.289 (1.00) |
| amp 8q24 21 | 68 (12%) | 485 |
0.414 (1.00) |
0.183 (1.00) |
0.428 (1.00) |
0.895 (1.00) |
0.719 (1.00) |
0.781 (1.00) |
| amp 11p13 | 29 (5%) | 524 |
0.971 (1.00) |
0.435 (1.00) |
0.847 (1.00) |
0.691 (1.00) |
0.564 (1.00) |
1 (1.00) |
| amp 12p13 32 | 82 (15%) | 471 |
0.811 (1.00) |
0.0917 (1.00) |
1 (1.00) |
0.99 (1.00) |
1 (1.00) |
0.606 (1.00) |
| amp 12q14 1 | 131 (24%) | 422 |
0.423 (1.00) |
0.521 (1.00) |
0.413 (1.00) |
0.687 (1.00) |
0.878 (1.00) |
1 (1.00) |
| amp 12q15 | 91 (16%) | 462 |
0.807 (1.00) |
0.664 (1.00) |
0.412 (1.00) |
0.762 (1.00) |
0.769 (1.00) |
0.385 (1.00) |
| amp 13q34 | 31 (6%) | 522 |
0.803 (1.00) |
0.639 (1.00) |
0.454 (1.00) |
0.858 (1.00) |
0.345 (1.00) |
0.69 (1.00) |
| amp 14q32 33 | 36 (7%) | 517 |
0.401 (1.00) |
0.0205 (1.00) |
0.485 (1.00) |
0.276 (1.00) |
0.0782 (1.00) |
1 (1.00) |
| amp 17p13 2 | 48 (9%) | 505 |
0.802 (1.00) |
0.951 (1.00) |
0.164 (1.00) |
0.631 (1.00) |
0.867 (1.00) |
0.744 (1.00) |
| amp 17q25 1 | 79 (14%) | 474 |
0.0355 (1.00) |
0.0251 (1.00) |
0.137 (1.00) |
0.739 (1.00) |
1 (1.00) |
0.694 (1.00) |
| amp 19p13 2 | 239 (43%) | 314 |
0.166 (1.00) |
0.486 (1.00) |
1 (1.00) |
0.47 (1.00) |
0.588 (1.00) |
0.853 (1.00) |
| amp 19q12 | 205 (37%) | 348 |
0.463 (1.00) |
0.298 (1.00) |
0.472 (1.00) |
0.881 (1.00) |
0.815 (1.00) |
0.703 (1.00) |
| amp 21q21 1 | 66 (12%) | 487 |
0.478 (1.00) |
0.00861 (1.00) |
0.79 (1.00) |
0.419 (1.00) |
0.128 (1.00) |
0.479 (1.00) |
| del 1p36 32 | 95 (17%) | 458 |
0.906 (1.00) |
0.72 (1.00) |
0.0374 (1.00) |
0.979 (1.00) |
0.272 (1.00) |
1 (1.00) |
| del 1p36 23 | 131 (24%) | 422 |
0.494 (1.00) |
0.0207 (1.00) |
0.0105 (1.00) |
0.203 (1.00) |
0.185 (1.00) |
0.516 (1.00) |
| del 1p32 3 | 59 (11%) | 494 |
0.712 (1.00) |
0.0493 (1.00) |
0.159 (1.00) |
0.528 (1.00) |
0.776 (1.00) |
0.101 (1.00) |
| del 1p22 1 | 46 (8%) | 507 |
0.45 (1.00) |
0.337 (1.00) |
0.755 (1.00) |
0.576 (1.00) |
0.0948 (1.00) |
0.509 (1.00) |
| del 1q42 11 | 46 (8%) | 507 |
0.0446 (1.00) |
0.0388 (1.00) |
1 (1.00) |
0.0106 (1.00) |
1 (1.00) |
0.243 (1.00) |
| del 1q44 | 32 (6%) | 521 |
0.303 (1.00) |
0.207 (1.00) |
1 (1.00) |
0.0693 (1.00) |
1 (1.00) |
1 (1.00) |
| del 2q22 1 | 43 (8%) | 510 |
0.526 (1.00) |
0.324 (1.00) |
0.333 (1.00) |
0.673 (1.00) |
0.495 (1.00) |
0.122 (1.00) |
| del 2q37 1 | 53 (10%) | 500 |
0.836 (1.00) |
0.342 (1.00) |
0.141 (1.00) |
0.51 (1.00) |
1 (1.00) |
0.275 (1.00) |
| del 3p21 1 | 52 (9%) | 501 |
0.0252 (1.00) |
0.012 (1.00) |
0.883 (1.00) |
0.714 (1.00) |
0.419 (1.00) |
0.0593 (1.00) |
| del 3q13 31 | 55 (10%) | 498 |
0.447 (1.00) |
0.0636 (1.00) |
0.383 (1.00) |
0.316 (1.00) |
0.665 (1.00) |
0.166 (1.00) |
| del 3q22 1 | 55 (10%) | 498 |
0.547 (1.00) |
0.137 (1.00) |
1 (1.00) |
0.503 (1.00) |
0.665 (1.00) |
0.442 (1.00) |
| del 3q29 | 63 (11%) | 490 |
0.214 (1.00) |
0.25 (1.00) |
1 (1.00) |
0.473 (1.00) |
1 (1.00) |
0.246 (1.00) |
| del 4p16 3 | 75 (14%) | 478 |
0.412 (1.00) |
0.0342 (1.00) |
0.256 (1.00) |
0.169 (1.00) |
0.385 (1.00) |
0.107 (1.00) |
| del 4q34 3 | 87 (16%) | 466 |
0.183 (1.00) |
0.142 (1.00) |
0.0556 (1.00) |
0.606 (1.00) |
0.444 (1.00) |
0.1 (1.00) |
| del 5q35 3 | 52 (9%) | 501 |
0.0478 (1.00) |
0.11 (1.00) |
1 (1.00) |
0.606 (1.00) |
1 (1.00) |
0.431 (1.00) |
| del 6q22 31 | 151 (27%) | 402 |
0.0664 (1.00) |
0.252 (1.00) |
0.118 (1.00) |
0.399 (1.00) |
0.0636 (1.00) |
0.758 (1.00) |
| del 6q26 | 172 (31%) | 381 |
0.138 (1.00) |
0.971 (1.00) |
0.26 (1.00) |
0.732 (1.00) |
0.0986 (1.00) |
0.552 (1.00) |
| del 8p23 2 | 64 (12%) | 489 |
0.234 (1.00) |
0.0468 (1.00) |
0.497 (1.00) |
0.55 (1.00) |
0.888 (1.00) |
0.668 (1.00) |
| del 9q34 2 | 72 (13%) | 481 |
0.522 (1.00) |
0.691 (1.00) |
1 (1.00) |
0.493 (1.00) |
0.895 (1.00) |
1 (1.00) |
| del 11p15 5 | 125 (23%) | 428 |
0.0148 (1.00) |
0.00238 (0.922) |
0.177 (1.00) |
0.141 (1.00) |
0.5 (1.00) |
0.743 (1.00) |
| del 11p11 2 | 101 (18%) | 452 |
0.0531 (1.00) |
0.474 (1.00) |
0.177 (1.00) |
0.551 (1.00) |
0.226 (1.00) |
0.905 (1.00) |
| del 11q14 1 | 94 (17%) | 459 |
0.991 (1.00) |
0.776 (1.00) |
0.297 (1.00) |
0.757 (1.00) |
0.399 (1.00) |
0.111 (1.00) |
| del 12p13 1 | 71 (13%) | 482 |
0.135 (1.00) |
0.631 (1.00) |
0.438 (1.00) |
0.448 (1.00) |
0.809 (1.00) |
0.492 (1.00) |
| del 12q12 | 74 (13%) | 479 |
0.459 (1.00) |
0.81 (1.00) |
0.898 (1.00) |
0.89 (1.00) |
1 (1.00) |
0.419 (1.00) |
| del 13q14 2 | 233 (42%) | 320 |
0.709 (1.00) |
0.593 (1.00) |
0.792 (1.00) |
0.789 (1.00) |
0.584 (1.00) |
0.514 (1.00) |
| del 14q13 1 | 170 (31%) | 383 |
0.749 (1.00) |
0.643 (1.00) |
0.157 (1.00) |
0.175 (1.00) |
0.0875 (1.00) |
0.487 (1.00) |
| del 14q24 2 | 166 (30%) | 387 |
0.581 (1.00) |
0.24 (1.00) |
0.298 (1.00) |
0.466 (1.00) |
0.0624 (1.00) |
0.422 (1.00) |
| del 15q14 | 145 (26%) | 408 |
0.31 (1.00) |
0.047 (1.00) |
0.693 (1.00) |
0.491 (1.00) |
0.577 (1.00) |
0.403 (1.00) |
| del 16p12 2 | 89 (16%) | 464 |
0.135 (1.00) |
0.312 (1.00) |
0.239 (1.00) |
0.826 (1.00) |
0.224 (1.00) |
0.534 (1.00) |
| del 16q23 3 | 92 (17%) | 461 |
0.0674 (1.00) |
0.964 (1.00) |
0.56 (1.00) |
0.181 (1.00) |
0.391 (1.00) |
0.0256 (1.00) |
| del 17p13 2 | 82 (15%) | 471 |
0.579 (1.00) |
0.469 (1.00) |
0.272 (1.00) |
0.199 (1.00) |
1 (1.00) |
0.698 (1.00) |
| del 17p13 1 | 92 (17%) | 461 |
0.327 (1.00) |
0.148 (1.00) |
0.0798 (1.00) |
0.819 (1.00) |
1 (1.00) |
0.11 (1.00) |
| del 17q11 2 | 68 (12%) | 485 |
0.19 (1.00) |
0.484 (1.00) |
0.895 (1.00) |
0.238 (1.00) |
1 (1.00) |
0.0677 (1.00) |
| del 18q22 3 | 78 (14%) | 475 |
0.649 (1.00) |
0.606 (1.00) |
0.709 (1.00) |
0.117 (1.00) |
1 (1.00) |
0.793 (1.00) |
| del 19q13 41 | 97 (18%) | 456 |
0.0367 (1.00) |
0.265 (1.00) |
1 (1.00) |
0.253 (1.00) |
0.718 (1.00) |
1 (1.00) |
| del 21q22 3 | 57 (10%) | 496 |
0.449 (1.00) |
0.062 (1.00) |
0.32 (1.00) |
0.0503 (1.00) |
0.886 (1.00) |
0.881 (1.00) |
| del 22q13 32 | 205 (37%) | 348 |
0.863 (1.00) |
0.434 (1.00) |
0.857 (1.00) |
0.477 (1.00) |
0.86 (1.00) |
0.776 (1.00) |
| del xp22 2 | 113 (20%) | 440 |
0.151 (1.00) |
0.276 (1.00) |
0.829 (1.00) |
0.516 (1.00) |
0.804 (1.00) |
0.909 (1.00) |
| del xq23 | 103 (19%) | 450 |
0.0875 (1.00) |
0.999 (1.00) |
0.823 (1.00) |
0.361 (1.00) |
0.277 (1.00) |
0.288 (1.00) |
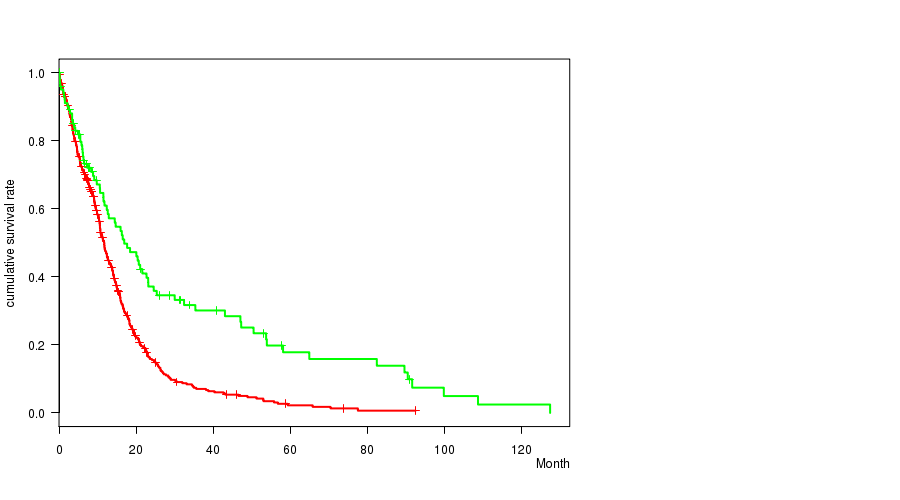
P value = 3.9e-07 (logrank test), Q value = 0.00016
Table S1. Gene #8: 'amp_7p11.2' versus Clinical Feature #1: 'Time to Death'
| nPatients | nDeath | Duration Range (Median), Month | |
|---|---|---|---|
| ALL | 553 | 445 | 0.1 - 127.6 (9.9) |
| AMP PEAK 8(7P11.2) MUTATED | 485 | 398 | 0.1 - 127.6 (9.4) |
| AMP PEAK 8(7P11.2) WILD-TYPE | 68 | 47 | 0.2 - 108.8 (15.1) |
Figure S1. Get High-res Image Gene #8: 'amp_7p11.2' versus Clinical Feature #1: 'Time to Death'

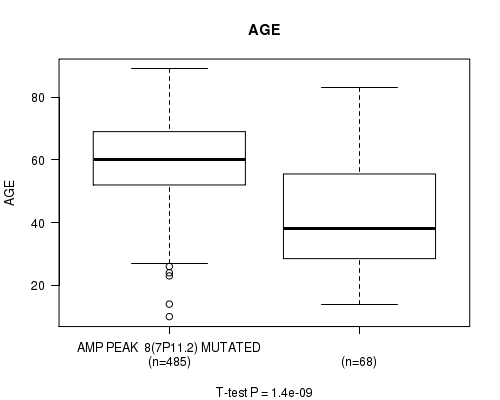
P value = 1.4e-09 (t-test), Q value = 5.7e-07
Table S2. Gene #8: 'amp_7p11.2' versus Clinical Feature #2: 'AGE'
| nPatients | Mean (Std.Dev) | |
|---|---|---|
| ALL | 553 | 57.8 (14.4) |
| AMP PEAK 8(7P11.2) MUTATED | 485 | 59.8 (12.5) |
| AMP PEAK 8(7P11.2) WILD-TYPE | 68 | 43.6 (18.8) |
Figure S2. Get High-res Image Gene #8: 'amp_7p11.2' versus Clinical Feature #2: 'AGE'
P value = 2.87e-05 (logrank test), Q value = 0.011
Table S3. Gene #9: 'amp_7q11.21' versus Clinical Feature #1: 'Time to Death'
| nPatients | nDeath | Duration Range (Median), Month | |
|---|---|---|---|
| ALL | 553 | 445 | 0.1 - 127.6 (9.9) |
| AMP PEAK 9(7Q11.21) MUTATED | 444 | 361 | 0.1 - 127.6 (9.4) |
| AMP PEAK 9(7Q11.21) WILD-TYPE | 109 | 84 | 0.2 - 108.8 (14.0) |
Figure S3. Get High-res Image Gene #9: 'amp_7q11.21' versus Clinical Feature #1: 'Time to Death'

P value = 5.93e-08 (t-test), Q value = 2.4e-05
Table S4. Gene #9: 'amp_7q11.21' versus Clinical Feature #2: 'AGE'
| nPatients | Mean (Std.Dev) | |
|---|---|---|
| ALL | 553 | 57.8 (14.4) |
| AMP PEAK 9(7Q11.21) MUTATED | 444 | 59.9 (12.4) |
| AMP PEAK 9(7Q11.21) WILD-TYPE | 109 | 49.2 (18.4) |
Figure S4. Get High-res Image Gene #9: 'amp_7q11.21' versus Clinical Feature #2: 'AGE'

P value = 0.000303 (logrank test), Q value = 0.12
Table S5. Gene #10: 'amp_7q21.2' versus Clinical Feature #1: 'Time to Death'
| nPatients | nDeath | Duration Range (Median), Month | |
|---|---|---|---|
| ALL | 553 | 445 | 0.1 - 127.6 (9.9) |
| AMP PEAK 10(7Q21.2) MUTATED | 458 | 375 | 0.1 - 127.6 (9.7) |
| AMP PEAK 10(7Q21.2) WILD-TYPE | 95 | 70 | 0.1 - 108.8 (12.4) |
Figure S5. Get High-res Image Gene #10: 'amp_7q21.2' versus Clinical Feature #1: 'Time to Death'

P value = 9.4e-06 (t-test), Q value = 0.0037
Table S6. Gene #10: 'amp_7q21.2' versus Clinical Feature #2: 'AGE'
| nPatients | Mean (Std.Dev) | |
|---|---|---|
| ALL | 553 | 57.8 (14.4) |
| AMP PEAK 10(7Q21.2) MUTATED | 458 | 59.5 (12.5) |
| AMP PEAK 10(7Q21.2) WILD-TYPE | 95 | 49.7 (19.8) |
Figure S6. Get High-res Image Gene #10: 'amp_7q21.2' versus Clinical Feature #2: 'AGE'

P value = 0.000444 (t-test), Q value = 0.17
Table S7. Gene #11: 'amp_7q31.2' versus Clinical Feature #2: 'AGE'
| nPatients | Mean (Std.Dev) | |
|---|---|---|
| ALL | 553 | 57.8 (14.4) |
| AMP PEAK 11(7Q31.2) MUTATED | 451 | 59.2 (12.7) |
| AMP PEAK 11(7Q31.2) WILD-TYPE | 102 | 51.9 (19.5) |
Figure S7. Get High-res Image Gene #11: 'amp_7q31.2' versus Clinical Feature #2: 'AGE'

P value = 0.000304 (t-test), Q value = 0.12
Table S8. Gene #42: 'del_9p21.3' versus Clinical Feature #2: 'AGE'
| nPatients | Mean (Std.Dev) | |
|---|---|---|
| ALL | 553 | 57.8 (14.4) |
| DEL PEAK 19(9P21.3) MUTATED | 402 | 59.3 (13.7) |
| DEL PEAK 19(9P21.3) WILD-TYPE | 151 | 54.0 (15.7) |
Figure S8. Get High-res Image Gene #42: 'del_9p21.3' versus Clinical Feature #2: 'AGE'

P value = 1.91e-06 (logrank test), Q value = 0.00077
Table S9. Gene #44: 'del_10p15.3' versus Clinical Feature #1: 'Time to Death'
| nPatients | nDeath | Duration Range (Median), Month | |
|---|---|---|---|
| ALL | 553 | 445 | 0.1 - 127.6 (9.9) |
| DEL PEAK 21(10P15.3) MUTATED | 449 | 369 | 0.1 - 92.6 (9.8) |
| DEL PEAK 21(10P15.3) WILD-TYPE | 104 | 76 | 0.1 - 127.6 (11.7) |
Figure S9. Get High-res Image Gene #44: 'del_10p15.3' versus Clinical Feature #1: 'Time to Death'

P value = 3.76e-08 (t-test), Q value = 1.5e-05
Table S10. Gene #44: 'del_10p15.3' versus Clinical Feature #2: 'AGE'
| nPatients | Mean (Std.Dev) | |
|---|---|---|
| ALL | 553 | 57.8 (14.4) |
| DEL PEAK 21(10P15.3) MUTATED | 449 | 59.9 (12.5) |
| DEL PEAK 21(10P15.3) WILD-TYPE | 104 | 48.8 (18.5) |
Figure S10. Get High-res Image Gene #44: 'del_10p15.3' versus Clinical Feature #2: 'AGE'

P value = 1.27e-06 (logrank test), Q value = 0.00051
Table S11. Gene #45: 'del_10p13' versus Clinical Feature #1: 'Time to Death'
| nPatients | nDeath | Duration Range (Median), Month | |
|---|---|---|---|
| ALL | 553 | 445 | 0.1 - 127.6 (9.9) |
| DEL PEAK 22(10P13) MUTATED | 451 | 370 | 0.1 - 92.6 (9.9) |
| DEL PEAK 22(10P13) WILD-TYPE | 102 | 75 | 0.1 - 127.6 (11.5) |
Figure S11. Get High-res Image Gene #45: 'del_10p13' versus Clinical Feature #1: 'Time to Death'
P value = 1.82e-07 (t-test), Q value = 7.3e-05
Table S12. Gene #45: 'del_10p13' versus Clinical Feature #2: 'AGE'
| nPatients | Mean (Std.Dev) | |
|---|---|---|
| ALL | 553 | 57.8 (14.4) |
| DEL PEAK 22(10P13) MUTATED | 451 | 59.8 (12.4) |
| DEL PEAK 22(10P13) WILD-TYPE | 102 | 48.9 (19.0) |
Figure S12. Get High-res Image Gene #45: 'del_10p13' versus Clinical Feature #2: 'AGE'

P value = 9.13e-08 (logrank test), Q value = 3.7e-05
Table S13. Gene #46: 'del_10p11.23' versus Clinical Feature #1: 'Time to Death'
| nPatients | nDeath | Duration Range (Median), Month | |
|---|---|---|---|
| ALL | 553 | 445 | 0.1 - 127.6 (9.9) |
| DEL PEAK 23(10P11.23) MUTATED | 455 | 373 | 0.1 - 92.6 (9.7) |
| DEL PEAK 23(10P11.23) WILD-TYPE | 98 | 72 | 0.1 - 127.6 (12.8) |
Figure S13. Get High-res Image Gene #46: 'del_10p11.23' versus Clinical Feature #1: 'Time to Death'

P value = 1.06e-08 (t-test), Q value = 4.3e-06
Table S14. Gene #46: 'del_10p11.23' versus Clinical Feature #2: 'AGE'
| nPatients | Mean (Std.Dev) | |
|---|---|---|
| ALL | 553 | 57.8 (14.4) |
| DEL PEAK 23(10P11.23) MUTATED | 455 | 60.0 (12.3) |
| DEL PEAK 23(10P11.23) WILD-TYPE | 98 | 47.7 (18.9) |
Figure S14. Get High-res Image Gene #46: 'del_10p11.23' versus Clinical Feature #2: 'AGE'

P value = 0.000576 (Fisher's exact test), Q value = 0.23
Table S15. Gene #46: 'del_10p11.23' versus Clinical Feature #5: 'HISTOLOGICAL.TYPE'
| nPatients | GLIOBLASTOMA MULTIFORME (GBM) | TREATED PRIMARY GBM | UNTREATED PRIMARY (DE NOVO) GBM |
|---|---|---|---|
| ALL | 10 | 18 | 525 |
| DEL PEAK 23(10P11.23) MUTATED | 5 | 10 | 440 |
| DEL PEAK 23(10P11.23) WILD-TYPE | 5 | 8 | 85 |
Figure S15. Get High-res Image Gene #46: 'del_10p11.23' versus Clinical Feature #5: 'HISTOLOGICAL.TYPE'

P value = 1.08e-05 (logrank test), Q value = 0.0043
Table S16. Gene #47: 'del_10q23.31' versus Clinical Feature #1: 'Time to Death'
| nPatients | nDeath | Duration Range (Median), Month | |
|---|---|---|---|
| ALL | 553 | 445 | 0.1 - 127.6 (9.9) |
| DEL PEAK 24(10Q23.31) MUTATED | 491 | 401 | 0.1 - 127.6 (9.9) |
| DEL PEAK 24(10Q23.31) WILD-TYPE | 62 | 44 | 0.2 - 108.8 (12.5) |
Figure S16. Get High-res Image Gene #47: 'del_10q23.31' versus Clinical Feature #1: 'Time to Death'

P value = 6.33e-06 (t-test), Q value = 0.0025
Table S17. Gene #47: 'del_10q23.31' versus Clinical Feature #2: 'AGE'
| nPatients | Mean (Std.Dev) | |
|---|---|---|
| ALL | 553 | 57.8 (14.4) |
| DEL PEAK 24(10Q23.31) MUTATED | 491 | 59.2 (13.2) |
| DEL PEAK 24(10Q23.31) WILD-TYPE | 62 | 47.2 (18.7) |
Figure S17. Get High-res Image Gene #47: 'del_10q23.31' versus Clinical Feature #2: 'AGE'

P value = 5.9e-05 (t-test), Q value = 0.023
Table S18. Gene #48: 'del_10q26.3' versus Clinical Feature #2: 'AGE'
| nPatients | Mean (Std.Dev) | |
|---|---|---|
| ALL | 553 | 57.8 (14.4) |
| DEL PEAK 25(10Q26.3) MUTATED | 492 | 59.0 (13.4) |
| DEL PEAK 25(10Q26.3) WILD-TYPE | 61 | 48.3 (18.9) |
Figure S18. Get High-res Image Gene #48: 'del_10q26.3' versus Clinical Feature #2: 'AGE'

-
Copy number data file = transformed.cor.cli.txt
-
Clinical data file = GBM-TP.merged_data.txt
-
Number of patients = 553
-
Number of significantly focal cnvs = 68
-
Number of selected clinical features = 6
-
Exclude genes that fewer than K tumors have mutations, K = 3
For survival clinical features, the Kaplan-Meier survival curves of tumors with and without gene mutations were plotted and the statistical significance P values were estimated by logrank test (Bland and Altman 2004) using the 'survdiff' function in R
For continuous numerical clinical features, two-tailed Student's t test with unequal variance (Lehmann and Romano 2005) was applied to compare the clinical values between tumors with and without gene mutations using 't.test' function in R
For binary or multi-class clinical features (nominal or ordinal), two-tailed Fisher's exact tests (Fisher 1922) were used to estimate the P values using the 'fisher.test' function in R
For multiple hypothesis correction, Q value is the False Discovery Rate (FDR) analogue of the P value (Benjamini and Hochberg 1995), defined as the minimum FDR at which the test may be called significant. We used the 'Benjamini and Hochberg' method of 'p.adjust' function in R to convert P values into Q values.
In addition to the links below, the full results of the analysis summarized in this report can also be downloaded programmatically using firehose_get, or interactively from either the Broad GDAC website or TCGA Data Coordination Center Portal.