This pipeline computes the correlation between significant arm-level copy number variations (cnvs) and selected clinical features.
Testing the association between copy number variation 61 arm-level events and 10 clinical features across 66 patients, 5 significant findings detected with Q value < 0.25.
-
16p loss cnv correlated to 'Time to Death', 'NEOPLASM.DISEASESTAGE', and 'PATHOLOGY.N.STAGE'.
-
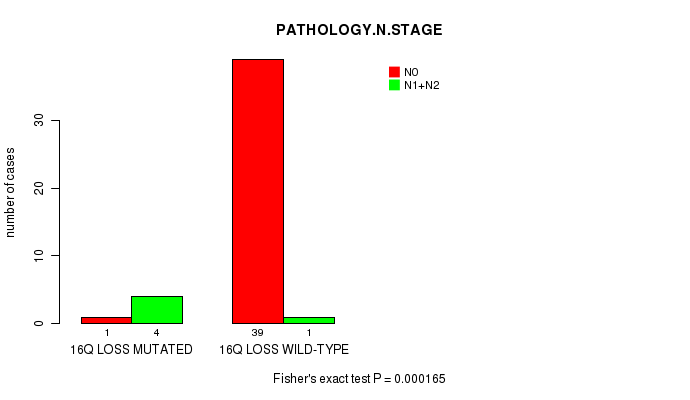
16q loss cnv correlated to 'Time to Death' and 'PATHOLOGY.N.STAGE'.
Table 1. Get Full Table Overview of the association between significant copy number variation of 61 arm-level events and 10 clinical features. Shown in the table are P values (Q values). Thresholded by Q value < 0.25, 5 significant findings detected.
|
Clinical Features |
Time to Death |
AGE |
NEOPLASM DISEASESTAGE |
PATHOLOGY T STAGE |
PATHOLOGY N STAGE |
PATHOLOGY M STAGE |
GENDER |
KARNOFSKY PERFORMANCE SCORE |
NUMBERPACKYEARSSMOKED | YEAROFTOBACCOSMOKINGONSET | ||
| nCNV (%) | nWild-Type | logrank test | t-test | Fisher's exact test | Fisher's exact test | Fisher's exact test | Fisher's exact test | Fisher's exact test | t-test | t-test | t-test | |
| 16p loss | 4 (6%) | 62 |
6.42e-09 (3.2e-06) |
0.503 (1.00) |
0.000409 (0.203) |
0.00672 (1.00) |
3.36e-05 (0.0167) |
0.639 (1.00) |
||||
| 16q loss | 5 (8%) | 61 |
4.22e-09 (2.11e-06) |
0.218 (1.00) |
0.00439 (1.00) |
0.0483 (1.00) |
0.000165 (0.0816) |
0.641 (1.00) |
||||
| 3p gain | 8 (12%) | 58 |
0.00672 (1.00) |
0.0756 (1.00) |
0.0158 (1.00) |
0.465 (1.00) |
0.0327 (1.00) |
0.254 (1.00) |
0.128 (1.00) |
|||
| 3q gain | 8 (12%) | 58 |
0.00672 (1.00) |
0.0756 (1.00) |
0.0158 (1.00) |
0.465 (1.00) |
0.0327 (1.00) |
0.254 (1.00) |
0.128 (1.00) |
|||
| 4p gain | 24 (36%) | 42 |
0.674 (1.00) |
0.204 (1.00) |
0.141 (1.00) |
0.809 (1.00) |
1 (1.00) |
0.112 (1.00) |
1 (1.00) |
0.863 (1.00) |
0.0352 (1.00) |
0.0084 (1.00) |
| 4q gain | 24 (36%) | 42 |
0.674 (1.00) |
0.204 (1.00) |
0.141 (1.00) |
0.809 (1.00) |
1 (1.00) |
0.112 (1.00) |
1 (1.00) |
0.863 (1.00) |
0.0352 (1.00) |
0.0084 (1.00) |
| 5p gain | 8 (12%) | 58 |
0.00174 (0.857) |
0.0627 (1.00) |
0.00152 (0.751) |
0.364 (1.00) |
0.0874 (1.00) |
0.00803 (1.00) |
0.455 (1.00) |
|||
| 5q gain | 8 (12%) | 58 |
0.00174 (0.857) |
0.0627 (1.00) |
0.00152 (0.751) |
0.364 (1.00) |
0.0874 (1.00) |
0.00803 (1.00) |
0.455 (1.00) |
|||
| 7p gain | 24 (36%) | 42 |
0.0663 (1.00) |
0.162 (1.00) |
0.361 (1.00) |
0.691 (1.00) |
0.636 (1.00) |
0.112 (1.00) |
0.195 (1.00) |
0.863 (1.00) |
0.776 (1.00) |
0.0341 (1.00) |
| 7q gain | 24 (36%) | 42 |
0.0663 (1.00) |
0.162 (1.00) |
0.361 (1.00) |
0.691 (1.00) |
0.636 (1.00) |
0.112 (1.00) |
0.195 (1.00) |
0.863 (1.00) |
0.776 (1.00) |
0.0341 (1.00) |
| 8p gain | 17 (26%) | 49 |
0.959 (1.00) |
0.151 (1.00) |
0.389 (1.00) |
0.408 (1.00) |
1 (1.00) |
0.664 (1.00) |
0.776 (1.00) |
0.863 (1.00) |
0.516 (1.00) |
|
| 8q gain | 18 (27%) | 48 |
0.959 (1.00) |
0.161 (1.00) |
0.228 (1.00) |
0.447 (1.00) |
1 (1.00) |
0.123 (1.00) |
0.577 (1.00) |
0.863 (1.00) |
0.516 (1.00) |
|
| 9p gain | 10 (15%) | 56 |
0.511 (1.00) |
0.893 (1.00) |
0.122 (1.00) |
0.194 (1.00) |
0.306 (1.00) |
1 (1.00) |
1 (1.00) |
0.708 (1.00) |
||
| 9q gain | 10 (15%) | 56 |
0.511 (1.00) |
0.893 (1.00) |
0.122 (1.00) |
0.194 (1.00) |
0.306 (1.00) |
1 (1.00) |
1 (1.00) |
0.708 (1.00) |
||
| 10p gain | 4 (6%) | 62 |
0.641 (1.00) |
0.286 (1.00) |
0.269 (1.00) |
0.454 (1.00) |
1 (1.00) |
|||||
| 11p gain | 15 (23%) | 51 |
0.82 (1.00) |
0.676 (1.00) |
0.741 (1.00) |
0.811 (1.00) |
0.617 (1.00) |
0.384 (1.00) |
1 (1.00) |
0.0352 (1.00) |
0.0084 (1.00) |
|
| 11q gain | 15 (23%) | 51 |
0.573 (1.00) |
0.945 (1.00) |
0.741 (1.00) |
0.811 (1.00) |
1 (1.00) |
0.384 (1.00) |
1 (1.00) |
0.0352 (1.00) |
0.0084 (1.00) |
|
| 12p gain | 19 (29%) | 47 |
0.926 (1.00) |
0.01 (1.00) |
0.0768 (1.00) |
0.317 (1.00) |
1 (1.00) |
0.135 (1.00) |
0.412 (1.00) |
0.863 (1.00) |
0.576 (1.00) |
|
| 12q gain | 20 (30%) | 46 |
0.437 (1.00) |
0.0506 (1.00) |
0.111 (1.00) |
0.709 (1.00) |
0.33 (1.00) |
0.135 (1.00) |
0.593 (1.00) |
0.863 (1.00) |
0.291 (1.00) |
0.0084 (1.00) |
| 14q gain | 21 (32%) | 45 |
0.622 (1.00) |
0.112 (1.00) |
0.0969 (1.00) |
0.381 (1.00) |
1 (1.00) |
0.155 (1.00) |
0.794 (1.00) |
0.863 (1.00) |
0.291 (1.00) |
0.0084 (1.00) |
| 15q gain | 21 (32%) | 45 |
0.206 (1.00) |
0.349 (1.00) |
0.412 (1.00) |
0.479 (1.00) |
0.35 (1.00) |
0.155 (1.00) |
0.794 (1.00) |
0.863 (1.00) |
0.555 (1.00) |
0.161 (1.00) |
| 16p gain | 21 (32%) | 45 |
0.296 (1.00) |
0.957 (1.00) |
0.476 (1.00) |
0.403 (1.00) |
0.635 (1.00) |
0.724 (1.00) |
1 (1.00) |
0.863 (1.00) |
0.0352 (1.00) |
0.0084 (1.00) |
| 16q gain | 21 (32%) | 45 |
0.296 (1.00) |
0.957 (1.00) |
0.476 (1.00) |
0.403 (1.00) |
0.635 (1.00) |
0.724 (1.00) |
1 (1.00) |
0.863 (1.00) |
0.0352 (1.00) |
0.0084 (1.00) |
| 18p gain | 17 (26%) | 49 |
0.968 (1.00) |
0.299 (1.00) |
0.291 (1.00) |
0.433 (1.00) |
0.303 (1.00) |
0.505 (1.00) |
0.776 (1.00) |
0.449 (1.00) |
||
| 18q gain | 16 (24%) | 50 |
0.44 (1.00) |
0.56 (1.00) |
0.31 (1.00) |
0.2 (1.00) |
0.303 (1.00) |
0.505 (1.00) |
1 (1.00) |
0.449 (1.00) |
||
| 19p gain | 19 (29%) | 47 |
0.00754 (1.00) |
0.0226 (1.00) |
0.0157 (1.00) |
0.521 (1.00) |
0.00246 (1.00) |
0.0824 (1.00) |
0.412 (1.00) |
0.776 (1.00) |
0.0341 (1.00) |
|
| 19q gain | 17 (26%) | 49 |
0.0557 (1.00) |
0.0104 (1.00) |
0.295 (1.00) |
0.644 (1.00) |
0.136 (1.00) |
0.0617 (1.00) |
0.776 (1.00) |
0.555 (1.00) |
0.161 (1.00) |
|
| 20p gain | 20 (30%) | 46 |
0.602 (1.00) |
0.135 (1.00) |
0.368 (1.00) |
0.793 (1.00) |
0.35 (1.00) |
0.708 (1.00) |
0.593 (1.00) |
0.863 (1.00) |
0.291 (1.00) |
0.0084 (1.00) |
| 20q gain | 21 (32%) | 45 |
0.199 (1.00) |
0.0536 (1.00) |
0.137 (1.00) |
0.846 (1.00) |
0.35 (1.00) |
0.708 (1.00) |
0.433 (1.00) |
0.863 (1.00) |
0.291 (1.00) |
0.0084 (1.00) |
| 21q gain | 4 (6%) | 62 |
0.561 (1.00) |
0.565 (1.00) |
1 (1.00) |
1 (1.00) |
1 (1.00) |
|||||
| 22q gain | 19 (29%) | 47 |
0.0929 (1.00) |
0.449 (1.00) |
0.492 (1.00) |
0.521 (1.00) |
0.166 (1.00) |
0.356 (1.00) |
0.412 (1.00) |
0.776 (1.00) |
0.0341 (1.00) |
|
| xq gain | 6 (9%) | 60 |
0.425 (1.00) |
0.746 (1.00) |
0.381 (1.00) |
0.661 (1.00) |
1 (1.00) |
0.192 (1.00) |
0.388 (1.00) |
|||
| 1p loss | 53 (80%) | 13 |
0.317 (1.00) |
0.426 (1.00) |
0.0285 (1.00) |
0.0411 (1.00) |
1 (1.00) |
0.00606 (1.00) |
0.534 (1.00) |
0.374 (1.00) |
0.556 (1.00) |
|
| 1q loss | 52 (79%) | 14 |
0.961 (1.00) |
0.414 (1.00) |
0.00616 (1.00) |
0.0133 (1.00) |
0.529 (1.00) |
0.0203 (1.00) |
0.367 (1.00) |
0.374 (1.00) |
||
| 2p loss | 46 (70%) | 20 |
0.474 (1.00) |
0.277 (1.00) |
0.144 (1.00) |
0.114 (1.00) |
1 (1.00) |
0.194 (1.00) |
0.284 (1.00) |
0.374 (1.00) |
||
| 2q loss | 46 (70%) | 20 |
0.474 (1.00) |
0.277 (1.00) |
0.144 (1.00) |
0.114 (1.00) |
1 (1.00) |
0.194 (1.00) |
0.284 (1.00) |
0.374 (1.00) |
||
| 3p loss | 9 (14%) | 57 |
0.243 (1.00) |
0.05 (1.00) |
0.0761 (1.00) |
0.0228 (1.00) |
1 (1.00) |
0.658 (1.00) |
0.469 (1.00) |
|||
| 3q loss | 8 (12%) | 58 |
0.284 (1.00) |
0.111 (1.00) |
0.141 (1.00) |
0.0528 (1.00) |
1 (1.00) |
0.639 (1.00) |
0.256 (1.00) |
|||
| 5p loss | 10 (15%) | 56 |
0.854 (1.00) |
0.831 (1.00) |
0.133 (1.00) |
0.0843 (1.00) |
1 (1.00) |
1 (1.00) |
1 (1.00) |
0.117 (1.00) |
0.0496 (1.00) |
|
| 5q loss | 10 (15%) | 56 |
0.854 (1.00) |
0.831 (1.00) |
0.133 (1.00) |
0.0843 (1.00) |
1 (1.00) |
1 (1.00) |
1 (1.00) |
0.117 (1.00) |
0.0496 (1.00) |
|
| 6p loss | 51 (77%) | 15 |
0.184 (1.00) |
0.383 (1.00) |
0.0823 (1.00) |
0.0557 (1.00) |
0.568 (1.00) |
0.17 (1.00) |
0.244 (1.00) |
0.374 (1.00) |
||
| 6q loss | 51 (77%) | 15 |
0.184 (1.00) |
0.383 (1.00) |
0.0823 (1.00) |
0.0557 (1.00) |
0.568 (1.00) |
0.17 (1.00) |
0.244 (1.00) |
0.374 (1.00) |
||
| 8p loss | 9 (14%) | 57 |
0.249 (1.00) |
0.865 (1.00) |
0.741 (1.00) |
0.439 (1.00) |
1 (1.00) |
1 (1.00) |
0.727 (1.00) |
|||
| 8q loss | 8 (12%) | 58 |
0.292 (1.00) |
0.753 (1.00) |
0.701 (1.00) |
0.412 (1.00) |
1 (1.00) |
1 (1.00) |
1 (1.00) |
|||
| 9p loss | 10 (15%) | 56 |
0.0238 (1.00) |
0.00998 (1.00) |
1 (1.00) |
1 (1.00) |
0.529 (1.00) |
0.488 (1.00) |
0.508 (1.00) |
|||
| 9q loss | 10 (15%) | 56 |
0.0238 (1.00) |
0.00998 (1.00) |
1 (1.00) |
1 (1.00) |
0.529 (1.00) |
0.488 (1.00) |
0.508 (1.00) |
|||
| 10p loss | 48 (73%) | 18 |
0.171 (1.00) |
0.758 (1.00) |
0.544 (1.00) |
0.394 (1.00) |
1 (1.00) |
0.0194 (1.00) |
1 (1.00) |
0.107 (1.00) |
0.249 (1.00) |
|
| 10q loss | 49 (74%) | 17 |
0.178 (1.00) |
0.928 (1.00) |
0.347 (1.00) |
0.21 (1.00) |
1 (1.00) |
0.0194 (1.00) |
1 (1.00) |
0.107 (1.00) |
0.249 (1.00) |
|
| 11p loss | 7 (11%) | 59 |
0.366 (1.00) |
0.0268 (1.00) |
0.0966 (1.00) |
0.079 (1.00) |
0.461 (1.00) |
1 (1.00) |
0.691 (1.00) |
|||
| 11q loss | 7 (11%) | 59 |
0.366 (1.00) |
0.0268 (1.00) |
0.0966 (1.00) |
0.079 (1.00) |
0.461 (1.00) |
1 (1.00) |
0.691 (1.00) |
|||
| 13q loss | 43 (65%) | 23 |
0.266 (1.00) |
0.0705 (1.00) |
0.447 (1.00) |
0.357 (1.00) |
0.301 (1.00) |
0.534 (1.00) |
0.294 (1.00) |
0.81 (1.00) |
0.293 (1.00) |
0.362 (1.00) |
| 17p loss | 50 (76%) | 16 |
0.673 (1.00) |
0.146 (1.00) |
0.074 (1.00) |
0.0419 (1.00) |
0.568 (1.00) |
0.17 (1.00) |
0.158 (1.00) |
0.374 (1.00) |
||
| 17q loss | 50 (76%) | 16 |
0.673 (1.00) |
0.146 (1.00) |
0.074 (1.00) |
0.0419 (1.00) |
0.568 (1.00) |
0.17 (1.00) |
0.158 (1.00) |
0.374 (1.00) |
||
| 18p loss | 8 (12%) | 58 |
0.928 (1.00) |
0.499 (1.00) |
0.444 (1.00) |
0.899 (1.00) |
0.211 (1.00) |
0.658 (1.00) |
0.256 (1.00) |
|||
| 18q loss | 10 (15%) | 56 |
0.352 (1.00) |
0.342 (1.00) |
0.137 (1.00) |
0.835 (1.00) |
0.258 (1.00) |
0.658 (1.00) |
0.295 (1.00) |
|||
| 19q loss | 3 (5%) | 63 |
0.106 (1.00) |
0.3 (1.00) |
0.0119 (1.00) |
0.191 (1.00) |
0.0289 (1.00) |
1 (1.00) |
||||
| 20p loss | 4 (6%) | 62 |
0.524 (1.00) |
0.188 (1.00) |
0.138 (1.00) |
0.142 (1.00) |
0.304 (1.00) |
1 (1.00) |
1 (1.00) |
|||
| 20q loss | 3 (5%) | 63 |
0.378 (1.00) |
0.448 (1.00) |
0.04 (1.00) |
0.0249 (1.00) |
0.304 (1.00) |
1 (1.00) |
1 (1.00) |
|||
| 21q loss | 35 (53%) | 31 |
0.0674 (1.00) |
0.485 (1.00) |
0.906 (1.00) |
0.781 (1.00) |
0.0731 (1.00) |
0.0787 (1.00) |
0.805 (1.00) |
0.278 (1.00) |
0.435 (1.00) |
0.101 (1.00) |
| 22q loss | 8 (12%) | 58 |
0.23 (1.00) |
0.8 (1.00) |
0.178 (1.00) |
1 (1.00) |
0.211 (1.00) |
0.322 (1.00) |
0.0553 (1.00) |
|||
| xq loss | 39 (59%) | 27 |
0.514 (1.00) |
0.113 (1.00) |
0.303 (1.00) |
0.362 (1.00) |
1 (1.00) |
0.147 (1.00) |
0.136 (1.00) |
0.0791 (1.00) |
0.242 (1.00) |
0.277 (1.00) |
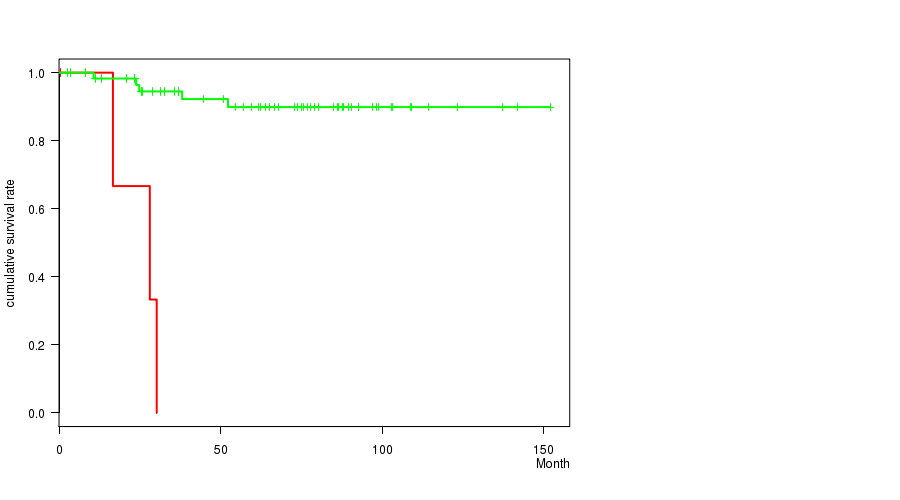
P value = 6.42e-09 (logrank test), Q value = 3.2e-06
Table S1. Gene #50: '16p loss' versus Clinical Feature #1: 'Time to Death'
| nPatients | nDeath | Duration Range (Median), Month | |
|---|---|---|---|
| ALL | 65 | 8 | 0.6 - 151.9 (63.9) |
| 16P LOSS MUTATED | 4 | 3 | 0.6 - 30.2 (22.4) |
| 16P LOSS WILD-TYPE | 61 | 5 | 2.5 - 151.9 (66.5) |
Figure S1. Get High-res Image Gene #50: '16p loss' versus Clinical Feature #1: 'Time to Death'
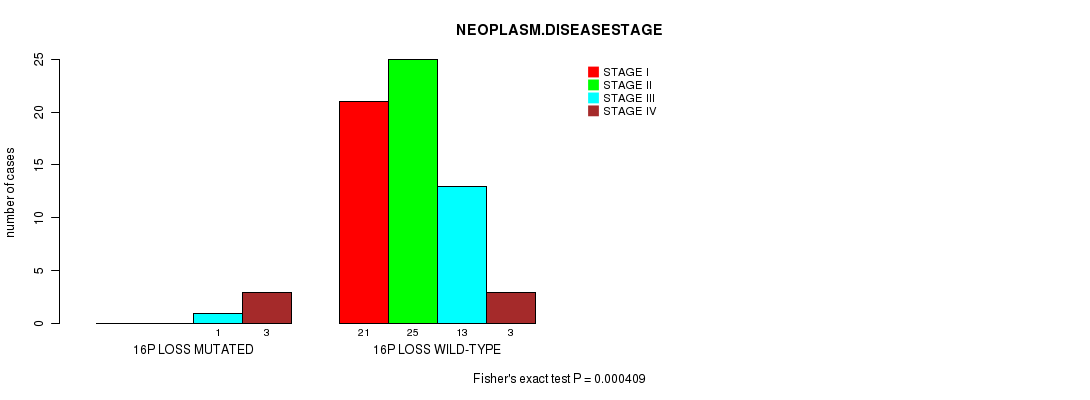
P value = 0.000409 (Fisher's exact test), Q value = 0.2
Table S2. Gene #50: '16p loss' versus Clinical Feature #3: 'NEOPLASM.DISEASESTAGE'
| nPatients | STAGE I | STAGE II | STAGE III | STAGE IV |
|---|---|---|---|---|
| ALL | 21 | 25 | 14 | 6 |
| 16P LOSS MUTATED | 0 | 0 | 1 | 3 |
| 16P LOSS WILD-TYPE | 21 | 25 | 13 | 3 |
Figure S2. Get High-res Image Gene #50: '16p loss' versus Clinical Feature #3: 'NEOPLASM.DISEASESTAGE'
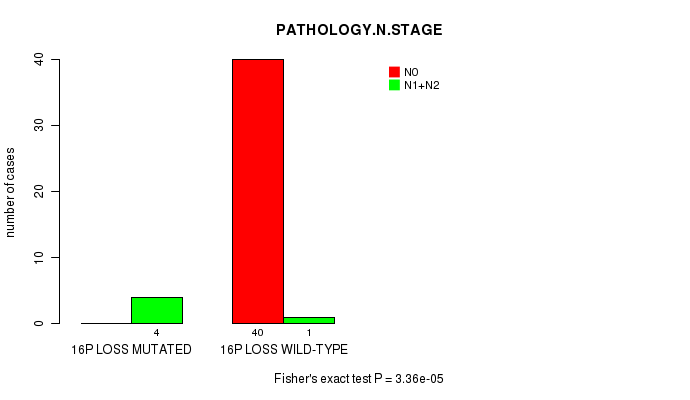
P value = 3.36e-05 (Fisher's exact test), Q value = 0.017
Table S3. Gene #50: '16p loss' versus Clinical Feature #5: 'PATHOLOGY.N.STAGE'
| nPatients | N0 | N1+N2 |
|---|---|---|
| ALL | 40 | 5 |
| 16P LOSS MUTATED | 0 | 4 |
| 16P LOSS WILD-TYPE | 40 | 1 |
Figure S3. Get High-res Image Gene #50: '16p loss' versus Clinical Feature #5: 'PATHOLOGY.N.STAGE'
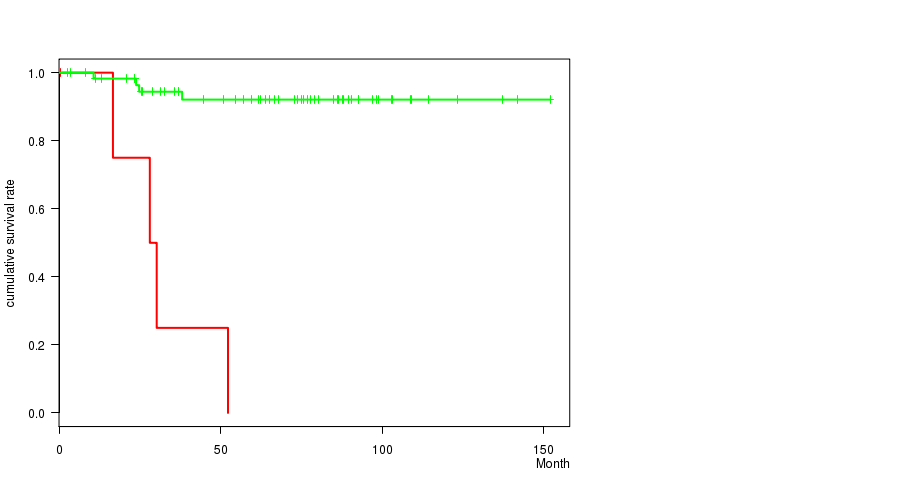
P value = 4.22e-09 (logrank test), Q value = 2.1e-06
Table S4. Gene #51: '16q loss' versus Clinical Feature #1: 'Time to Death'
| nPatients | nDeath | Duration Range (Median), Month | |
|---|---|---|---|
| ALL | 65 | 8 | 0.6 - 151.9 (63.9) |
| 16Q LOSS MUTATED | 5 | 4 | 0.6 - 52.3 (28.1) |
| 16Q LOSS WILD-TYPE | 60 | 4 | 2.5 - 151.9 (67.2) |
Figure S4. Get High-res Image Gene #51: '16q loss' versus Clinical Feature #1: 'Time to Death'
P value = 0.000165 (Fisher's exact test), Q value = 0.082
Table S5. Gene #51: '16q loss' versus Clinical Feature #5: 'PATHOLOGY.N.STAGE'
| nPatients | N0 | N1+N2 |
|---|---|---|
| ALL | 40 | 5 |
| 16Q LOSS MUTATED | 1 | 4 |
| 16Q LOSS WILD-TYPE | 39 | 1 |
Figure S5. Get High-res Image Gene #51: '16q loss' versus Clinical Feature #5: 'PATHOLOGY.N.STAGE'
-
Copy number data file = transformed.cor.cli.txt
-
Clinical data file = KICH-TP.merged_data.txt
-
Number of patients = 66
-
Number of significantly arm-level cnvs = 61
-
Number of selected clinical features = 10
-
Exclude regions that fewer than K tumors have mutations, K = 3
For survival clinical features, the Kaplan-Meier survival curves of tumors with and without gene mutations were plotted and the statistical significance P values were estimated by logrank test (Bland and Altman 2004) using the 'survdiff' function in R
For continuous numerical clinical features, two-tailed Student's t test with unequal variance (Lehmann and Romano 2005) was applied to compare the clinical values between tumors with and without gene mutations using 't.test' function in R
For binary or multi-class clinical features (nominal or ordinal), two-tailed Fisher's exact tests (Fisher 1922) were used to estimate the P values using the 'fisher.test' function in R
For multiple hypothesis correction, Q value is the False Discovery Rate (FDR) analogue of the P value (Benjamini and Hochberg 1995), defined as the minimum FDR at which the test may be called significant. We used the 'Benjamini and Hochberg' method of 'p.adjust' function in R to convert P values into Q values.
In addition to the links below, the full results of the analysis summarized in this report can also be downloaded programmatically using firehose_get, or interactively from either the Broad GDAC website or TCGA Data Coordination Center Portal.