This pipeline computes the correlation between significant arm-level copy number variations (cnvs) and selected clinical features.
Testing the association between copy number variation 79 arm-level events and 9 clinical features across 494 patients, 22 significant findings detected with Q value < 0.25.
-
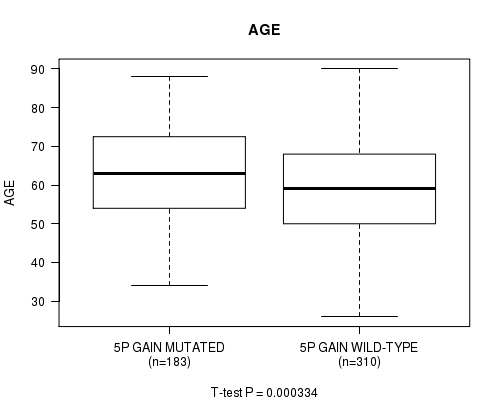
5p gain cnv correlated to 'AGE'.
-
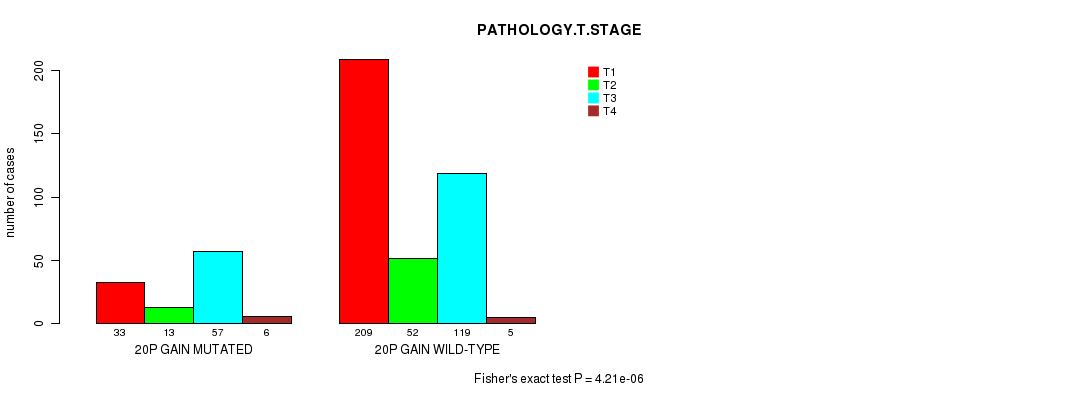
20p gain cnv correlated to 'NEOPLASM.DISEASESTAGE' and 'PATHOLOGY.T.STAGE'.
-
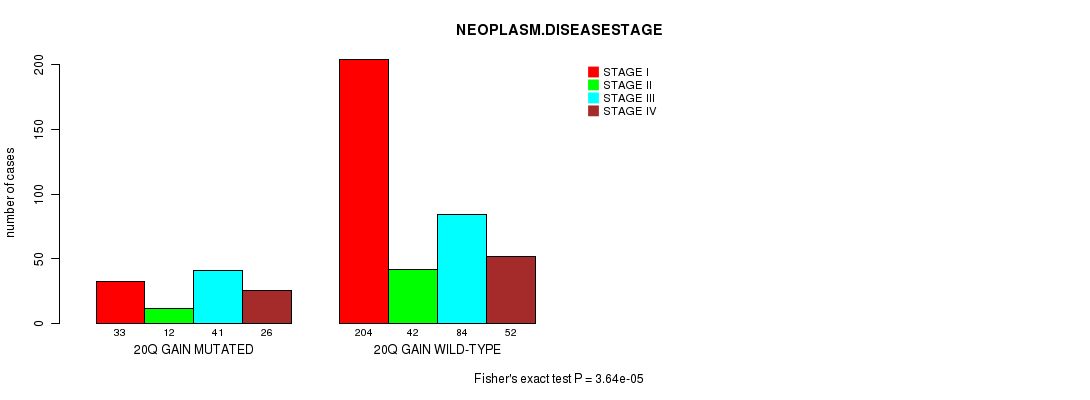
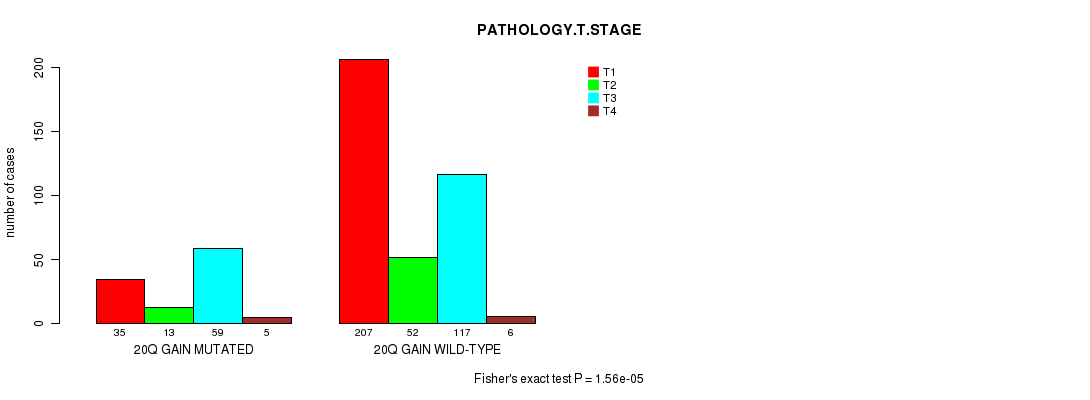
20q gain cnv correlated to 'NEOPLASM.DISEASESTAGE' and 'PATHOLOGY.T.STAGE'.
-
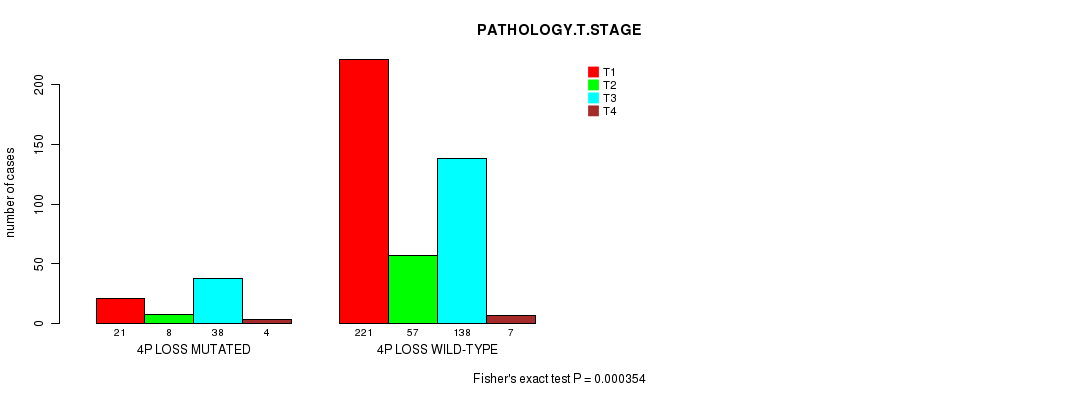
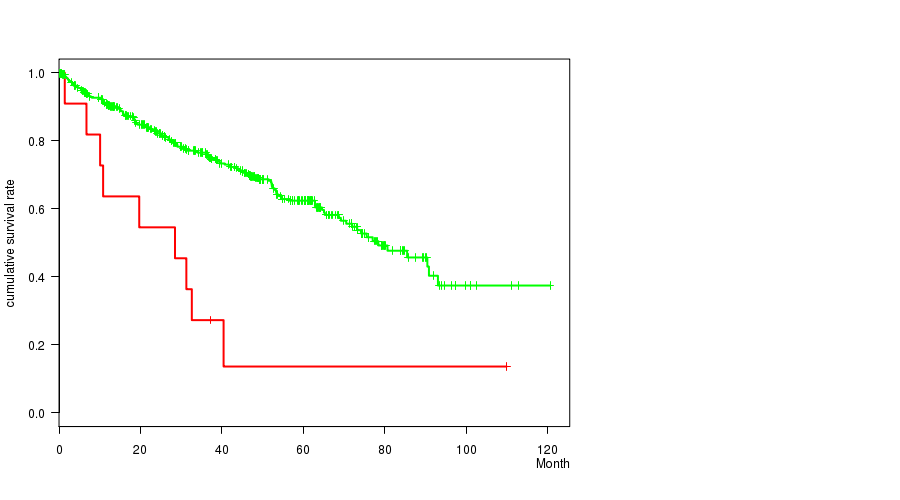
4p loss cnv correlated to 'Time to Death' and 'PATHOLOGY.T.STAGE'.
-
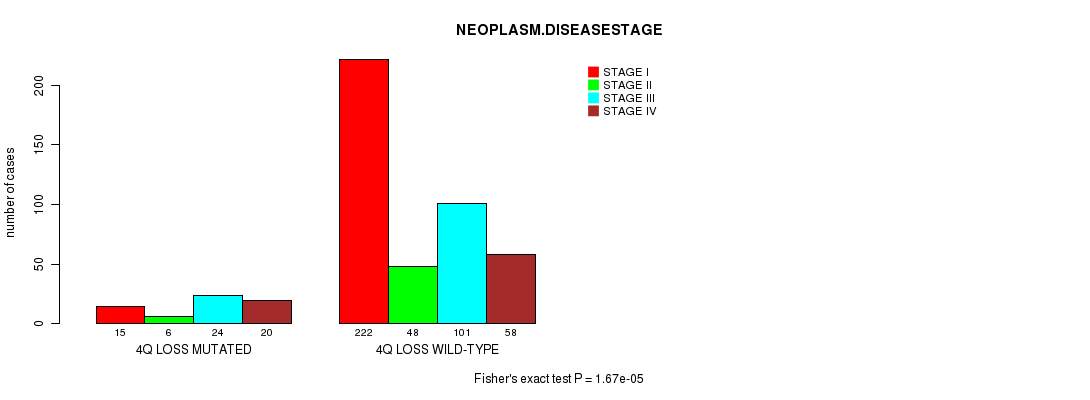
4q loss cnv correlated to 'Time to Death', 'NEOPLASM.DISEASESTAGE', and 'PATHOLOGY.T.STAGE'.
-
5p loss cnv correlated to 'PATHOLOGY.T.STAGE'.
-
9p loss cnv correlated to 'Time to Death', 'NEOPLASM.DISEASESTAGE', and 'PATHOLOGY.T.STAGE'.
-
9q loss cnv correlated to 'Time to Death', 'NEOPLASM.DISEASESTAGE', and 'PATHOLOGY.T.STAGE'.
-
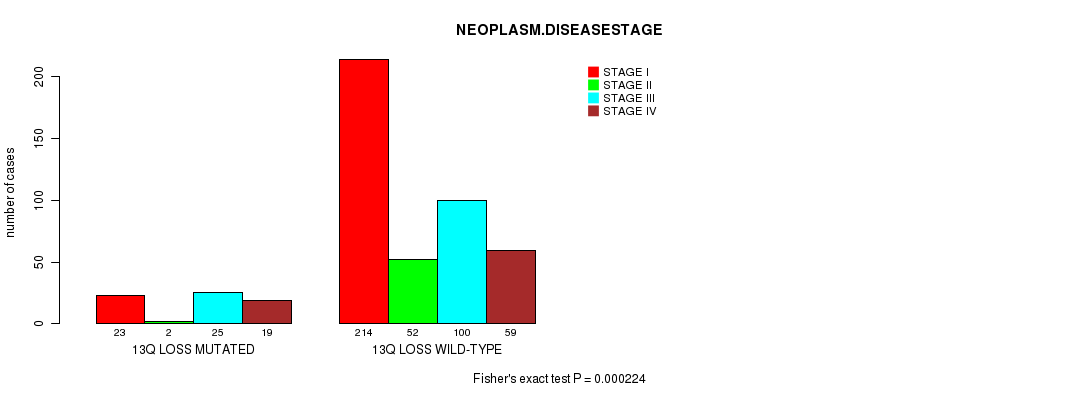
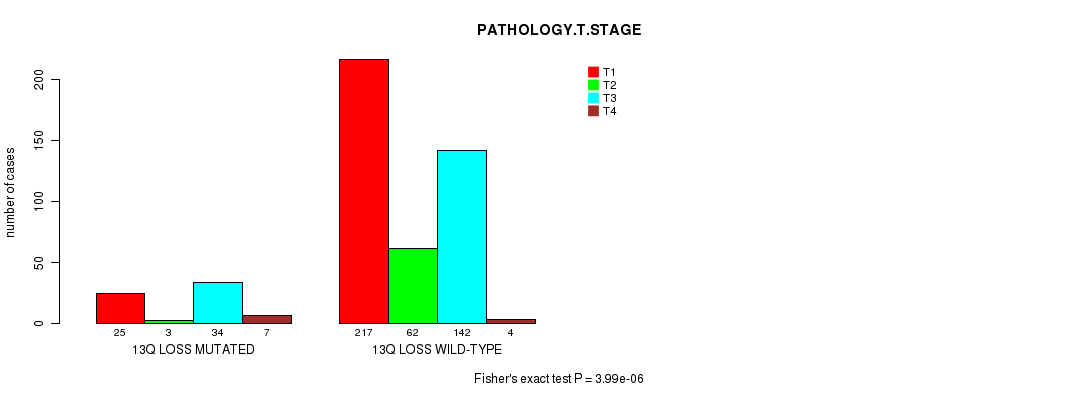
13q loss cnv correlated to 'NEOPLASM.DISEASESTAGE' and 'PATHOLOGY.T.STAGE'.
-
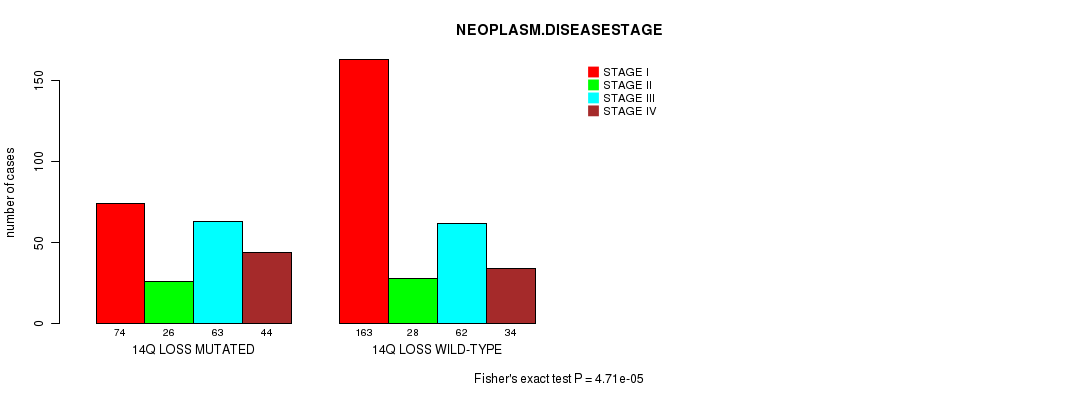
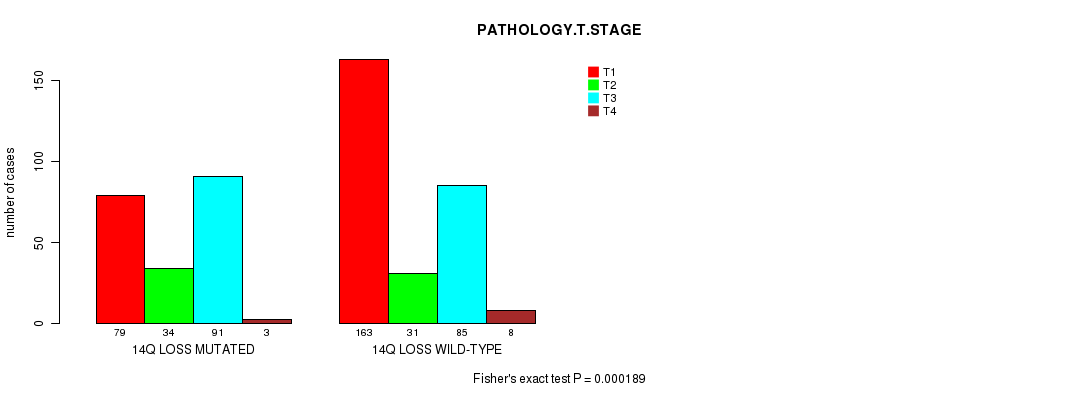
14q loss cnv correlated to 'NEOPLASM.DISEASESTAGE' and 'PATHOLOGY.T.STAGE'.
-
19p loss cnv correlated to 'Time to Death'.
Table 1. Get Full Table Overview of the association between significant copy number variation of 79 arm-level events and 9 clinical features. Shown in the table are P values (Q values). Thresholded by Q value < 0.25, 22 significant findings detected.
|
Clinical Features |
Time to Death |
AGE |
NEOPLASM DISEASESTAGE |
PATHOLOGY T STAGE |
PATHOLOGY N STAGE |
PATHOLOGY M STAGE |
GENDER |
KARNOFSKY PERFORMANCE SCORE |
NUMBERPACKYEARSSMOKED | ||
| nCNV (%) | nWild-Type | logrank test | t-test | Fisher's exact test | Fisher's exact test | Fisher's exact test | Fisher's exact test | Fisher's exact test | t-test | t-test | |
| 4q loss | 65 (13%) | 429 |
1.93e-06 (0.00116) |
0.905 (1.00) |
1.67e-05 (0.00995) |
8.49e-06 (0.00509) |
0.468 (1.00) |
0.00275 (1.00) |
0.401 (1.00) |
0.193 (1.00) |
|
| 9p loss | 142 (29%) | 352 |
3.1e-05 (0.0184) |
0.091 (1.00) |
1.75e-05 (0.0104) |
9.01e-05 (0.0532) |
0.0977 (1.00) |
0.00393 (1.00) |
0.000792 (0.455) |
0.576 (1.00) |
|
| 9q loss | 145 (29%) | 349 |
0.000152 (0.0898) |
0.05 (1.00) |
1.82e-06 (0.0011) |
7.87e-06 (0.00472) |
0.172 (1.00) |
0.00265 (1.00) |
0.000853 (0.489) |
0.487 (1.00) |
|
| 20p gain | 109 (22%) | 385 |
0.163 (1.00) |
0.156 (1.00) |
5.29e-05 (0.0313) |
4.21e-06 (0.00253) |
0.548 (1.00) |
0.0105 (1.00) |
0.00197 (1.00) |
0.373 (1.00) |
|
| 20q gain | 112 (23%) | 382 |
0.124 (1.00) |
0.0463 (1.00) |
3.64e-05 (0.0216) |
1.56e-05 (0.00935) |
0.24 (1.00) |
0.0171 (1.00) |
0.00918 (1.00) |
0.373 (1.00) |
|
| 4p loss | 71 (14%) | 423 |
7.09e-06 (0.00426) |
0.977 (1.00) |
0.000484 (0.281) |
0.000354 (0.207) |
0.727 (1.00) |
0.0206 (1.00) |
1 (1.00) |
0.13 (1.00) |
|
| 13q loss | 69 (14%) | 425 |
0.000513 (0.297) |
0.553 (1.00) |
0.000224 (0.131) |
3.99e-06 (0.00241) |
0.325 (1.00) |
0.0317 (1.00) |
0.34 (1.00) |
0.669 (1.00) |
|
| 14q loss | 207 (42%) | 287 |
0.00253 (1.00) |
0.127 (1.00) |
4.71e-05 (0.0279) |
0.000189 (0.112) |
0.00237 (1.00) |
0.00163 (0.926) |
0.0691 (1.00) |
0.0872 (1.00) |
|
| 5p gain | 183 (37%) | 311 |
0.0513 (1.00) |
0.000334 (0.195) |
0.176 (1.00) |
0.307 (1.00) |
0.622 (1.00) |
0.899 (1.00) |
0.0186 (1.00) |
0.572 (1.00) |
|
| 5p loss | 7 (1%) | 487 |
0.0198 (1.00) |
0.29 (1.00) |
0.00185 (1.00) |
0.000195 (0.115) |
1 (1.00) |
0.0798 (1.00) |
0.242 (1.00) |
||
| 19p loss | 11 (2%) | 483 |
0.000205 (0.12) |
0.0394 (1.00) |
0.0315 (1.00) |
0.000986 (0.564) |
1 (1.00) |
0.39 (1.00) |
0.755 (1.00) |
||
| 1p gain | 21 (4%) | 473 |
0.00142 (0.809) |
0.198 (1.00) |
0.209 (1.00) |
0.27 (1.00) |
0.216 (1.00) |
0.35 (1.00) |
0.815 (1.00) |
0.482 (1.00) |
|
| 1q gain | 49 (10%) | 445 |
0.15 (1.00) |
0.0574 (1.00) |
0.13 (1.00) |
0.135 (1.00) |
0.417 (1.00) |
0.837 (1.00) |
0.636 (1.00) |
0.499 (1.00) |
|
| 2p gain | 74 (15%) | 420 |
0.793 (1.00) |
0.113 (1.00) |
0.168 (1.00) |
0.427 (1.00) |
1 (1.00) |
0.487 (1.00) |
0.791 (1.00) |
0.491 (1.00) |
|
| 2q gain | 75 (15%) | 419 |
0.639 (1.00) |
0.157 (1.00) |
0.308 (1.00) |
0.671 (1.00) |
1 (1.00) |
0.393 (1.00) |
0.294 (1.00) |
0.387 (1.00) |
|
| 3p gain | 18 (4%) | 476 |
0.0972 (1.00) |
0.858 (1.00) |
0.128 (1.00) |
0.276 (1.00) |
0.0376 (1.00) |
0.0461 (1.00) |
0.45 (1.00) |
0.328 (1.00) |
|
| 3q gain | 56 (11%) | 438 |
0.456 (1.00) |
0.606 (1.00) |
0.00238 (1.00) |
0.000541 (0.313) |
0.00543 (1.00) |
0.00278 (1.00) |
0.766 (1.00) |
0.193 (1.00) |
|
| 4p gain | 13 (3%) | 481 |
0.104 (1.00) |
0.862 (1.00) |
0.466 (1.00) |
0.21 (1.00) |
0.501 (1.00) |
1 (1.00) |
0.557 (1.00) |
||
| 4q gain | 13 (3%) | 481 |
0.306 (1.00) |
0.862 (1.00) |
0.573 (1.00) |
0.755 (1.00) |
0.46 (1.00) |
0.702 (1.00) |
1 (1.00) |
||
| 5q gain | 196 (40%) | 298 |
0.0867 (1.00) |
0.000617 (0.356) |
0.473 (1.00) |
0.485 (1.00) |
1 (1.00) |
0.9 (1.00) |
0.0423 (1.00) |
0.572 (1.00) |
|
| 6p gain | 10 (2%) | 484 |
0.93 (1.00) |
0.961 (1.00) |
0.58 (1.00) |
0.407 (1.00) |
1 (1.00) |
0.659 (1.00) |
0.506 (1.00) |
||
| 6q gain | 8 (2%) | 486 |
0.851 (1.00) |
0.517 (1.00) |
0.47 (1.00) |
0.462 (1.00) |
1 (1.00) |
1 (1.00) |
0.273 (1.00) |
||
| 7p gain | 165 (33%) | 329 |
0.934 (1.00) |
0.392 (1.00) |
0.0687 (1.00) |
0.132 (1.00) |
0.451 (1.00) |
0.0178 (1.00) |
0.00498 (1.00) |
0.711 (1.00) |
|
| 7q gain | 166 (34%) | 328 |
0.562 (1.00) |
0.444 (1.00) |
0.0149 (1.00) |
0.0663 (1.00) |
0.443 (1.00) |
0.00234 (1.00) |
0.0126 (1.00) |
0.528 (1.00) |
|
| 8p gain | 28 (6%) | 466 |
0.549 (1.00) |
0.327 (1.00) |
0.00199 (1.00) |
0.00176 (0.998) |
0.607 (1.00) |
0.177 (1.00) |
0.546 (1.00) |
0.757 (1.00) |
|
| 8q gain | 57 (12%) | 437 |
0.244 (1.00) |
0.0805 (1.00) |
0.00905 (1.00) |
0.005 (1.00) |
0.441 (1.00) |
0.121 (1.00) |
0.302 (1.00) |
0.471 (1.00) |
|
| 9p gain | 14 (3%) | 480 |
0.481 (1.00) |
0.31 (1.00) |
0.82 (1.00) |
0.077 (1.00) |
1 (1.00) |
0.707 (1.00) |
0.0234 (1.00) |
||
| 9q gain | 12 (2%) | 482 |
0.949 (1.00) |
0.339 (1.00) |
0.231 (1.00) |
0.00317 (1.00) |
1 (1.00) |
1 (1.00) |
0.121 (1.00) |
||
| 10p gain | 16 (3%) | 478 |
0.931 (1.00) |
0.247 (1.00) |
0.666 (1.00) |
0.19 (1.00) |
0.0854 (1.00) |
0.725 (1.00) |
1 (1.00) |
0.887 (1.00) |
|
| 10q gain | 12 (2%) | 482 |
0.688 (1.00) |
0.0407 (1.00) |
0.806 (1.00) |
0.884 (1.00) |
0.264 (1.00) |
1 (1.00) |
0.356 (1.00) |
0.81 (1.00) |
|
| 11p gain | 30 (6%) | 464 |
0.987 (1.00) |
0.764 (1.00) |
0.0244 (1.00) |
0.0122 (1.00) |
1 (1.00) |
0.114 (1.00) |
1 (1.00) |
0.484 (1.00) |
|
| 11q gain | 28 (6%) | 466 |
0.497 (1.00) |
0.828 (1.00) |
0.148 (1.00) |
0.0799 (1.00) |
1 (1.00) |
0.418 (1.00) |
1 (1.00) |
||
| 12p gain | 116 (23%) | 378 |
0.00999 (1.00) |
0.0326 (1.00) |
0.00125 (0.715) |
0.00469 (1.00) |
0.259 (1.00) |
0.0275 (1.00) |
0.657 (1.00) |
0.268 (1.00) |
|
| 12q gain | 117 (24%) | 377 |
0.0156 (1.00) |
0.0832 (1.00) |
0.000859 (0.492) |
0.00304 (1.00) |
0.259 (1.00) |
0.0286 (1.00) |
0.657 (1.00) |
0.268 (1.00) |
|
| 13q gain | 22 (4%) | 472 |
0.107 (1.00) |
0.336 (1.00) |
0.178 (1.00) |
0.275 (1.00) |
1 (1.00) |
0.364 (1.00) |
0.261 (1.00) |
||
| 14q gain | 16 (3%) | 478 |
0.161 (1.00) |
0.563 (1.00) |
0.279 (1.00) |
0.00814 (1.00) |
1 (1.00) |
0.292 (1.00) |
1 (1.00) |
||
| 15q gain | 26 (5%) | 468 |
0.257 (1.00) |
0.38 (1.00) |
0.633 (1.00) |
0.481 (1.00) |
0.216 (1.00) |
0.58 (1.00) |
0.833 (1.00) |
0.349 (1.00) |
|
| 16p gain | 103 (21%) | 391 |
0.267 (1.00) |
0.204 (1.00) |
0.217 (1.00) |
0.127 (1.00) |
0.133 (1.00) |
0.544 (1.00) |
0.908 (1.00) |
0.449 (1.00) |
|
| 16q gain | 95 (19%) | 399 |
0.212 (1.00) |
0.262 (1.00) |
0.228 (1.00) |
0.0821 (1.00) |
0.212 (1.00) |
1 (1.00) |
0.811 (1.00) |
0.31 (1.00) |
|
| 17p gain | 24 (5%) | 470 |
0.949 (1.00) |
0.4 (1.00) |
0.083 (1.00) |
0.812 (1.00) |
0.216 (1.00) |
0.0216 (1.00) |
1 (1.00) |
0.74 (1.00) |
|
| 17q gain | 30 (6%) | 464 |
0.46 (1.00) |
0.409 (1.00) |
0.532 (1.00) |
0.754 (1.00) |
0.301 (1.00) |
0.202 (1.00) |
0.844 (1.00) |
0.471 (1.00) |
|
| 18p gain | 25 (5%) | 469 |
0.0417 (1.00) |
0.664 (1.00) |
0.677 (1.00) |
0.894 (1.00) |
1 (1.00) |
0.401 (1.00) |
0.0826 (1.00) |
||
| 18q gain | 25 (5%) | 469 |
0.102 (1.00) |
0.52 (1.00) |
0.557 (1.00) |
0.822 (1.00) |
0.607 (1.00) |
0.401 (1.00) |
0.0826 (1.00) |
||
| 19p gain | 50 (10%) | 444 |
0.798 (1.00) |
0.659 (1.00) |
0.0196 (1.00) |
0.04 (1.00) |
0.397 (1.00) |
0.0213 (1.00) |
0.349 (1.00) |
0.716 (1.00) |
|
| 19q gain | 56 (11%) | 438 |
0.749 (1.00) |
0.418 (1.00) |
0.00599 (1.00) |
0.017 (1.00) |
0.428 (1.00) |
0.00954 (1.00) |
0.372 (1.00) |
0.716 (1.00) |
|
| 21q gain | 48 (10%) | 446 |
0.601 (1.00) |
0.116 (1.00) |
0.242 (1.00) |
0.125 (1.00) |
1 (1.00) |
0.53 (1.00) |
0.43 (1.00) |
0.297 (1.00) |
|
| 22q gain | 40 (8%) | 454 |
0.464 (1.00) |
0.484 (1.00) |
0.839 (1.00) |
0.129 (1.00) |
1 (1.00) |
0.655 (1.00) |
0.388 (1.00) |
0.829 (1.00) |
|
| xq gain | 26 (5%) | 468 |
0.963 (1.00) |
0.956 (1.00) |
0.0585 (1.00) |
0.0816 (1.00) |
1 (1.00) |
0.0459 (1.00) |
0.403 (1.00) |
0.328 (1.00) |
|
| 1p loss | 58 (12%) | 436 |
0.395 (1.00) |
0.084 (1.00) |
0.446 (1.00) |
0.00814 (1.00) |
1 (1.00) |
0.334 (1.00) |
0.244 (1.00) |
0.297 (1.00) |
|
| 1q loss | 37 (7%) | 457 |
0.477 (1.00) |
0.491 (1.00) |
0.819 (1.00) |
0.071 (1.00) |
0.637 (1.00) |
0.243 (1.00) |
0.859 (1.00) |
0.484 (1.00) |
|
| 2p loss | 14 (3%) | 480 |
0.796 (1.00) |
0.927 (1.00) |
0.412 (1.00) |
0.12 (1.00) |
1 (1.00) |
0.707 (1.00) |
0.78 (1.00) |
||
| 2q loss | 14 (3%) | 480 |
0.812 (1.00) |
0.908 (1.00) |
0.562 (1.00) |
0.216 (1.00) |
1 (1.00) |
0.707 (1.00) |
0.78 (1.00) |
||
| 3p loss | 357 (72%) | 137 |
0.584 (1.00) |
0.751 (1.00) |
0.0126 (1.00) |
0.0258 (1.00) |
0.788 (1.00) |
0.128 (1.00) |
0.027 (1.00) |
0.0785 (1.00) |
|
| 3q loss | 100 (20%) | 394 |
0.69 (1.00) |
0.0103 (1.00) |
0.622 (1.00) |
0.307 (1.00) |
0.747 (1.00) |
0.758 (1.00) |
0.00314 (1.00) |
0.384 (1.00) |
|
| 5q loss | 6 (1%) | 488 |
0.0548 (1.00) |
0.231 (1.00) |
0.00581 (1.00) |
0.000452 (0.263) |
1 (1.00) |
0.237 (1.00) |
0.421 (1.00) |
||
| 6p loss | 99 (20%) | 395 |
0.277 (1.00) |
0.377 (1.00) |
0.0589 (1.00) |
0.0389 (1.00) |
0.0061 (1.00) |
0.279 (1.00) |
0.00201 (1.00) |
0.122 (1.00) |
|
| 6q loss | 124 (25%) | 370 |
0.65 (1.00) |
0.832 (1.00) |
0.273 (1.00) |
0.194 (1.00) |
0.00149 (0.843) |
0.668 (1.00) |
0.0634 (1.00) |
0.21 (1.00) |
|
| 7q loss | 3 (1%) | 491 |
0.529 (1.00) |
0.559 (1.00) |
0.127 (1.00) |
0.011 (1.00) |
0.0732 (1.00) |
1 (1.00) |
0.555 (1.00) |
||
| 8p loss | 134 (27%) | 360 |
0.281 (1.00) |
0.55 (1.00) |
0.423 (1.00) |
0.371 (1.00) |
0.779 (1.00) |
0.266 (1.00) |
0.136 (1.00) |
0.893 (1.00) |
|
| 8q loss | 64 (13%) | 430 |
0.645 (1.00) |
0.918 (1.00) |
0.663 (1.00) |
0.544 (1.00) |
0.454 (1.00) |
1 (1.00) |
0.0239 (1.00) |
0.654 (1.00) |
|
| 10p loss | 66 (13%) | 428 |
0.334 (1.00) |
0.381 (1.00) |
0.0906 (1.00) |
0.0125 (1.00) |
0.14 (1.00) |
0.584 (1.00) |
0.331 (1.00) |
0.0269 (1.00) |
|
| 10q loss | 86 (17%) | 408 |
0.475 (1.00) |
0.513 (1.00) |
0.0958 (1.00) |
0.00267 (1.00) |
0.322 (1.00) |
0.624 (1.00) |
0.105 (1.00) |
0.112 (1.00) |
|
| 11p loss | 18 (4%) | 476 |
0.0091 (1.00) |
0.145 (1.00) |
0.458 (1.00) |
0.457 (1.00) |
0.16 (1.00) |
0.503 (1.00) |
1 (1.00) |
0.81 (1.00) |
|
| 11q loss | 23 (5%) | 471 |
0.00902 (1.00) |
0.0228 (1.00) |
0.697 (1.00) |
0.641 (1.00) |
0.244 (1.00) |
0.381 (1.00) |
0.502 (1.00) |
0.887 (1.00) |
|
| 12p loss | 3 (1%) | 491 |
0.321 (1.00) |
0.755 (1.00) |
0.49 (1.00) |
0.743 (1.00) |
1 (1.00) |
1 (1.00) |
1 (1.00) |
||
| 12q loss | 4 (1%) | 490 |
0.955 (1.00) |
0.343 (1.00) |
0.173 (1.00) |
0.414 (1.00) |
1 (1.00) |
1 (1.00) |
1 (1.00) |
||
| 15q loss | 35 (7%) | 459 |
0.00213 (1.00) |
0.829 (1.00) |
0.00113 (0.648) |
0.000511 (0.296) |
1 (1.00) |
0.0135 (1.00) |
0.0661 (1.00) |
0.484 (1.00) |
|
| 16p loss | 9 (2%) | 485 |
0.134 (1.00) |
0.842 (1.00) |
0.257 (1.00) |
0.00987 (1.00) |
0.369 (1.00) |
1 (1.00) |
1 (1.00) |
||
| 16q loss | 13 (3%) | 481 |
0.218 (1.00) |
0.916 (1.00) |
0.292 (1.00) |
0.00393 (1.00) |
0.46 (1.00) |
1 (1.00) |
1 (1.00) |
||
| 17p loss | 45 (9%) | 449 |
0.406 (1.00) |
0.414 (1.00) |
0.275 (1.00) |
0.26 (1.00) |
0.375 (1.00) |
0.0491 (1.00) |
0.143 (1.00) |
0.0261 (1.00) |
|
| 17q loss | 28 (6%) | 466 |
0.542 (1.00) |
0.832 (1.00) |
0.357 (1.00) |
0.353 (1.00) |
1 (1.00) |
0.177 (1.00) |
0.312 (1.00) |
||
| 18p loss | 91 (18%) | 403 |
0.00196 (1.00) |
0.125 (1.00) |
0.00062 (0.357) |
0.000451 (0.263) |
1 (1.00) |
0.0775 (1.00) |
0.222 (1.00) |
0.494 (1.00) |
|
| 18q loss | 93 (19%) | 401 |
0.0084 (1.00) |
0.14 (1.00) |
0.0124 (1.00) |
0.00762 (1.00) |
1 (1.00) |
0.0833 (1.00) |
0.148 (1.00) |
0.569 (1.00) |
|
| 19q loss | 4 (1%) | 490 |
0.004 (1.00) |
0.831 (1.00) |
0.244 (1.00) |
0.00312 (1.00) |
1 (1.00) |
0.117 (1.00) |
1 (1.00) |
||
| 20p loss | 8 (2%) | 486 |
0.827 (1.00) |
0.702 (1.00) |
0.726 (1.00) |
0.616 (1.00) |
1 (1.00) |
0.362 (1.00) |
1 (1.00) |
||
| 20q loss | 3 (1%) | 491 |
0.799 (1.00) |
0.181 (1.00) |
0.243 (1.00) |
0.111 (1.00) |
0.399 (1.00) |
1 (1.00) |
|||
| 21q loss | 53 (11%) | 441 |
0.574 (1.00) |
0.592 (1.00) |
0.204 (1.00) |
0.00464 (1.00) |
0.095 (1.00) |
1 (1.00) |
0.761 (1.00) |
0.505 (1.00) |
|
| 22q loss | 38 (8%) | 456 |
0.0023 (1.00) |
0.269 (1.00) |
0.0202 (1.00) |
0.171 (1.00) |
1 (1.00) |
0.0647 (1.00) |
0.727 (1.00) |
0.115 (1.00) |
|
| xq loss | 46 (9%) | 448 |
0.141 (1.00) |
0.483 (1.00) |
0.538 (1.00) |
0.246 (1.00) |
0.359 (1.00) |
0.673 (1.00) |
0.142 (1.00) |
P value = 0.000334 (t-test), Q value = 0.2
Table S1. Gene #9: '5p gain' versus Clinical Feature #2: 'AGE'
| nPatients | Mean (Std.Dev) | |
|---|---|---|
| ALL | 493 | 60.6 (12.2) |
| 5P GAIN MUTATED | 183 | 63.1 (11.8) |
| 5P GAIN WILD-TYPE | 310 | 59.1 (12.2) |
Figure S1. Get High-res Image Gene #9: '5p gain' versus Clinical Feature #2: 'AGE'
P value = 5.29e-05 (Fisher's exact test), Q value = 0.031
Table S2. Gene #36: '20p gain' versus Clinical Feature #3: 'NEOPLASM.DISEASESTAGE'
| nPatients | STAGE I | STAGE II | STAGE III | STAGE IV |
|---|---|---|---|---|
| ALL | 237 | 54 | 125 | 78 |
| 20P GAIN MUTATED | 32 | 12 | 39 | 26 |
| 20P GAIN WILD-TYPE | 205 | 42 | 86 | 52 |
Figure S2. Get High-res Image Gene #36: '20p gain' versus Clinical Feature #3: 'NEOPLASM.DISEASESTAGE'

P value = 4.21e-06 (Fisher's exact test), Q value = 0.0025
Table S3. Gene #36: '20p gain' versus Clinical Feature #4: 'PATHOLOGY.T.STAGE'
| nPatients | T1 | T2 | T3 | T4 |
|---|---|---|---|---|
| ALL | 242 | 65 | 176 | 11 |
| 20P GAIN MUTATED | 33 | 13 | 57 | 6 |
| 20P GAIN WILD-TYPE | 209 | 52 | 119 | 5 |
Figure S3. Get High-res Image Gene #36: '20p gain' versus Clinical Feature #4: 'PATHOLOGY.T.STAGE'
P value = 3.64e-05 (Fisher's exact test), Q value = 0.022
Table S4. Gene #37: '20q gain' versus Clinical Feature #3: 'NEOPLASM.DISEASESTAGE'
| nPatients | STAGE I | STAGE II | STAGE III | STAGE IV |
|---|---|---|---|---|
| ALL | 237 | 54 | 125 | 78 |
| 20Q GAIN MUTATED | 33 | 12 | 41 | 26 |
| 20Q GAIN WILD-TYPE | 204 | 42 | 84 | 52 |
Figure S4. Get High-res Image Gene #37: '20q gain' versus Clinical Feature #3: 'NEOPLASM.DISEASESTAGE'
P value = 1.56e-05 (Fisher's exact test), Q value = 0.0093
Table S5. Gene #37: '20q gain' versus Clinical Feature #4: 'PATHOLOGY.T.STAGE'
| nPatients | T1 | T2 | T3 | T4 |
|---|---|---|---|---|
| ALL | 242 | 65 | 176 | 11 |
| 20Q GAIN MUTATED | 35 | 13 | 59 | 5 |
| 20Q GAIN WILD-TYPE | 207 | 52 | 117 | 6 |
Figure S5. Get High-res Image Gene #37: '20q gain' versus Clinical Feature #4: 'PATHOLOGY.T.STAGE'
P value = 7.09e-06 (logrank test), Q value = 0.0043
Table S6. Gene #47: '4p loss' versus Clinical Feature #1: 'Time to Death'
| nPatients | nDeath | Duration Range (Median), Month | |
|---|---|---|---|
| ALL | 493 | 163 | 0.1 - 120.6 (36.8) |
| 4P LOSS MUTATED | 71 | 38 | 0.5 - 90.3 (25.7) |
| 4P LOSS WILD-TYPE | 422 | 125 | 0.1 - 120.6 (37.2) |
Figure S6. Get High-res Image Gene #47: '4p loss' versus Clinical Feature #1: 'Time to Death'
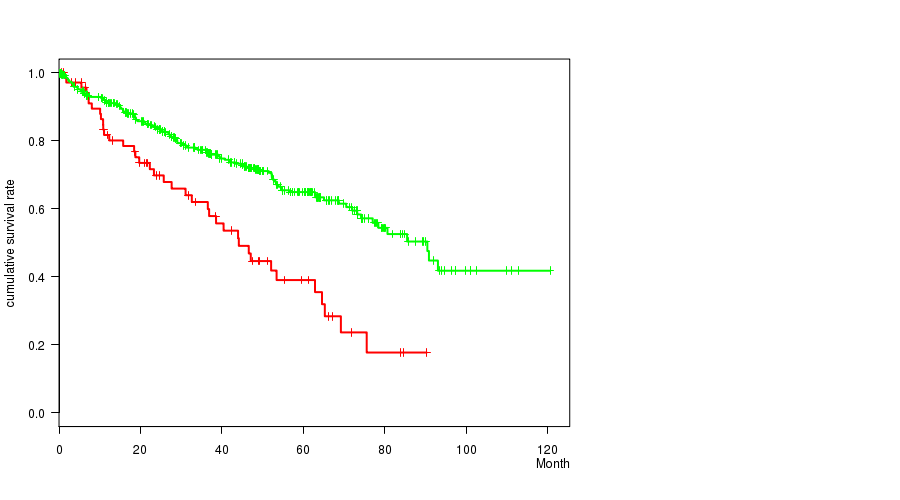
P value = 0.000354 (Fisher's exact test), Q value = 0.21
Table S7. Gene #47: '4p loss' versus Clinical Feature #4: 'PATHOLOGY.T.STAGE'
| nPatients | T1 | T2 | T3 | T4 |
|---|---|---|---|---|
| ALL | 242 | 65 | 176 | 11 |
| 4P LOSS MUTATED | 21 | 8 | 38 | 4 |
| 4P LOSS WILD-TYPE | 221 | 57 | 138 | 7 |
Figure S7. Get High-res Image Gene #47: '4p loss' versus Clinical Feature #4: 'PATHOLOGY.T.STAGE'
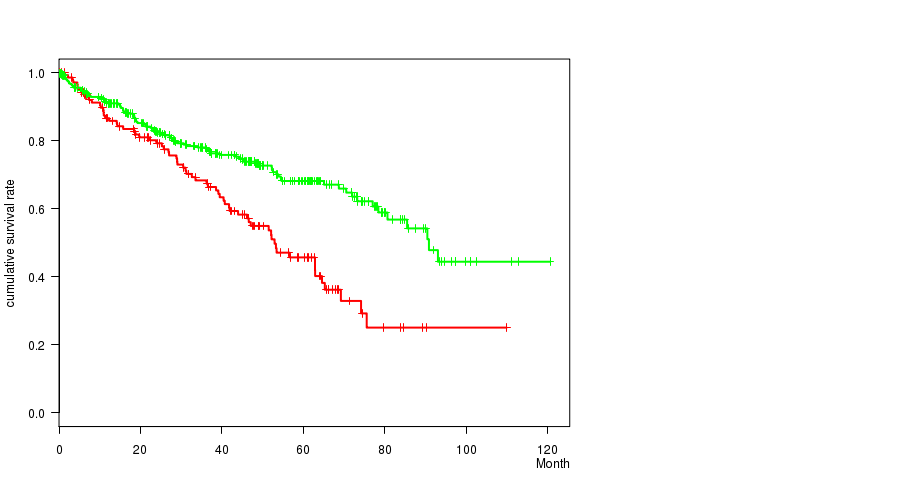
P value = 1.93e-06 (logrank test), Q value = 0.0012
Table S8. Gene #48: '4q loss' versus Clinical Feature #1: 'Time to Death'
| nPatients | nDeath | Duration Range (Median), Month | |
|---|---|---|---|
| ALL | 493 | 163 | 0.1 - 120.6 (36.8) |
| 4Q LOSS MUTATED | 65 | 36 | 1.0 - 90.3 (23.3) |
| 4Q LOSS WILD-TYPE | 428 | 127 | 0.1 - 120.6 (37.2) |
Figure S8. Get High-res Image Gene #48: '4q loss' versus Clinical Feature #1: 'Time to Death'
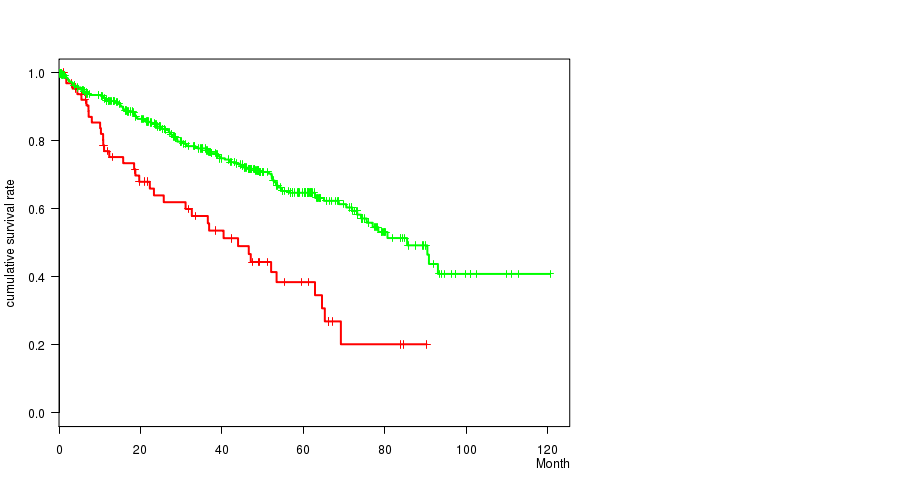
P value = 1.67e-05 (Fisher's exact test), Q value = 0.01
Table S9. Gene #48: '4q loss' versus Clinical Feature #3: 'NEOPLASM.DISEASESTAGE'
| nPatients | STAGE I | STAGE II | STAGE III | STAGE IV |
|---|---|---|---|---|
| ALL | 237 | 54 | 125 | 78 |
| 4Q LOSS MUTATED | 15 | 6 | 24 | 20 |
| 4Q LOSS WILD-TYPE | 222 | 48 | 101 | 58 |
Figure S9. Get High-res Image Gene #48: '4q loss' versus Clinical Feature #3: 'NEOPLASM.DISEASESTAGE'
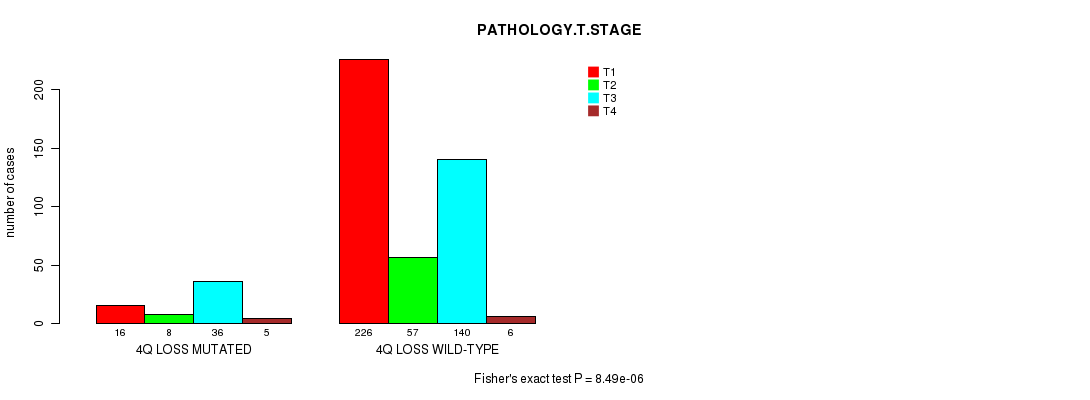
P value = 8.49e-06 (Fisher's exact test), Q value = 0.0051
Table S10. Gene #48: '4q loss' versus Clinical Feature #4: 'PATHOLOGY.T.STAGE'
| nPatients | T1 | T2 | T3 | T4 |
|---|---|---|---|---|
| ALL | 242 | 65 | 176 | 11 |
| 4Q LOSS MUTATED | 16 | 8 | 36 | 5 |
| 4Q LOSS WILD-TYPE | 226 | 57 | 140 | 6 |
Figure S10. Get High-res Image Gene #48: '4q loss' versus Clinical Feature #4: 'PATHOLOGY.T.STAGE'
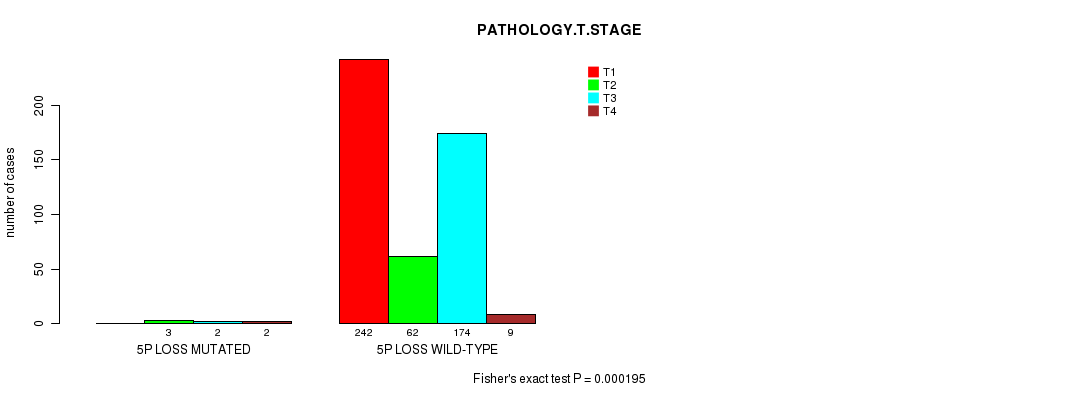
P value = 0.000195 (Fisher's exact test), Q value = 0.11
Table S11. Gene #49: '5p loss' versus Clinical Feature #4: 'PATHOLOGY.T.STAGE'
| nPatients | T1 | T2 | T3 | T4 |
|---|---|---|---|---|
| ALL | 242 | 65 | 176 | 11 |
| 5P LOSS MUTATED | 0 | 3 | 2 | 2 |
| 5P LOSS WILD-TYPE | 242 | 62 | 174 | 9 |
Figure S11. Get High-res Image Gene #49: '5p loss' versus Clinical Feature #4: 'PATHOLOGY.T.STAGE'
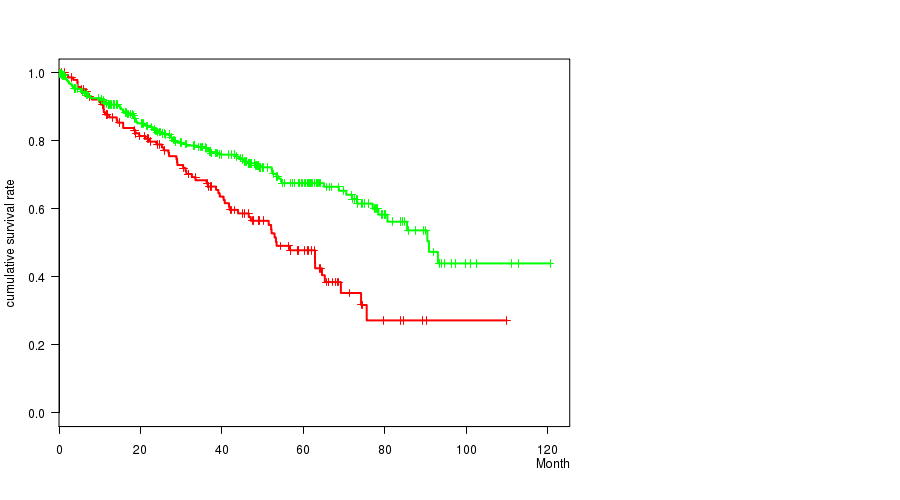
P value = 3.1e-05 (logrank test), Q value = 0.018
Table S12. Gene #56: '9p loss' versus Clinical Feature #1: 'Time to Death'
| nPatients | nDeath | Duration Range (Median), Month | |
|---|---|---|---|
| ALL | 493 | 163 | 0.1 - 120.6 (36.8) |
| 9P LOSS MUTATED | 142 | 67 | 0.2 - 109.9 (34.9) |
| 9P LOSS WILD-TYPE | 351 | 96 | 0.1 - 120.6 (37.0) |
Figure S12. Get High-res Image Gene #56: '9p loss' versus Clinical Feature #1: 'Time to Death'
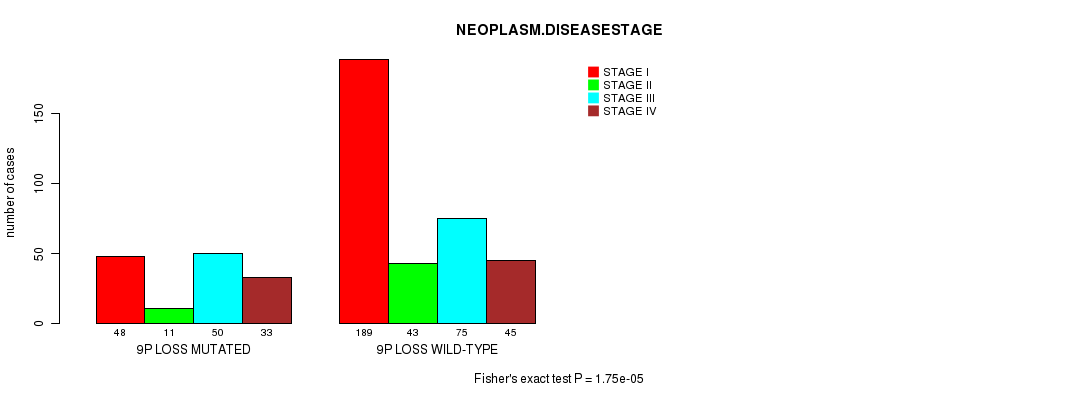
P value = 1.75e-05 (Fisher's exact test), Q value = 0.01
Table S13. Gene #56: '9p loss' versus Clinical Feature #3: 'NEOPLASM.DISEASESTAGE'
| nPatients | STAGE I | STAGE II | STAGE III | STAGE IV |
|---|---|---|---|---|
| ALL | 237 | 54 | 125 | 78 |
| 9P LOSS MUTATED | 48 | 11 | 50 | 33 |
| 9P LOSS WILD-TYPE | 189 | 43 | 75 | 45 |
Figure S13. Get High-res Image Gene #56: '9p loss' versus Clinical Feature #3: 'NEOPLASM.DISEASESTAGE'
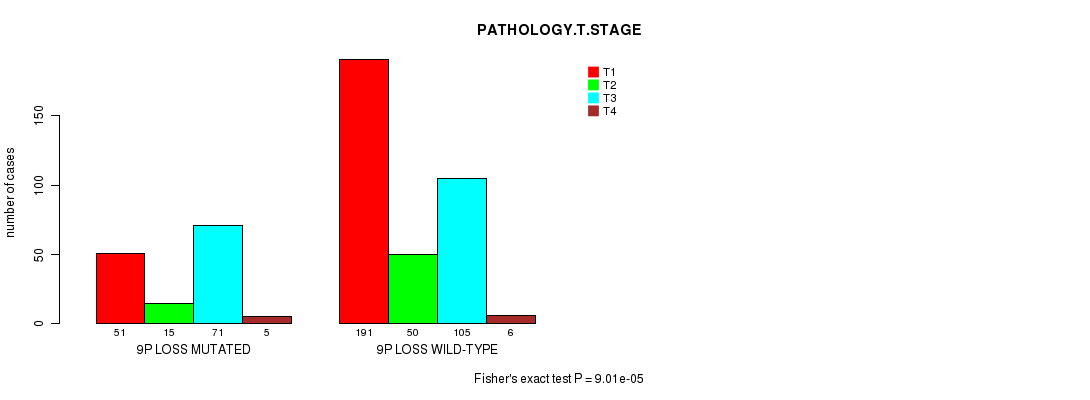
P value = 9.01e-05 (Fisher's exact test), Q value = 0.053
Table S14. Gene #56: '9p loss' versus Clinical Feature #4: 'PATHOLOGY.T.STAGE'
| nPatients | T1 | T2 | T3 | T4 |
|---|---|---|---|---|
| ALL | 242 | 65 | 176 | 11 |
| 9P LOSS MUTATED | 51 | 15 | 71 | 5 |
| 9P LOSS WILD-TYPE | 191 | 50 | 105 | 6 |
Figure S14. Get High-res Image Gene #56: '9p loss' versus Clinical Feature #4: 'PATHOLOGY.T.STAGE'
P value = 0.000152 (logrank test), Q value = 0.09
Table S15. Gene #57: '9q loss' versus Clinical Feature #1: 'Time to Death'
| nPatients | nDeath | Duration Range (Median), Month | |
|---|---|---|---|
| ALL | 493 | 163 | 0.1 - 120.6 (36.8) |
| 9Q LOSS MUTATED | 145 | 67 | 0.2 - 109.9 (36.4) |
| 9Q LOSS WILD-TYPE | 348 | 96 | 0.1 - 120.6 (37.0) |
Figure S15. Get High-res Image Gene #57: '9q loss' versus Clinical Feature #1: 'Time to Death'
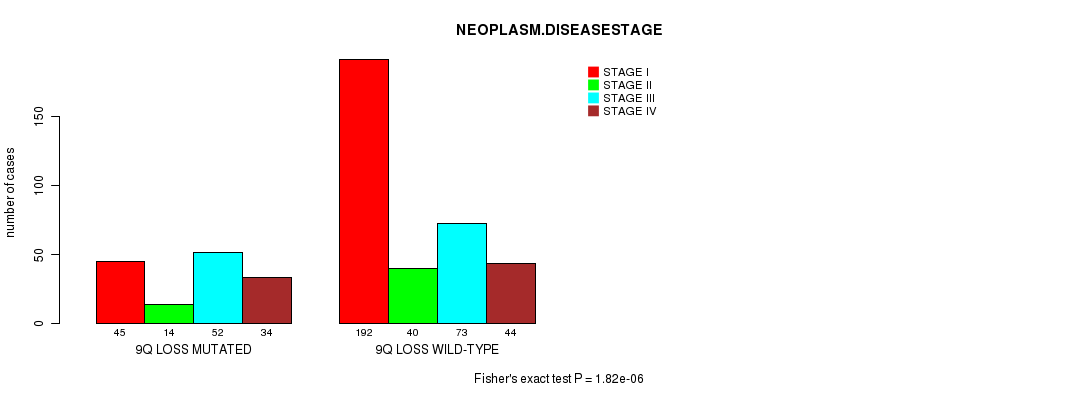
P value = 1.82e-06 (Fisher's exact test), Q value = 0.0011
Table S16. Gene #57: '9q loss' versus Clinical Feature #3: 'NEOPLASM.DISEASESTAGE'
| nPatients | STAGE I | STAGE II | STAGE III | STAGE IV |
|---|---|---|---|---|
| ALL | 237 | 54 | 125 | 78 |
| 9Q LOSS MUTATED | 45 | 14 | 52 | 34 |
| 9Q LOSS WILD-TYPE | 192 | 40 | 73 | 44 |
Figure S16. Get High-res Image Gene #57: '9q loss' versus Clinical Feature #3: 'NEOPLASM.DISEASESTAGE'
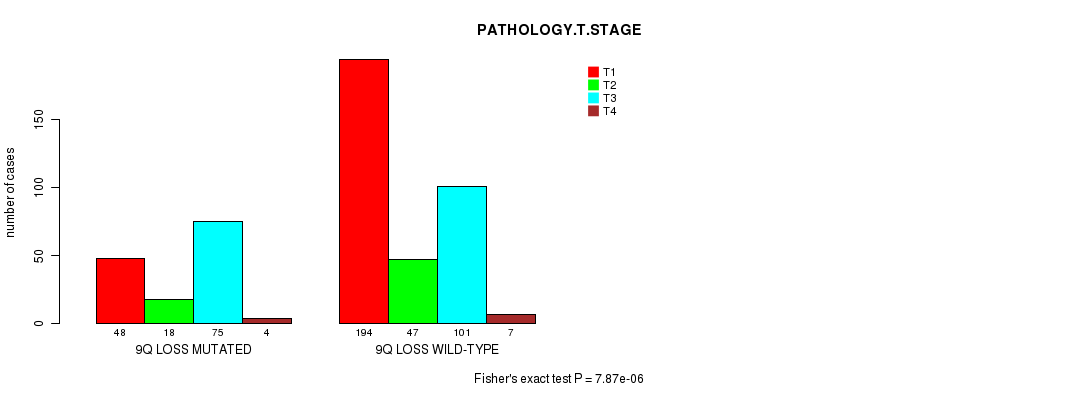
P value = 7.87e-06 (Fisher's exact test), Q value = 0.0047
Table S17. Gene #57: '9q loss' versus Clinical Feature #4: 'PATHOLOGY.T.STAGE'
| nPatients | T1 | T2 | T3 | T4 |
|---|---|---|---|---|
| ALL | 242 | 65 | 176 | 11 |
| 9Q LOSS MUTATED | 48 | 18 | 75 | 4 |
| 9Q LOSS WILD-TYPE | 194 | 47 | 101 | 7 |
Figure S17. Get High-res Image Gene #57: '9q loss' versus Clinical Feature #4: 'PATHOLOGY.T.STAGE'
P value = 0.000224 (Fisher's exact test), Q value = 0.13
Table S18. Gene #64: '13q loss' versus Clinical Feature #3: 'NEOPLASM.DISEASESTAGE'
| nPatients | STAGE I | STAGE II | STAGE III | STAGE IV |
|---|---|---|---|---|
| ALL | 237 | 54 | 125 | 78 |
| 13Q LOSS MUTATED | 23 | 2 | 25 | 19 |
| 13Q LOSS WILD-TYPE | 214 | 52 | 100 | 59 |
Figure S18. Get High-res Image Gene #64: '13q loss' versus Clinical Feature #3: 'NEOPLASM.DISEASESTAGE'
P value = 3.99e-06 (Fisher's exact test), Q value = 0.0024
Table S19. Gene #64: '13q loss' versus Clinical Feature #4: 'PATHOLOGY.T.STAGE'
| nPatients | T1 | T2 | T3 | T4 |
|---|---|---|---|---|
| ALL | 242 | 65 | 176 | 11 |
| 13Q LOSS MUTATED | 25 | 3 | 34 | 7 |
| 13Q LOSS WILD-TYPE | 217 | 62 | 142 | 4 |
Figure S19. Get High-res Image Gene #64: '13q loss' versus Clinical Feature #4: 'PATHOLOGY.T.STAGE'
P value = 4.71e-05 (Fisher's exact test), Q value = 0.028
Table S20. Gene #65: '14q loss' versus Clinical Feature #3: 'NEOPLASM.DISEASESTAGE'
| nPatients | STAGE I | STAGE II | STAGE III | STAGE IV |
|---|---|---|---|---|
| ALL | 237 | 54 | 125 | 78 |
| 14Q LOSS MUTATED | 74 | 26 | 63 | 44 |
| 14Q LOSS WILD-TYPE | 163 | 28 | 62 | 34 |
Figure S20. Get High-res Image Gene #65: '14q loss' versus Clinical Feature #3: 'NEOPLASM.DISEASESTAGE'
P value = 0.000189 (Fisher's exact test), Q value = 0.11
Table S21. Gene #65: '14q loss' versus Clinical Feature #4: 'PATHOLOGY.T.STAGE'
| nPatients | T1 | T2 | T3 | T4 |
|---|---|---|---|---|
| ALL | 242 | 65 | 176 | 11 |
| 14Q LOSS MUTATED | 79 | 34 | 91 | 3 |
| 14Q LOSS WILD-TYPE | 163 | 31 | 85 | 8 |
Figure S21. Get High-res Image Gene #65: '14q loss' versus Clinical Feature #4: 'PATHOLOGY.T.STAGE'
P value = 0.000205 (logrank test), Q value = 0.12
Table S22. Gene #73: '19p loss' versus Clinical Feature #1: 'Time to Death'
| nPatients | nDeath | Duration Range (Median), Month | |
|---|---|---|---|
| ALL | 493 | 163 | 0.1 - 120.6 (36.8) |
| 19P LOSS MUTATED | 11 | 9 | 1.4 - 109.9 (28.5) |
| 19P LOSS WILD-TYPE | 482 | 154 | 0.1 - 120.6 (37.0) |
Figure S22. Get High-res Image Gene #73: '19p loss' versus Clinical Feature #1: 'Time to Death'
-
Copy number data file = transformed.cor.cli.txt
-
Clinical data file = KIRC-TP.merged_data.txt
-
Number of patients = 494
-
Number of significantly arm-level cnvs = 79
-
Number of selected clinical features = 9
-
Exclude regions that fewer than K tumors have mutations, K = 3
For survival clinical features, the Kaplan-Meier survival curves of tumors with and without gene mutations were plotted and the statistical significance P values were estimated by logrank test (Bland and Altman 2004) using the 'survdiff' function in R
For continuous numerical clinical features, two-tailed Student's t test with unequal variance (Lehmann and Romano 2005) was applied to compare the clinical values between tumors with and without gene mutations using 't.test' function in R
For binary or multi-class clinical features (nominal or ordinal), two-tailed Fisher's exact tests (Fisher 1922) were used to estimate the P values using the 'fisher.test' function in R
For multiple hypothesis correction, Q value is the False Discovery Rate (FDR) analogue of the P value (Benjamini and Hochberg 1995), defined as the minimum FDR at which the test may be called significant. We used the 'Benjamini and Hochberg' method of 'p.adjust' function in R to convert P values into Q values.
In addition to the links below, the full results of the analysis summarized in this report can also be downloaded programmatically using firehose_get, or interactively from either the Broad GDAC website or TCGA Data Coordination Center Portal.