This pipeline computes the correlation between significant copy number variation (cnv focal) genes and selected clinical features.
Testing the association between copy number variation 31 focal events and 9 clinical features across 494 patients, 23 significant findings detected with Q value < 0.25.
-
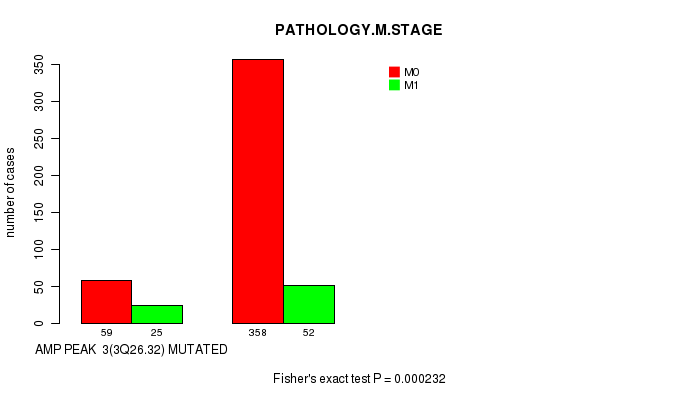
amp_3q26.32 cnv correlated to 'NEOPLASM.DISEASESTAGE', 'PATHOLOGY.T.STAGE', and 'PATHOLOGY.M.STAGE'.
-
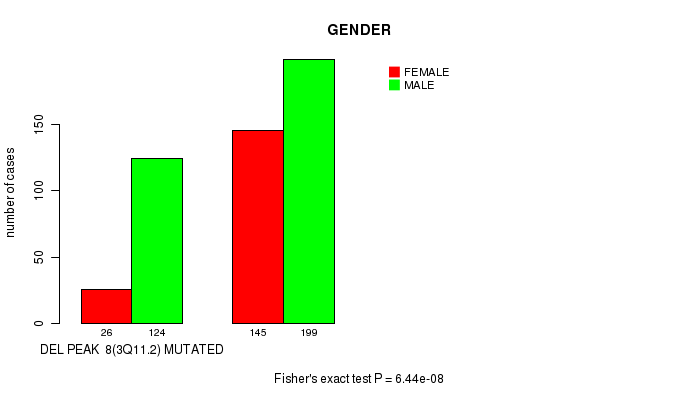
del_3q11.2 cnv correlated to 'GENDER'.
-
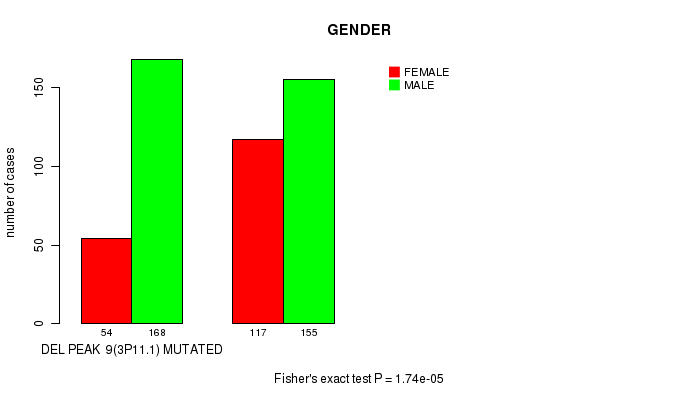
del_3p11.1 cnv correlated to 'GENDER'.
-
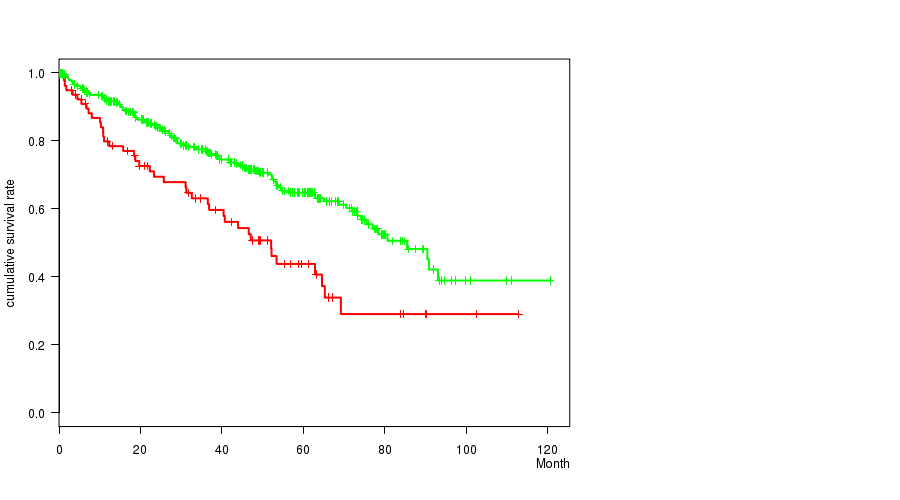
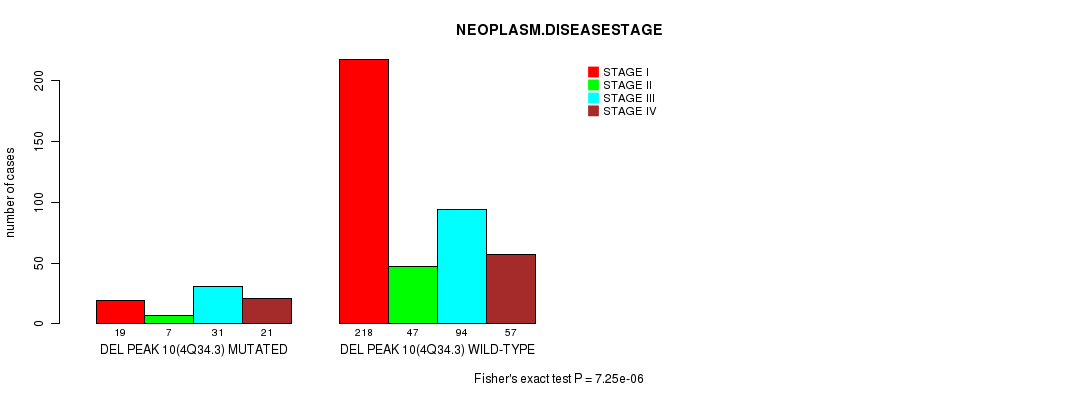
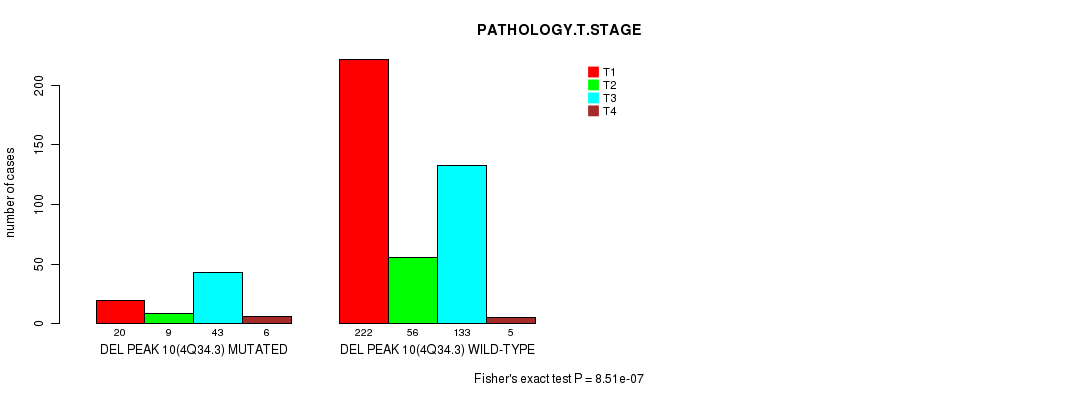
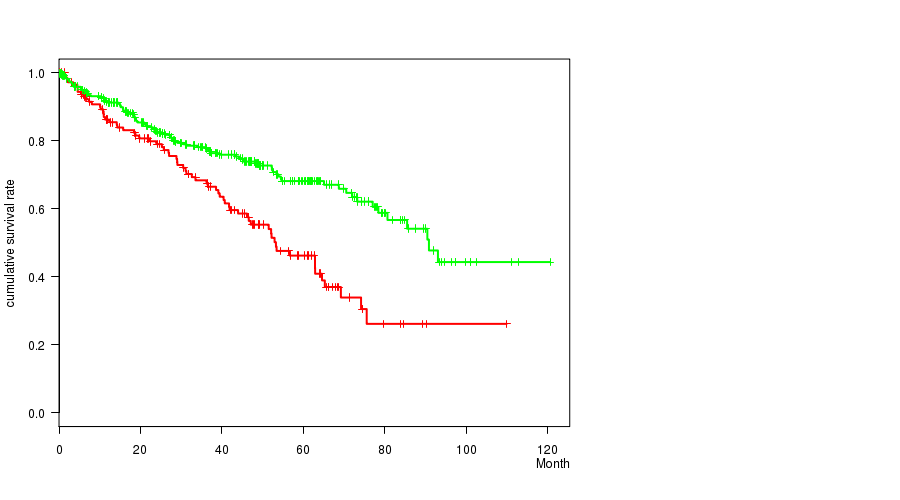
del_4q34.3 cnv correlated to 'Time to Death', 'NEOPLASM.DISEASESTAGE', and 'PATHOLOGY.T.STAGE'.
-
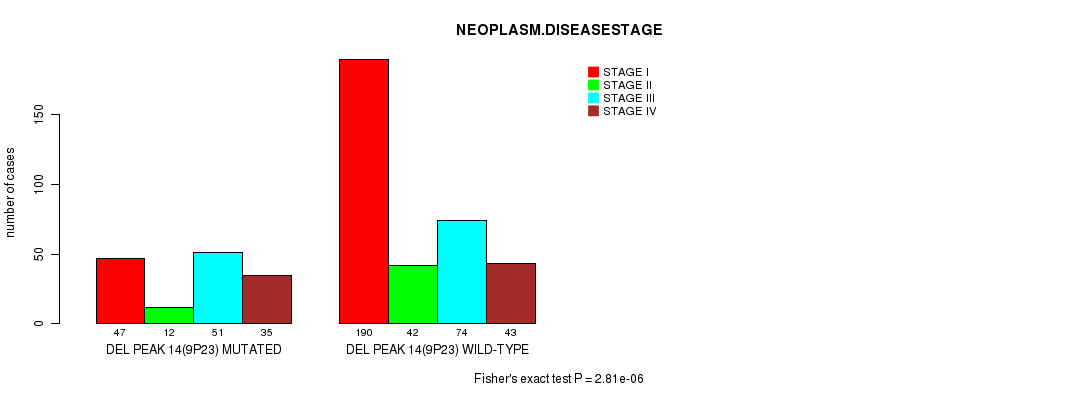
del_9p23 cnv correlated to 'Time to Death', 'NEOPLASM.DISEASESTAGE', and 'PATHOLOGY.T.STAGE'.
-
del_9p21.3 cnv correlated to 'Time to Death', 'NEOPLASM.DISEASESTAGE', 'PATHOLOGY.T.STAGE', 'PATHOLOGY.M.STAGE', and 'GENDER'.
-
del_10q23.31 cnv correlated to 'PATHOLOGY.T.STAGE'.
-
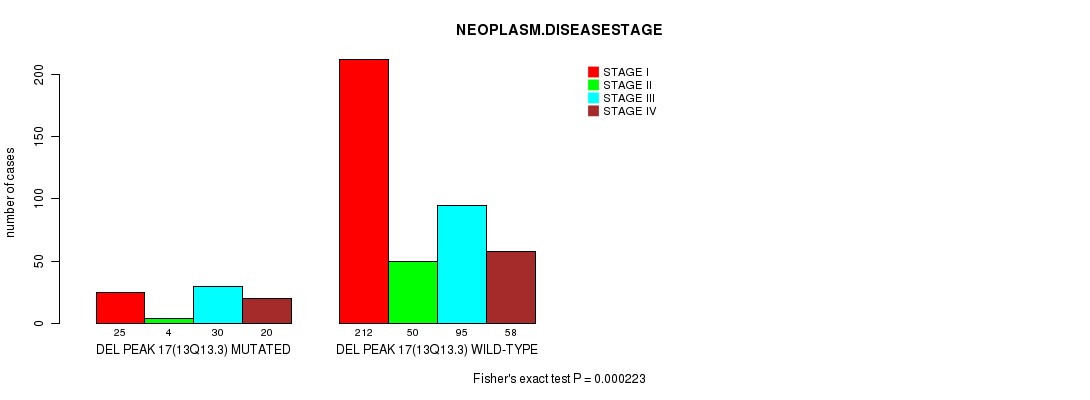
del_13q13.3 cnv correlated to 'Time to Death', 'NEOPLASM.DISEASESTAGE', and 'PATHOLOGY.T.STAGE'.
-
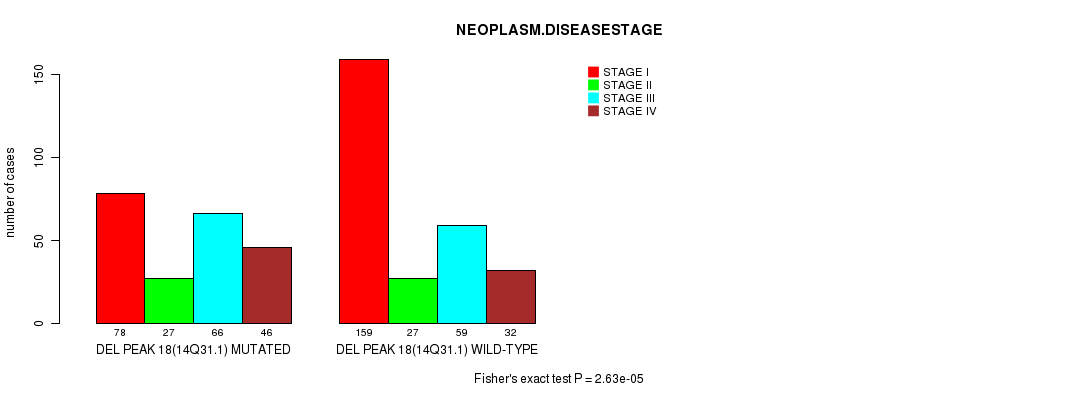
del_14q31.1 cnv correlated to 'NEOPLASM.DISEASESTAGE', 'PATHOLOGY.T.STAGE', and 'PATHOLOGY.N.STAGE'.
Table 1. Get Full Table Overview of the association between significant copy number variation of 31 focal events and 9 clinical features. Shown in the table are P values (Q values). Thresholded by Q value < 0.25, 23 significant findings detected.
|
Clinical Features |
Time to Death |
AGE |
NEOPLASM DISEASESTAGE |
PATHOLOGY T STAGE |
PATHOLOGY N STAGE |
PATHOLOGY M STAGE |
GENDER |
KARNOFSKY PERFORMANCE SCORE |
NUMBERPACKYEARSSMOKED | ||
| nCNV (%) | nWild-Type | logrank test | t-test | Fisher's exact test | Fisher's exact test | Fisher's exact test | Fisher's exact test | Fisher's exact test | t-test | t-test | |
| del 9p21 3 | 153 (31%) | 341 |
3.4e-07 (8.28e-05) |
0.043 (1.00) |
2.26e-08 (5.59e-06) |
1.26e-07 (3.09e-05) |
0.029 (1.00) |
0.000257 (0.0589) |
0.000497 (0.112) |
0.576 (1.00) |
|
| amp 3q26 32 | 84 (17%) | 410 |
0.233 (1.00) |
0.86 (1.00) |
0.000116 (0.0269) |
0.000268 (0.0611) |
0.0593 (1.00) |
0.000232 (0.0535) |
0.454 (1.00) |
0.152 (1.00) |
|
| del 4q34 3 | 78 (16%) | 416 |
0.000278 (0.0632) |
0.684 (1.00) |
7.25e-06 (0.00175) |
8.51e-07 (0.000207) |
0.727 (1.00) |
0.0264 (1.00) |
0.517 (1.00) |
0.193 (1.00) |
|
| del 9p23 | 145 (29%) | 349 |
3.51e-05 (0.00827) |
0.0238 (1.00) |
2.81e-06 (0.00068) |
1.6e-05 (0.00385) |
0.0977 (1.00) |
0.00265 (0.576) |
0.00178 (0.397) |
0.576 (1.00) |
|
| del 13q13 3 | 79 (16%) | 415 |
0.000115 (0.0268) |
0.594 (1.00) |
0.000223 (0.0516) |
2.23e-05 (0.0053) |
0.204 (1.00) |
0.0628 (1.00) |
0.898 (1.00) |
0.669 (1.00) |
|
| del 14q31 1 | 217 (44%) | 277 |
0.00305 (0.659) |
0.0547 (1.00) |
2.63e-05 (0.00624) |
0.000192 (0.0445) |
0.000113 (0.0265) |
0.00113 (0.254) |
0.342 (1.00) |
0.0872 (1.00) |
|
| del 3q11 2 | 150 (30%) | 344 |
0.594 (1.00) |
0.0947 (1.00) |
0.746 (1.00) |
0.103 (1.00) |
0.601 (1.00) |
1 (1.00) |
6.44e-08 (1.58e-05) |
0.703 (1.00) |
|
| del 3p11 1 | 222 (45%) | 272 |
0.278 (1.00) |
0.0328 (1.00) |
0.557 (1.00) |
0.697 (1.00) |
1 (1.00) |
0.386 (1.00) |
1.74e-05 (0.00416) |
0.727 (1.00) |
|
| del 10q23 31 | 93 (19%) | 401 |
0.151 (1.00) |
0.411 (1.00) |
0.0122 (1.00) |
0.000368 (0.0831) |
1 (1.00) |
0.43 (1.00) |
0.053 (1.00) |
0.775 (1.00) |
|
| amp 1q24 1 | 60 (12%) | 434 |
0.0807 (1.00) |
0.164 (1.00) |
0.36 (1.00) |
0.167 (1.00) |
0.0751 (1.00) |
0.342 (1.00) |
0.666 (1.00) |
0.499 (1.00) |
|
| amp 1q32 1 | 60 (12%) | 434 |
0.174 (1.00) |
0.0509 (1.00) |
0.229 (1.00) |
0.145 (1.00) |
0.482 (1.00) |
0.568 (1.00) |
0.666 (1.00) |
0.499 (1.00) |
|
| amp 4q32 1 | 16 (3%) | 478 |
0.188 (1.00) |
0.306 (1.00) |
0.666 (1.00) |
0.386 (1.00) |
0.574 (1.00) |
0.725 (1.00) |
0.434 (1.00) |
0.411 (1.00) |
|
| amp 5q35 1 | 314 (64%) | 180 |
0.0171 (1.00) |
0.0785 (1.00) |
0.701 (1.00) |
0.409 (1.00) |
0.31 (1.00) |
0.367 (1.00) |
0.141 (1.00) |
0.944 (1.00) |
|
| amp 7q36 3 | 168 (34%) | 326 |
0.763 (1.00) |
0.752 (1.00) |
0.0163 (1.00) |
0.0619 (1.00) |
0.447 (1.00) |
0.00256 (0.558) |
0.0282 (1.00) |
0.57 (1.00) |
|
| amp 8q24 22 | 76 (15%) | 418 |
0.0772 (1.00) |
0.00556 (1.00) |
0.00248 (0.544) |
0.00209 (0.463) |
0.74 (1.00) |
0.0398 (1.00) |
0.19 (1.00) |
0.297 (1.00) |
|
| amp 10p14 | 20 (4%) | 474 |
0.81 (1.00) |
0.0443 (1.00) |
0.399 (1.00) |
0.0321 (1.00) |
0.216 (1.00) |
0.533 (1.00) |
0.812 (1.00) |
0.887 (1.00) |
|
| amp 17q24 3 | 40 (8%) | 454 |
0.185 (1.00) |
0.0274 (1.00) |
0.706 (1.00) |
0.559 (1.00) |
0.359 (1.00) |
0.175 (1.00) |
0.863 (1.00) |
0.471 (1.00) |
|
| amp xp22 2 | 30 (6%) | 464 |
0.624 (1.00) |
0.865 (1.00) |
0.0595 (1.00) |
0.112 (1.00) |
1 (1.00) |
0.114 (1.00) |
0.844 (1.00) |
0.328 (1.00) |
|
| amp xp11 4 | 31 (6%) | 463 |
0.942 (1.00) |
0.819 (1.00) |
0.0289 (1.00) |
0.0927 (1.00) |
1 (1.00) |
0.0416 (1.00) |
1 (1.00) |
0.328 (1.00) |
|
| amp xq11 2 | 27 (5%) | 467 |
0.575 (1.00) |
0.347 (1.00) |
0.345 (1.00) |
0.35 (1.00) |
1 (1.00) |
0.409 (1.00) |
0.836 (1.00) |
0.328 (1.00) |
|
| amp xq28 | 33 (7%) | 461 |
0.578 (1.00) |
0.452 (1.00) |
0.507 (1.00) |
0.704 (1.00) |
1 (1.00) |
0.209 (1.00) |
0.573 (1.00) |
0.328 (1.00) |
|
| del 1p36 23 | 100 (20%) | 394 |
0.017 (1.00) |
0.158 (1.00) |
0.351 (1.00) |
0.0981 (1.00) |
1 (1.00) |
0.216 (1.00) |
0.127 (1.00) |
0.513 (1.00) |
|
| del 1p31 1 | 75 (15%) | 419 |
0.14 (1.00) |
0.137 (1.00) |
0.673 (1.00) |
0.0396 (1.00) |
0.494 (1.00) |
0.608 (1.00) |
0.0359 (1.00) |
0.513 (1.00) |
|
| del 1q43 | 40 (8%) | 454 |
0.768 (1.00) |
0.677 (1.00) |
1 (1.00) |
0.168 (1.00) |
1 (1.00) |
0.82 (1.00) |
1 (1.00) |
0.484 (1.00) |
|
| del 2q37 3 | 48 (10%) | 446 |
0.814 (1.00) |
0.912 (1.00) |
0.443 (1.00) |
0.628 (1.00) |
1 (1.00) |
0.403 (1.00) |
0.154 (1.00) |
||
| del 3p25 3 | 435 (88%) | 59 |
0.71 (1.00) |
0.506 (1.00) |
0.0619 (1.00) |
0.00197 (0.437) |
1 (1.00) |
0.848 (1.00) |
0.56 (1.00) |
0.0535 (1.00) |
|
| del 3p24 3 | 436 (88%) | 58 |
0.525 (1.00) |
0.532 (1.00) |
0.0728 (1.00) |
0.00234 (0.515) |
1 (1.00) |
0.848 (1.00) |
0.463 (1.00) |
0.0535 (1.00) |
|
| del 3p12 3 | 313 (63%) | 181 |
0.885 (1.00) |
0.935 (1.00) |
0.396 (1.00) |
0.0591 (1.00) |
0.616 (1.00) |
0.7 (1.00) |
0.0032 (0.688) |
0.963 (1.00) |
|
| del 6q26 | 145 (29%) | 349 |
0.806 (1.00) |
0.328 (1.00) |
0.308 (1.00) |
0.588 (1.00) |
0.00896 (1.00) |
0.5 (1.00) |
0.0223 (1.00) |
0.197 (1.00) |
|
| del 6q26 | 145 (29%) | 349 |
0.831 (1.00) |
0.26 (1.00) |
0.308 (1.00) |
0.588 (1.00) |
0.00896 (1.00) |
0.5 (1.00) |
0.0126 (1.00) |
0.197 (1.00) |
|
| del 8p23 2 | 149 (30%) | 345 |
0.0494 (1.00) |
0.143 (1.00) |
0.137 (1.00) |
0.167 (1.00) |
1 (1.00) |
0.137 (1.00) |
0.356 (1.00) |
0.802 (1.00) |
P value = 0.000116 (Fisher's exact test), Q value = 0.027
Table S1. Gene #3: 'amp_3q26.32' versus Clinical Feature #3: 'NEOPLASM.DISEASESTAGE'
| nPatients | STAGE I | STAGE II | STAGE III | STAGE IV |
|---|---|---|---|---|
| ALL | 237 | 54 | 125 | 78 |
| AMP PEAK 3(3Q26.32) MUTATED | 26 | 6 | 27 | 25 |
| AMP PEAK 3(3Q26.32) WILD-TYPE | 211 | 48 | 98 | 53 |
Figure S1. Get High-res Image Gene #3: 'amp_3q26.32' versus Clinical Feature #3: 'NEOPLASM.DISEASESTAGE'

P value = 0.000268 (Fisher's exact test), Q value = 0.061
Table S2. Gene #3: 'amp_3q26.32' versus Clinical Feature #4: 'PATHOLOGY.T.STAGE'
| nPatients | T1 | T2 | T3 | T4 |
|---|---|---|---|---|
| ALL | 242 | 65 | 176 | 11 |
| AMP PEAK 3(3Q26.32) MUTATED | 27 | 8 | 45 | 4 |
| AMP PEAK 3(3Q26.32) WILD-TYPE | 215 | 57 | 131 | 7 |
Figure S2. Get High-res Image Gene #3: 'amp_3q26.32' versus Clinical Feature #4: 'PATHOLOGY.T.STAGE'

P value = 0.000232 (Fisher's exact test), Q value = 0.053
Table S3. Gene #3: 'amp_3q26.32' versus Clinical Feature #6: 'PATHOLOGY.M.STAGE'
| nPatients | M0 | M1 |
|---|---|---|
| ALL | 417 | 77 |
| AMP PEAK 3(3Q26.32) MUTATED | 59 | 25 |
| AMP PEAK 3(3Q26.32) WILD-TYPE | 358 | 52 |
Figure S3. Get High-res Image Gene #3: 'amp_3q26.32' versus Clinical Feature #6: 'PATHOLOGY.M.STAGE'
P value = 6.44e-08 (Fisher's exact test), Q value = 1.6e-05
Table S4. Gene #21: 'del_3q11.2' versus Clinical Feature #7: 'GENDER'
| nPatients | FEMALE | MALE |
|---|---|---|
| ALL | 171 | 323 |
| DEL PEAK 8(3Q11.2) MUTATED | 26 | 124 |
| DEL PEAK 8(3Q11.2) WILD-TYPE | 145 | 199 |
Figure S4. Get High-res Image Gene #21: 'del_3q11.2' versus Clinical Feature #7: 'GENDER'
P value = 1.74e-05 (Fisher's exact test), Q value = 0.0042
Table S5. Gene #22: 'del_3p11.1' versus Clinical Feature #7: 'GENDER'
| nPatients | FEMALE | MALE |
|---|---|---|
| ALL | 171 | 323 |
| DEL PEAK 9(3P11.1) MUTATED | 54 | 168 |
| DEL PEAK 9(3P11.1) WILD-TYPE | 117 | 155 |
Figure S5. Get High-res Image Gene #22: 'del_3p11.1' versus Clinical Feature #7: 'GENDER'
P value = 0.000278 (logrank test), Q value = 0.063
Table S6. Gene #23: 'del_4q34.3' versus Clinical Feature #1: 'Time to Death'
| nPatients | nDeath | Duration Range (Median), Month | |
|---|---|---|---|
| ALL | 493 | 163 | 0.1 - 120.6 (36.8) |
| DEL PEAK 10(4Q34.3) MUTATED | 78 | 40 | 0.6 - 112.8 (33.0) |
| DEL PEAK 10(4Q34.3) WILD-TYPE | 415 | 123 | 0.1 - 120.6 (37.0) |
Figure S6. Get High-res Image Gene #23: 'del_4q34.3' versus Clinical Feature #1: 'Time to Death'
P value = 7.25e-06 (Fisher's exact test), Q value = 0.0017
Table S7. Gene #23: 'del_4q34.3' versus Clinical Feature #3: 'NEOPLASM.DISEASESTAGE'
| nPatients | STAGE I | STAGE II | STAGE III | STAGE IV |
|---|---|---|---|---|
| ALL | 237 | 54 | 125 | 78 |
| DEL PEAK 10(4Q34.3) MUTATED | 19 | 7 | 31 | 21 |
| DEL PEAK 10(4Q34.3) WILD-TYPE | 218 | 47 | 94 | 57 |
Figure S7. Get High-res Image Gene #23: 'del_4q34.3' versus Clinical Feature #3: 'NEOPLASM.DISEASESTAGE'
P value = 8.51e-07 (Fisher's exact test), Q value = 0.00021
Table S8. Gene #23: 'del_4q34.3' versus Clinical Feature #4: 'PATHOLOGY.T.STAGE'
| nPatients | T1 | T2 | T3 | T4 |
|---|---|---|---|---|
| ALL | 242 | 65 | 176 | 11 |
| DEL PEAK 10(4Q34.3) MUTATED | 20 | 9 | 43 | 6 |
| DEL PEAK 10(4Q34.3) WILD-TYPE | 222 | 56 | 133 | 5 |
Figure S8. Get High-res Image Gene #23: 'del_4q34.3' versus Clinical Feature #4: 'PATHOLOGY.T.STAGE'
P value = 3.51e-05 (logrank test), Q value = 0.0083
Table S9. Gene #27: 'del_9p23' versus Clinical Feature #1: 'Time to Death'
| nPatients | nDeath | Duration Range (Median), Month | |
|---|---|---|---|
| ALL | 493 | 163 | 0.1 - 120.6 (36.8) |
| DEL PEAK 14(9P23) MUTATED | 145 | 68 | 0.2 - 109.9 (36.2) |
| DEL PEAK 14(9P23) WILD-TYPE | 348 | 95 | 0.1 - 120.6 (37.0) |
Figure S9. Get High-res Image Gene #27: 'del_9p23' versus Clinical Feature #1: 'Time to Death'
P value = 2.81e-06 (Fisher's exact test), Q value = 0.00068
Table S10. Gene #27: 'del_9p23' versus Clinical Feature #3: 'NEOPLASM.DISEASESTAGE'
| nPatients | STAGE I | STAGE II | STAGE III | STAGE IV |
|---|---|---|---|---|
| ALL | 237 | 54 | 125 | 78 |
| DEL PEAK 14(9P23) MUTATED | 47 | 12 | 51 | 35 |
| DEL PEAK 14(9P23) WILD-TYPE | 190 | 42 | 74 | 43 |
Figure S10. Get High-res Image Gene #27: 'del_9p23' versus Clinical Feature #3: 'NEOPLASM.DISEASESTAGE'
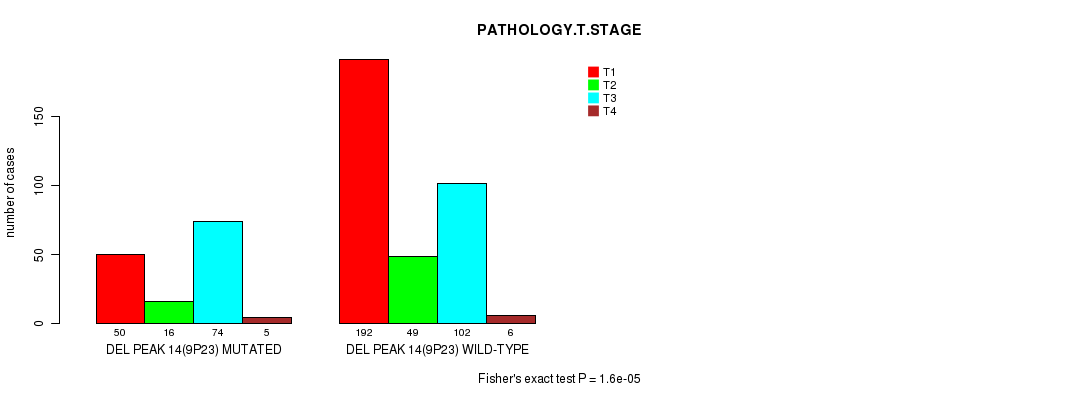
P value = 1.6e-05 (Fisher's exact test), Q value = 0.0039
Table S11. Gene #27: 'del_9p23' versus Clinical Feature #4: 'PATHOLOGY.T.STAGE'
| nPatients | T1 | T2 | T3 | T4 |
|---|---|---|---|---|
| ALL | 242 | 65 | 176 | 11 |
| DEL PEAK 14(9P23) MUTATED | 50 | 16 | 74 | 5 |
| DEL PEAK 14(9P23) WILD-TYPE | 192 | 49 | 102 | 6 |
Figure S11. Get High-res Image Gene #27: 'del_9p23' versus Clinical Feature #4: 'PATHOLOGY.T.STAGE'
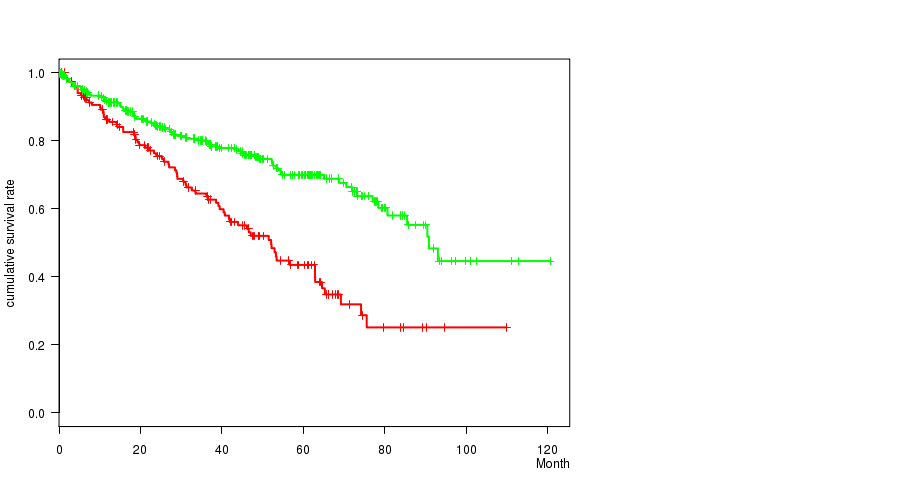
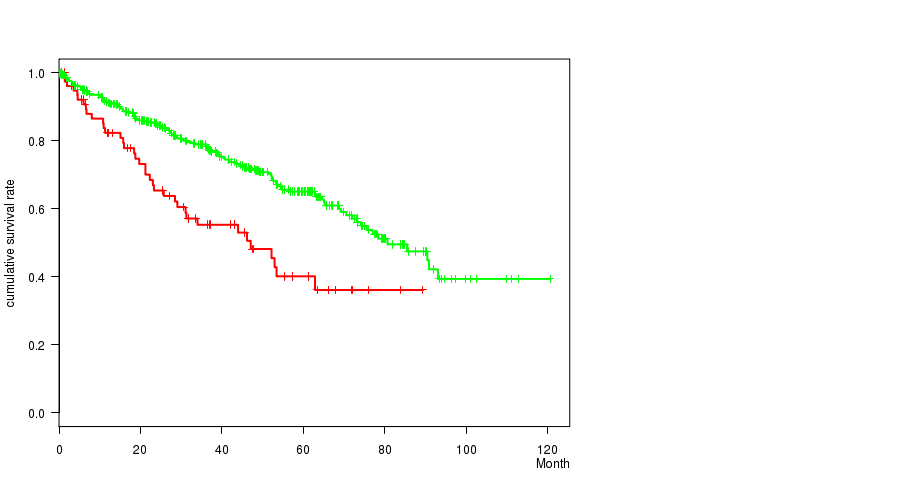
P value = 3.4e-07 (logrank test), Q value = 8.3e-05
Table S12. Gene #28: 'del_9p21.3' versus Clinical Feature #1: 'Time to Death'
| nPatients | nDeath | Duration Range (Median), Month | |
|---|---|---|---|
| ALL | 493 | 163 | 0.1 - 120.6 (36.8) |
| DEL PEAK 15(9P21.3) MUTATED | 153 | 75 | 0.2 - 109.9 (31.8) |
| DEL PEAK 15(9P21.3) WILD-TYPE | 340 | 88 | 0.1 - 120.6 (37.2) |
Figure S12. Get High-res Image Gene #28: 'del_9p21.3' versus Clinical Feature #1: 'Time to Death'
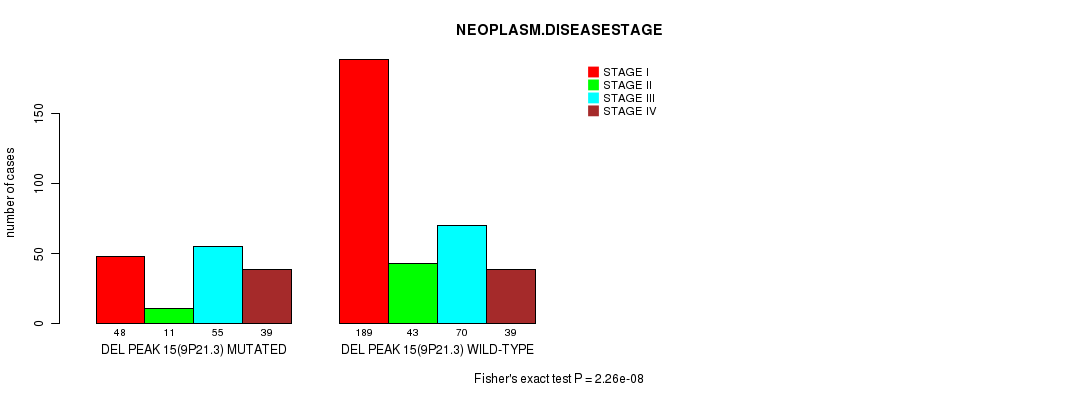
P value = 2.26e-08 (Fisher's exact test), Q value = 5.6e-06
Table S13. Gene #28: 'del_9p21.3' versus Clinical Feature #3: 'NEOPLASM.DISEASESTAGE'
| nPatients | STAGE I | STAGE II | STAGE III | STAGE IV |
|---|---|---|---|---|
| ALL | 237 | 54 | 125 | 78 |
| DEL PEAK 15(9P21.3) MUTATED | 48 | 11 | 55 | 39 |
| DEL PEAK 15(9P21.3) WILD-TYPE | 189 | 43 | 70 | 39 |
Figure S13. Get High-res Image Gene #28: 'del_9p21.3' versus Clinical Feature #3: 'NEOPLASM.DISEASESTAGE'
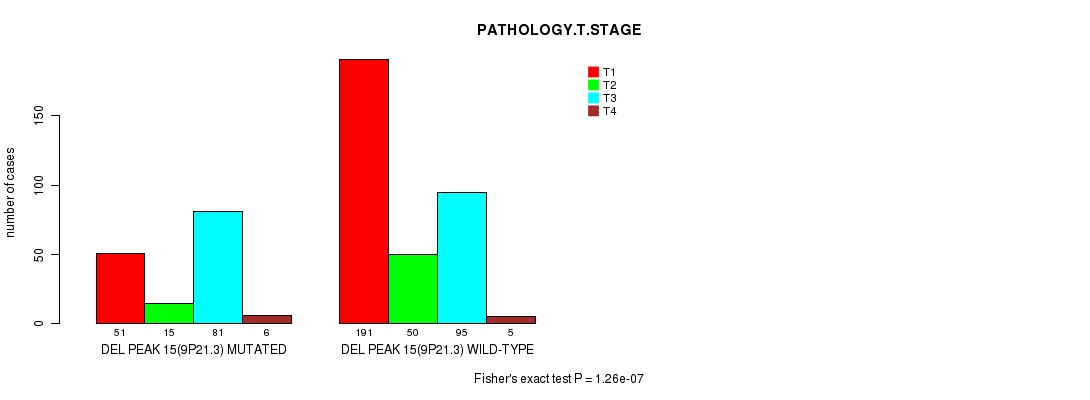
P value = 1.26e-07 (Fisher's exact test), Q value = 3.1e-05
Table S14. Gene #28: 'del_9p21.3' versus Clinical Feature #4: 'PATHOLOGY.T.STAGE'
| nPatients | T1 | T2 | T3 | T4 |
|---|---|---|---|---|
| ALL | 242 | 65 | 176 | 11 |
| DEL PEAK 15(9P21.3) MUTATED | 51 | 15 | 81 | 6 |
| DEL PEAK 15(9P21.3) WILD-TYPE | 191 | 50 | 95 | 5 |
Figure S14. Get High-res Image Gene #28: 'del_9p21.3' versus Clinical Feature #4: 'PATHOLOGY.T.STAGE'
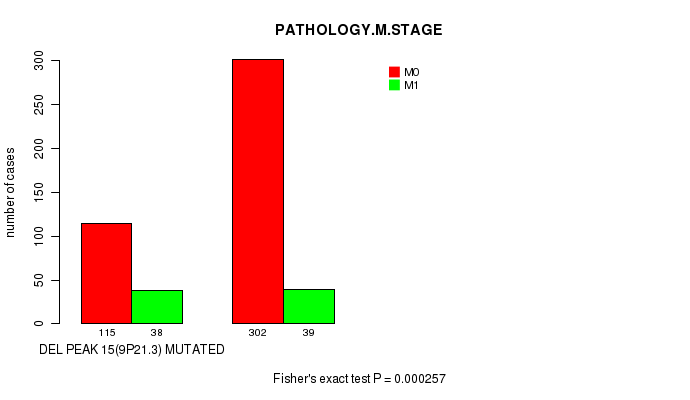
P value = 0.000257 (Fisher's exact test), Q value = 0.059
Table S15. Gene #28: 'del_9p21.3' versus Clinical Feature #6: 'PATHOLOGY.M.STAGE'
| nPatients | M0 | M1 |
|---|---|---|
| ALL | 417 | 77 |
| DEL PEAK 15(9P21.3) MUTATED | 115 | 38 |
| DEL PEAK 15(9P21.3) WILD-TYPE | 302 | 39 |
Figure S15. Get High-res Image Gene #28: 'del_9p21.3' versus Clinical Feature #6: 'PATHOLOGY.M.STAGE'
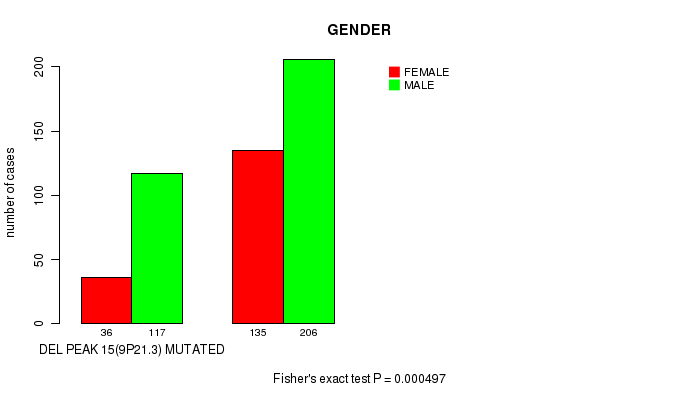
P value = 0.000497 (Fisher's exact test), Q value = 0.11
Table S16. Gene #28: 'del_9p21.3' versus Clinical Feature #7: 'GENDER'
| nPatients | FEMALE | MALE |
|---|---|---|
| ALL | 171 | 323 |
| DEL PEAK 15(9P21.3) MUTATED | 36 | 117 |
| DEL PEAK 15(9P21.3) WILD-TYPE | 135 | 206 |
Figure S16. Get High-res Image Gene #28: 'del_9p21.3' versus Clinical Feature #7: 'GENDER'
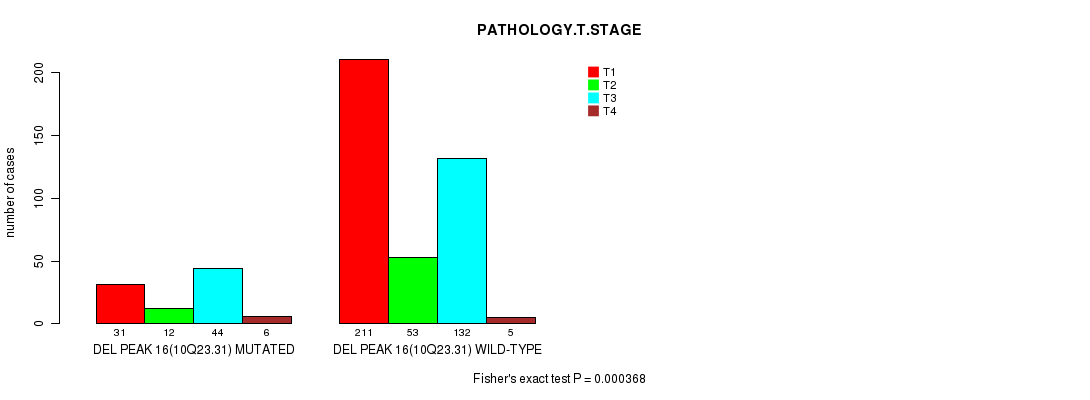
P value = 0.000368 (Fisher's exact test), Q value = 0.083
Table S17. Gene #29: 'del_10q23.31' versus Clinical Feature #4: 'PATHOLOGY.T.STAGE'
| nPatients | T1 | T2 | T3 | T4 |
|---|---|---|---|---|
| ALL | 242 | 65 | 176 | 11 |
| DEL PEAK 16(10Q23.31) MUTATED | 31 | 12 | 44 | 6 |
| DEL PEAK 16(10Q23.31) WILD-TYPE | 211 | 53 | 132 | 5 |
Figure S17. Get High-res Image Gene #29: 'del_10q23.31' versus Clinical Feature #4: 'PATHOLOGY.T.STAGE'
P value = 0.000115 (logrank test), Q value = 0.027
Table S18. Gene #30: 'del_13q13.3' versus Clinical Feature #1: 'Time to Death'
| nPatients | nDeath | Duration Range (Median), Month | |
|---|---|---|---|
| ALL | 493 | 163 | 0.1 - 120.6 (36.8) |
| DEL PEAK 17(13Q13.3) MUTATED | 79 | 37 | 0.2 - 89.4 (27.0) |
| DEL PEAK 17(13Q13.3) WILD-TYPE | 414 | 126 | 0.1 - 120.6 (37.4) |
Figure S18. Get High-res Image Gene #30: 'del_13q13.3' versus Clinical Feature #1: 'Time to Death'
P value = 0.000223 (Fisher's exact test), Q value = 0.052
Table S19. Gene #30: 'del_13q13.3' versus Clinical Feature #3: 'NEOPLASM.DISEASESTAGE'
| nPatients | STAGE I | STAGE II | STAGE III | STAGE IV |
|---|---|---|---|---|
| ALL | 237 | 54 | 125 | 78 |
| DEL PEAK 17(13Q13.3) MUTATED | 25 | 4 | 30 | 20 |
| DEL PEAK 17(13Q13.3) WILD-TYPE | 212 | 50 | 95 | 58 |
Figure S19. Get High-res Image Gene #30: 'del_13q13.3' versus Clinical Feature #3: 'NEOPLASM.DISEASESTAGE'
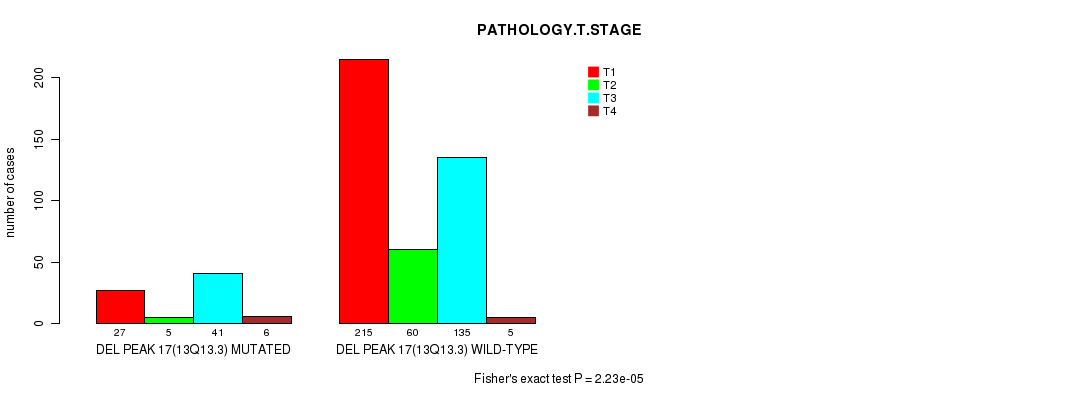
P value = 2.23e-05 (Fisher's exact test), Q value = 0.0053
Table S20. Gene #30: 'del_13q13.3' versus Clinical Feature #4: 'PATHOLOGY.T.STAGE'
| nPatients | T1 | T2 | T3 | T4 |
|---|---|---|---|---|
| ALL | 242 | 65 | 176 | 11 |
| DEL PEAK 17(13Q13.3) MUTATED | 27 | 5 | 41 | 6 |
| DEL PEAK 17(13Q13.3) WILD-TYPE | 215 | 60 | 135 | 5 |
Figure S20. Get High-res Image Gene #30: 'del_13q13.3' versus Clinical Feature #4: 'PATHOLOGY.T.STAGE'
P value = 2.63e-05 (Fisher's exact test), Q value = 0.0062
Table S21. Gene #31: 'del_14q31.1' versus Clinical Feature #3: 'NEOPLASM.DISEASESTAGE'
| nPatients | STAGE I | STAGE II | STAGE III | STAGE IV |
|---|---|---|---|---|
| ALL | 237 | 54 | 125 | 78 |
| DEL PEAK 18(14Q31.1) MUTATED | 78 | 27 | 66 | 46 |
| DEL PEAK 18(14Q31.1) WILD-TYPE | 159 | 27 | 59 | 32 |
Figure S21. Get High-res Image Gene #31: 'del_14q31.1' versus Clinical Feature #3: 'NEOPLASM.DISEASESTAGE'
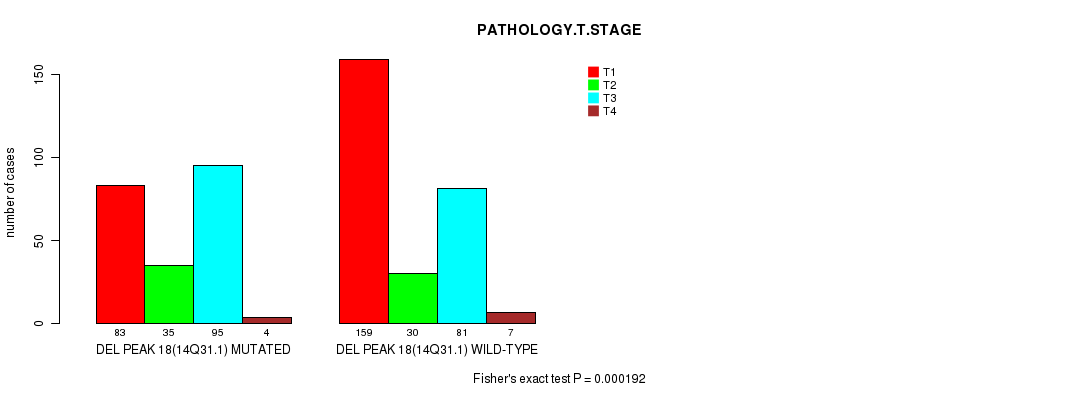
P value = 0.000192 (Fisher's exact test), Q value = 0.045
Table S22. Gene #31: 'del_14q31.1' versus Clinical Feature #4: 'PATHOLOGY.T.STAGE'
| nPatients | T1 | T2 | T3 | T4 |
|---|---|---|---|---|
| ALL | 242 | 65 | 176 | 11 |
| DEL PEAK 18(14Q31.1) MUTATED | 83 | 35 | 95 | 4 |
| DEL PEAK 18(14Q31.1) WILD-TYPE | 159 | 30 | 81 | 7 |
Figure S22. Get High-res Image Gene #31: 'del_14q31.1' versus Clinical Feature #4: 'PATHOLOGY.T.STAGE'
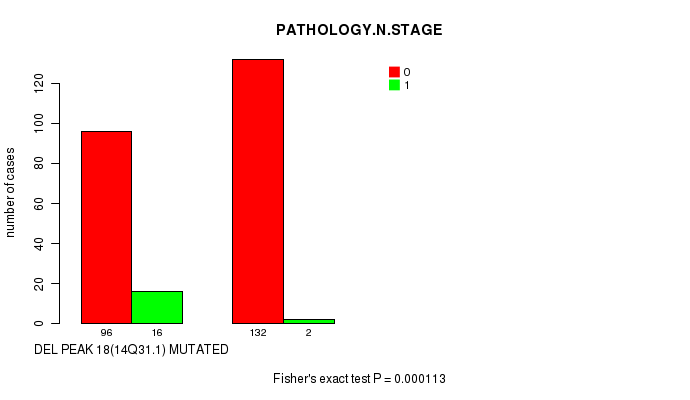
P value = 0.000113 (Fisher's exact test), Q value = 0.027
Table S23. Gene #31: 'del_14q31.1' versus Clinical Feature #5: 'PATHOLOGY.N.STAGE'
| nPatients | 0 | 1 |
|---|---|---|
| ALL | 228 | 18 |
| DEL PEAK 18(14Q31.1) MUTATED | 96 | 16 |
| DEL PEAK 18(14Q31.1) WILD-TYPE | 132 | 2 |
Figure S23. Get High-res Image Gene #31: 'del_14q31.1' versus Clinical Feature #5: 'PATHOLOGY.N.STAGE'
-
Copy number data file = transformed.cor.cli.txt
-
Clinical data file = KIRC-TP.merged_data.txt
-
Number of patients = 494
-
Number of significantly focal cnvs = 31
-
Number of selected clinical features = 9
-
Exclude genes that fewer than K tumors have mutations, K = 3
For survival clinical features, the Kaplan-Meier survival curves of tumors with and without gene mutations were plotted and the statistical significance P values were estimated by logrank test (Bland and Altman 2004) using the 'survdiff' function in R
For continuous numerical clinical features, two-tailed Student's t test with unequal variance (Lehmann and Romano 2005) was applied to compare the clinical values between tumors with and without gene mutations using 't.test' function in R
For binary or multi-class clinical features (nominal or ordinal), two-tailed Fisher's exact tests (Fisher 1922) were used to estimate the P values using the 'fisher.test' function in R
For multiple hypothesis correction, Q value is the False Discovery Rate (FDR) analogue of the P value (Benjamini and Hochberg 1995), defined as the minimum FDR at which the test may be called significant. We used the 'Benjamini and Hochberg' method of 'p.adjust' function in R to convert P values into Q values.
In addition to the links below, the full results of the analysis summarized in this report can also be downloaded programmatically using firehose_get, or interactively from either the Broad GDAC website or TCGA Data Coordination Center Portal.