This pipeline uses various statistical tests to identify mRNAs whose expression levels correlated to selected clinical features.
Testing the association between 18283 genes and 9 clinical features across 497 samples, statistically thresholded by Q value < 0.05, 6 clinical features related to at least one genes.
-
26 genes correlated to 'AGE'.
-
RANBP17|64901 , RFPL1S|10740 , WFDC1|58189 , PALLD|23022 , NEFH|4744 , ...
-
1573 genes correlated to 'NEOPLASM.DISEASESTAGE'.
-
PLEKHA9|51054 , NR3C2|4306 , IL20RB|53833 , FKBP11|51303 , UBE2C|11065 , ...
-
2198 genes correlated to 'PATHOLOGY.T.STAGE'.
-
NR3C2|4306 , ZNF132|7691 , PLEKHA9|51054 , FKBP11|51303 , FAM122A|116224 , ...
-
7 genes correlated to 'PATHOLOGY.N.STAGE'.
-
C11ORF34|349633 , PITX2|5308 , ATP6V1D|51382 , HEMGN|55363 , C9ORF135|138255 , ...
-
266 genes correlated to 'PATHOLOGY.M.STAGE'.
-
GARNL3|84253 , IL20RB|53833 , NFE2L3|9603 , PLEKHA9|51054 , PPIAL4G|644591 , ...
-
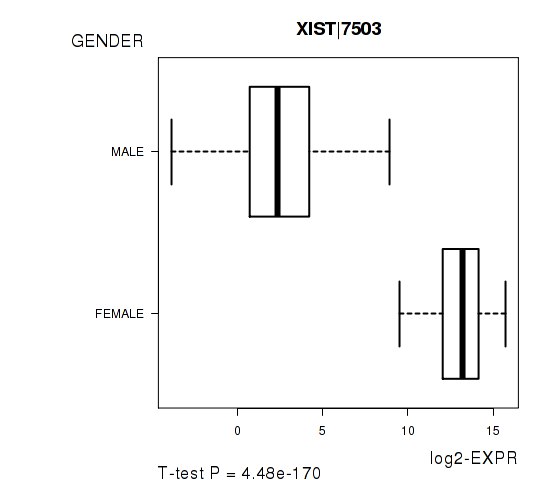
241 genes correlated to 'GENDER'.
-
XIST|7503 , PRKY|5616 , NLGN4Y|22829 , RPS4Y1|6192 , ZFY|7544 , ...
-
No genes correlated to 'Time to Death', 'KARNOFSKY.PERFORMANCE.SCORE', and 'NUMBERPACKYEARSSMOKED'.
Complete statistical result table is provided in Supplement Table 1
Table 1. Get Full Table This table shows the clinical features, statistical methods used, and the number of genes that are significantly associated with each clinical feature at Q value < 0.05.
| Clinical feature | Statistical test | Significant genes | Associated with | Associated with | ||
|---|---|---|---|---|---|---|
| Time to Death | Cox regression test | N=0 | ||||
| AGE | Spearman correlation test | N=26 | older | N=4 | younger | N=22 |
| NEOPLASM DISEASESTAGE | ANOVA test | N=1573 | ||||
| PATHOLOGY T STAGE | Spearman correlation test | N=2198 | higher stage | N=1188 | lower stage | N=1010 |
| PATHOLOGY N STAGE | t test | N=7 | class1 | N=2 | class0 | N=5 |
| PATHOLOGY M STAGE | t test | N=266 | m1 | N=231 | m0 | N=35 |
| GENDER | t test | N=241 | male | N=145 | female | N=96 |
| KARNOFSKY PERFORMANCE SCORE | Spearman correlation test | N=0 | ||||
| NUMBERPACKYEARSSMOKED | Spearman correlation test | N=0 |
Table S1. Basic characteristics of clinical feature: 'Time to Death'
| Time to Death | Duration (Months) | 0.1-120.6 (median=36.5) |
| censored | N = 335 | |
| death | N = 162 | |
| Significant markers | N = 0 |
Table S2. Basic characteristics of clinical feature: 'AGE'
| AGE | Mean (SD) | 60.71 (12) |
| Significant markers | N = 26 | |
| pos. correlated | 4 | |
| neg. correlated | 22 |
Table S3. Get Full Table List of top 10 genes significantly correlated to 'AGE' by Spearman correlation test
| SpearmanCorr | corrP | Q | |
|---|---|---|---|
| RANBP17|64901 | -0.2671 | 1.499e-09 | 2.74e-05 |
| RFPL1S|10740 | -0.2605 | 5.021e-09 | 9.18e-05 |
| WFDC1|58189 | -0.2584 | 5.227e-09 | 9.56e-05 |
| PALLD|23022 | -0.2445 | 3.497e-08 | 0.000639 |
| NEFH|4744 | -0.2439 | 3.786e-08 | 0.000692 |
| UTY|7404 | -0.2769 | 5.024e-08 | 0.000918 |
| DIO2|1734 | -0.2332 | 1.541e-07 | 0.00282 |
| NKAPL|222698 | -0.2236 | 5.009e-07 | 0.00915 |
| MAPKAPK2|9261 | 0.2214 | 6.346e-07 | 0.0116 |
| ZFY|7544 | -0.2379 | 6.371e-07 | 0.0116 |
Figure S1. Get High-res Image As an example, this figure shows the association of RANBP17|64901 to 'AGE'. P value = 1.5e-09 with Spearman correlation analysis. The straight line presents the best linear regression.
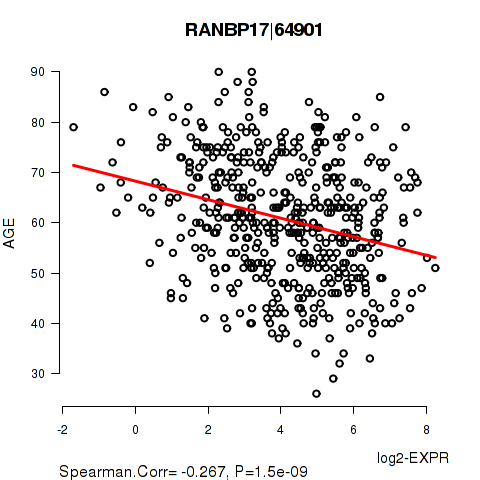
Table S4. Basic characteristics of clinical feature: 'NEOPLASM.DISEASESTAGE'
| NEOPLASM.DISEASESTAGE | Labels | N |
| STAGE I | 240 | |
| STAGE II | 54 | |
| STAGE III | 124 | |
| STAGE IV | 79 | |
| Significant markers | N = 1573 |
Table S5. Get Full Table List of top 10 genes differentially expressed by 'NEOPLASM.DISEASESTAGE'
| ANOVA_P | Q | |
|---|---|---|
| PLEKHA9|51054 | 4.22e-17 | 7.72e-13 |
| NR3C2|4306 | 5.6e-17 | 1.02e-12 |
| IL20RB|53833 | 2.025e-16 | 3.7e-12 |
| FKBP11|51303 | 2.434e-16 | 4.45e-12 |
| UBE2C|11065 | 4.415e-16 | 8.07e-12 |
| INHBE|83729 | 5.022e-16 | 9.18e-12 |
| ACADSB|36 | 7.667e-16 | 1.4e-11 |
| ALDH6A1|4329 | 7.888e-16 | 1.44e-11 |
| CEP55|55165 | 1.414e-15 | 2.58e-11 |
| UFSP2|55325 | 1.957e-15 | 3.58e-11 |
Figure S2. Get High-res Image As an example, this figure shows the association of PLEKHA9|51054 to 'NEOPLASM.DISEASESTAGE'. P value = 4.22e-17 with ANOVA analysis.
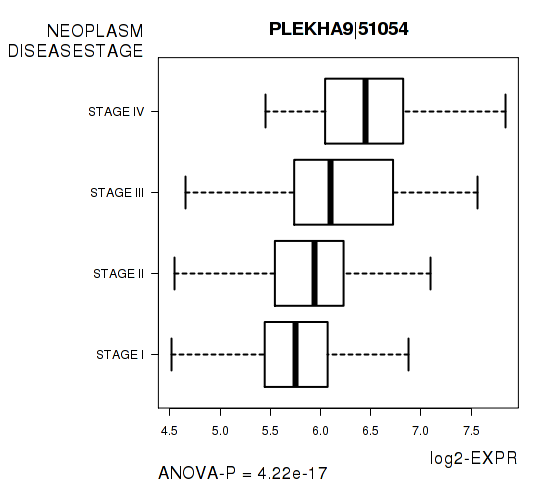
Table S6. Basic characteristics of clinical feature: 'PATHOLOGY.T.STAGE'
| PATHOLOGY.T.STAGE | Mean (SD) | 1.91 (0.96) |
| N | ||
| 1 | 245 | |
| 2 | 65 | |
| 3 | 176 | |
| 4 | 11 | |
| Significant markers | N = 2198 | |
| pos. correlated | 1188 | |
| neg. correlated | 1010 |
Table S7. Get Full Table List of top 10 genes significantly correlated to 'PATHOLOGY.T.STAGE' by Spearman correlation test
| SpearmanCorr | corrP | Q | |
|---|---|---|---|
| NR3C2|4306 | -0.3871 | 3.263e-19 | 5.96e-15 |
| ZNF132|7691 | -0.374 | 6.043e-18 | 1.1e-13 |
| PLEKHA9|51054 | 0.3689 | 1.822e-17 | 3.33e-13 |
| FKBP11|51303 | 0.3669 | 2.77e-17 | 5.06e-13 |
| FAM122A|116224 | -0.3584 | 1.662e-16 | 3.04e-12 |
| TSPAN7|7102 | -0.3558 | 2.823e-16 | 5.16e-12 |
| TMEM150C|441027 | -0.3544 | 3.719e-16 | 6.8e-12 |
| ANKRD56|345079 | -0.3518 | 6.774e-16 | 1.24e-11 |
| EMCN|51705 | -0.3503 | 8.538e-16 | 1.56e-11 |
| NOP2|4839 | 0.3498 | 9.454e-16 | 1.73e-11 |
Figure S3. Get High-res Image As an example, this figure shows the association of NR3C2|4306 to 'PATHOLOGY.T.STAGE'. P value = 3.26e-19 with Spearman correlation analysis.
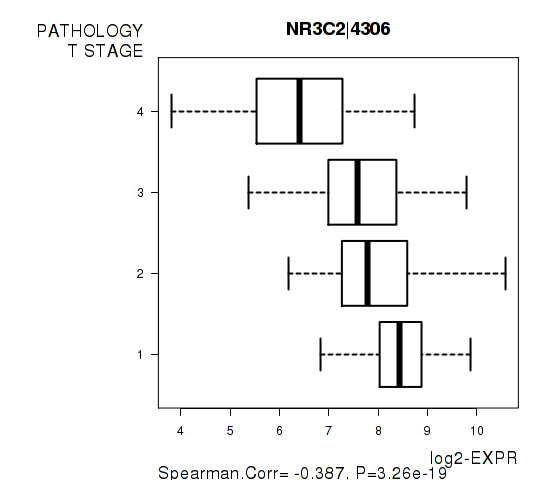
Table S8. Basic characteristics of clinical feature: 'PATHOLOGY.N.STAGE'
| PATHOLOGY.N.STAGE | Labels | N |
| class0 | 233 | |
| class1 | 17 | |
| Significant markers | N = 7 | |
| Higher in class1 | 2 | |
| Higher in class0 | 5 |
Table S9. Get Full Table List of 7 genes differentially expressed by 'PATHOLOGY.N.STAGE'
| T(pos if higher in 'class1') | ttestP | Q | AUC | |
|---|---|---|---|---|
| C11ORF34|349633 | -7.83 | 3.549e-09 | 6.49e-05 | 0.7212 |
| PITX2|5308 | 6.97 | 1.829e-07 | 0.00334 | 0.7854 |
| ATP6V1D|51382 | -6.26 | 2.918e-07 | 0.00533 | 0.7539 |
| HEMGN|55363 | -6.02 | 5.129e-07 | 0.00937 | 0.7451 |
| C9ORF135|138255 | -5.42 | 1.705e-06 | 0.0312 | 0.6712 |
| AHSP|51327 | -5.92 | 1.921e-06 | 0.0351 | 0.7549 |
| TMEM104|54868 | 5.92 | 2.727e-06 | 0.0498 | 0.8051 |
Figure S4. Get High-res Image As an example, this figure shows the association of C11ORF34|349633 to 'PATHOLOGY.N.STAGE'. P value = 3.55e-09 with T-test analysis.
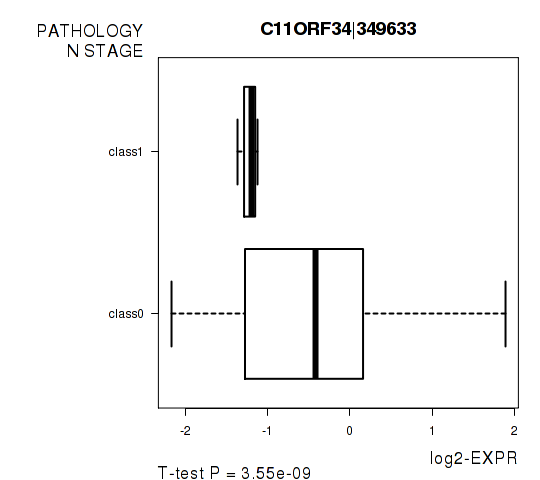
Table S10. Basic characteristics of clinical feature: 'PATHOLOGY.M.STAGE'
| PATHOLOGY.M.STAGE | Labels | N |
| M0 | 419 | |
| M1 | 78 | |
| Significant markers | N = 266 | |
| Higher in M1 | 231 | |
| Higher in M0 | 35 |
Table S11. Get Full Table List of top 10 genes differentially expressed by 'PATHOLOGY.M.STAGE'
| T(pos if higher in 'M1') | ttestP | Q | AUC | |
|---|---|---|---|---|
| GARNL3|84253 | -6.85 | 3.696e-10 | 6.76e-06 | 0.7406 |
| IL20RB|53833 | 6.88 | 4.618e-10 | 8.44e-06 | 0.7341 |
| NFE2L3|9603 | 6.66 | 1.044e-09 | 1.91e-05 | 0.7255 |
| PLEKHA9|51054 | 6.66 | 1.124e-09 | 2.05e-05 | 0.7367 |
| PPIAL4G|644591 | 6.47 | 2.005e-09 | 3.67e-05 | 0.7012 |
| INHBE|83729 | 6.56 | 2.284e-09 | 4.17e-05 | 0.7266 |
| C22ORF9|23313 | 6.45 | 2.827e-09 | 5.17e-05 | 0.727 |
| BIRC5|332 | 6.48 | 3.023e-09 | 5.52e-05 | 0.7237 |
| CEP55|55165 | 6.44 | 4.094e-09 | 7.48e-05 | 0.7221 |
| IGF2BP3|10643 | 6.44 | 4.279e-09 | 7.82e-05 | 0.7296 |
Figure S5. Get High-res Image As an example, this figure shows the association of GARNL3|84253 to 'PATHOLOGY.M.STAGE'. P value = 3.7e-10 with T-test analysis.
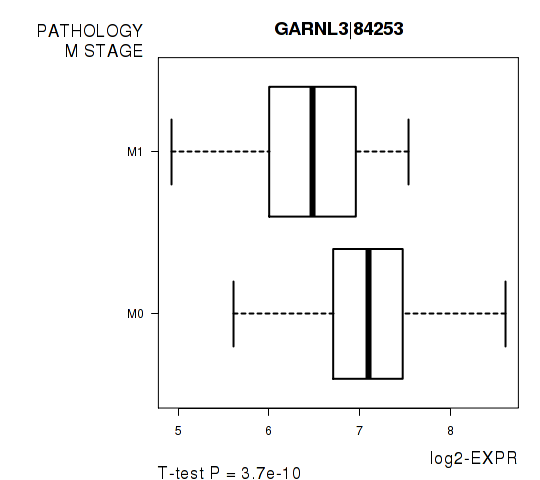
Table S12. Basic characteristics of clinical feature: 'GENDER'
| GENDER | Labels | N |
| FEMALE | 170 | |
| MALE | 327 | |
| Significant markers | N = 241 | |
| Higher in MALE | 145 | |
| Higher in FEMALE | 96 |
Table S13. Get Full Table List of top 10 genes differentially expressed by 'GENDER'
| T(pos if higher in 'MALE') | ttestP | Q | AUC | |
|---|---|---|---|---|
| XIST|7503 | -45.12 | 4.479e-170 | 8.19e-166 | 0.9848 |
| PRKY|5616 | 40.24 | 2.107e-111 | 3.85e-107 | 0.9858 |
| NLGN4Y|22829 | 38.39 | 4.493e-85 | 8.21e-81 | 0.9852 |
| RPS4Y1|6192 | 37.13 | 1.222e-75 | 2.23e-71 | 0.9896 |
| ZFY|7544 | 38.1 | 1.778e-71 | 3.25e-67 | 0.9872 |
| TSIX|9383 | -23.82 | 7.876e-71 | 1.44e-66 | 0.9645 |
| DDX3Y|8653 | 32.41 | 6.365e-60 | 1.16e-55 | 0.9821 |
| KDM5C|8242 | -17.33 | 2.203e-51 | 4.03e-47 | 0.9007 |
| NCRNA00183|554203 | -16.45 | 4.172e-46 | 7.62e-42 | 0.8646 |
| KDM5D|8284 | 26.56 | 2.13e-41 | 3.89e-37 | 0.9802 |
Figure S6. Get High-res Image As an example, this figure shows the association of XIST|7503 to 'GENDER'. P value = 4.48e-170 with T-test analysis.
No gene related to 'KARNOFSKY.PERFORMANCE.SCORE'.
Table S14. Basic characteristics of clinical feature: 'KARNOFSKY.PERFORMANCE.SCORE'
| KARNOFSKY.PERFORMANCE.SCORE | Mean (SD) | 90.86 (18) |
| Score | N | |
| 0 | 1 | |
| 70 | 1 | |
| 80 | 3 | |
| 90 | 13 | |
| 100 | 17 | |
| Significant markers | N = 0 |
-
Expresson data file = KIRC-TP.uncv2.mRNAseq_RSEM_normalized_log2.txt
-
Clinical data file = KIRC-TP.merged_data.txt
-
Number of patients = 497
-
Number of genes = 18283
-
Number of clinical features = 9
For survival clinical features, Wald's test in univariate Cox regression analysis with proportional hazards model (Andersen and Gill 1982) was used to estimate the P values using the 'coxph' function in R. Kaplan-Meier survival curves were plot using the four quartile subgroups of patients based on expression levels
For continuous numerical clinical features, Spearman's rank correlation coefficients (Spearman 1904) and two-tailed P values were estimated using 'cor.test' function in R
For multi-class clinical features (ordinal or nominal), one-way analysis of variance (Howell 2002) was applied to compare the log2-expression levels between different clinical classes using 'anova' function in R
For two-class clinical features, two-tailed Student's t test with unequal variance (Lehmann and Romano 2005) was applied to compare the log2-expression levels between the two clinical classes using 't.test' function in R
For multiple hypothesis correction, Q value is the False Discovery Rate (FDR) analogue of the P value (Benjamini and Hochberg 1995), defined as the minimum FDR at which the test may be called significant. We used the 'Benjamini and Hochberg' method of 'p.adjust' function in R to convert P values into Q values.
In addition to the links below, the full results of the analysis summarized in this report can also be downloaded programmatically using firehose_get, or interactively from either the Broad GDAC website or TCGA Data Coordination Center Portal.