This pipeline uses various statistical tests to identify miRs whose expression levels correlated to selected clinical features.
Testing the association between 456 miRs and 9 clinical features across 482 samples, statistically thresholded by Q value < 0.05, 6 clinical features related to at least one miRs.
-
66 miRs correlated to 'Time to Death'.
-
HSA-MIR-223 , HSA-MIR-130B , HSA-MIR-34C , HSA-MIR-21 , HSA-MIR-10B , ...
-
1 miR correlated to 'AGE'.
-
HSA-MIR-590
-
38 miRs correlated to 'NEOPLASM.DISEASESTAGE'.
-
HSA-MIR-139 , HSA-MIR-625 , HSA-MIR-486 , HSA-MIR-21 , HSA-MIR-28 , ...
-
32 miRs correlated to 'PATHOLOGY.T.STAGE'.
-
HSA-MIR-139 , HSA-MIR-21 , HSA-MIR-486 , HSA-MIR-625 , HSA-MIR-144 , ...
-
18 miRs correlated to 'PATHOLOGY.M.STAGE'.
-
HSA-MIR-106B , HSA-MIR-193A , HSA-MIR-625 , HSA-MIR-28 , HSA-MIR-155 , ...
-
9 miRs correlated to 'GENDER'.
-
HSA-MIR-100 , HSA-MIR-708 , HSA-MIR-455 , HSA-MIR-599 , HSA-MIR-30A , ...
-
No miRs correlated to 'PATHOLOGY.N.STAGE', 'KARNOFSKY.PERFORMANCE.SCORE', and 'NUMBERPACKYEARSSMOKED'.
Complete statistical result table is provided in Supplement Table 1
Table 1. Get Full Table This table shows the clinical features, statistical methods used, and the number of miRs that are significantly associated with each clinical feature at Q value < 0.05.
| Clinical feature | Statistical test | Significant miRs | Associated with | Associated with | ||
|---|---|---|---|---|---|---|
| Time to Death | Cox regression test | N=66 | shorter survival | N=56 | longer survival | N=10 |
| AGE | Spearman correlation test | N=1 | older | N=1 | younger | N=0 |
| NEOPLASM DISEASESTAGE | ANOVA test | N=38 | ||||
| PATHOLOGY T STAGE | Spearman correlation test | N=32 | higher stage | N=23 | lower stage | N=9 |
| PATHOLOGY N STAGE | t test | N=0 | ||||
| PATHOLOGY M STAGE | t test | N=18 | m1 | N=14 | m0 | N=4 |
| GENDER | t test | N=9 | male | N=3 | female | N=6 |
| KARNOFSKY PERFORMANCE SCORE | Spearman correlation test | N=0 | ||||
| NUMBERPACKYEARSSMOKED | Spearman correlation test | N=0 |
Table S1. Basic characteristics of clinical feature: 'Time to Death'
| Time to Death | Duration (Months) | 0.1-120.6 (median=36.5) |
| censored | N = 321 | |
| death | N = 161 | |
| Significant markers | N = 66 | |
| associated with shorter survival | 56 | |
| associated with longer survival | 10 |
Table S2. Get Full Table List of top 10 miRs significantly associated with 'Time to Death' by Cox regression test
| HazardRatio | Wald_P | Q | C_index | |
|---|---|---|---|---|
| HSA-MIR-223 | 1.6 | 2.042e-12 | 9.3e-10 | 0.643 |
| HSA-MIR-130B | 2 | 4.618e-12 | 2.1e-09 | 0.647 |
| HSA-MIR-34C | 1.28 | 1.73e-10 | 7.9e-08 | 0.64 |
| HSA-MIR-21 | 2.1 | 1.018e-09 | 4.6e-07 | 0.661 |
| HSA-MIR-10B | 0.56 | 1.228e-08 | 5.6e-06 | 0.369 |
| HSA-MIR-365-2 | 1.67 | 1.872e-08 | 8.4e-06 | 0.622 |
| HSA-MIR-365-1 | 1.64 | 3.725e-08 | 1.7e-05 | 0.619 |
| HSA-MIR-18A | 1.54 | 4.235e-08 | 1.9e-05 | 0.617 |
| HSA-MIR-1248 | 1.39 | 7.657e-08 | 3.4e-05 | 0.609 |
| HSA-MIR-101-1 | 0.58 | 9.034e-08 | 4e-05 | 0.404 |
Figure S1. Get High-res Image As an example, this figure shows the association of HSA-MIR-223 to 'Time to Death'. four curves present the cumulative survival rates of 4 quartile subsets of patients. P value = 2.04e-12 with univariate Cox regression analysis using continuous log-2 expression values.
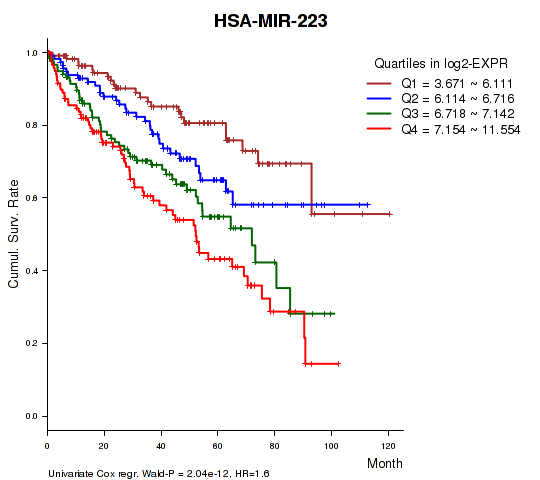
Table S3. Basic characteristics of clinical feature: 'AGE'
| AGE | Mean (SD) | 60.58 (12) |
| Significant markers | N = 1 | |
| pos. correlated | 1 | |
| neg. correlated | 0 |
Table S4. Get Full Table List of one miR significantly correlated to 'AGE' by Spearman correlation test
| SpearmanCorr | corrP | Q | |
|---|---|---|---|
| HSA-MIR-590 | 0.1806 | 6.665e-05 | 0.0304 |
Figure S2. Get High-res Image As an example, this figure shows the association of HSA-MIR-590 to 'AGE'. P value = 6.66e-05 with Spearman correlation analysis. The straight line presents the best linear regression.
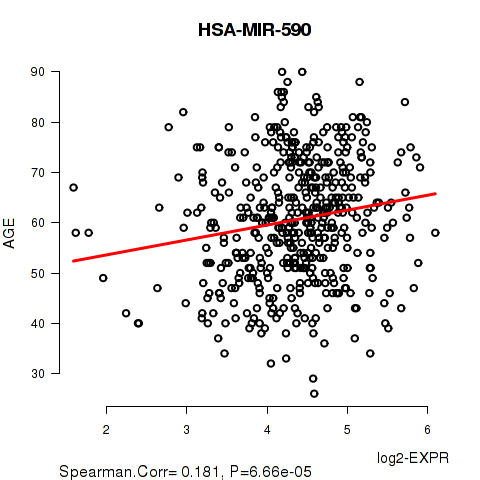
Table S5. Basic characteristics of clinical feature: 'NEOPLASM.DISEASESTAGE'
| NEOPLASM.DISEASESTAGE | Labels | N |
| STAGE I | 228 | |
| STAGE II | 52 | |
| STAGE III | 124 | |
| STAGE IV | 78 | |
| Significant markers | N = 38 |
Table S6. Get Full Table List of top 10 miRs differentially expressed by 'NEOPLASM.DISEASESTAGE'
| ANOVA_P | Q | |
|---|---|---|
| HSA-MIR-139 | 4.681e-13 | 2.13e-10 |
| HSA-MIR-625 | 8.392e-11 | 3.82e-08 |
| HSA-MIR-486 | 8.048e-09 | 3.65e-06 |
| HSA-MIR-21 | 8.454e-09 | 3.83e-06 |
| HSA-MIR-28 | 1.568e-08 | 7.09e-06 |
| HSA-MIR-144 | 2.871e-08 | 1.29e-05 |
| HSA-LET-7I | 3.454e-08 | 1.55e-05 |
| HSA-MIR-155 | 3.554e-08 | 1.6e-05 |
| HSA-MIR-130B | 6.128e-08 | 2.75e-05 |
| HSA-MIR-10B | 3.356e-07 | 0.00015 |
Figure S3. Get High-res Image As an example, this figure shows the association of HSA-MIR-139 to 'NEOPLASM.DISEASESTAGE'. P value = 4.68e-13 with ANOVA analysis.
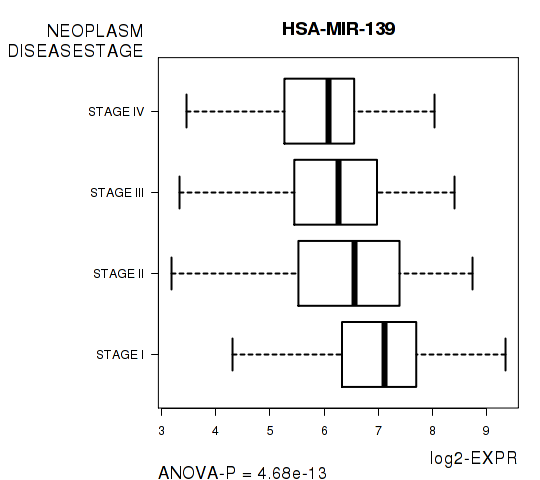
Table S7. Basic characteristics of clinical feature: 'PATHOLOGY.T.STAGE'
| PATHOLOGY.T.STAGE | Mean (SD) | 1.93 (0.97) |
| N | ||
| 1 | 233 | |
| 2 | 63 | |
| 3 | 175 | |
| 4 | 11 | |
| Significant markers | N = 32 | |
| pos. correlated | 23 | |
| neg. correlated | 9 |
Table S8. Get Full Table List of top 10 miRs significantly correlated to 'PATHOLOGY.T.STAGE' by Spearman correlation test
| SpearmanCorr | corrP | Q | |
|---|---|---|---|
| HSA-MIR-139 | -0.3352 | 4.017e-14 | 1.83e-11 |
| HSA-MIR-21 | 0.2754 | 7.702e-10 | 3.5e-07 |
| HSA-MIR-486 | -0.2724 | 1.203e-09 | 5.46e-07 |
| HSA-MIR-625 | 0.2693 | 1.879e-09 | 8.51e-07 |
| HSA-MIR-144 | -0.2481 | 3.392e-08 | 1.53e-05 |
| HSA-MIR-155 | 0.2463 | 4.281e-08 | 1.93e-05 |
| HSA-MIR-451 | -0.2352 | 1.747e-07 | 7.86e-05 |
| HSA-MIR-130B | 0.2315 | 2.774e-07 | 0.000125 |
| HSA-MIR-9-1 | 0.2304 | 3.165e-07 | 0.000142 |
| HSA-MIR-9-2 | 0.2219 | 8.669e-07 | 0.000387 |
Figure S4. Get High-res Image As an example, this figure shows the association of HSA-MIR-139 to 'PATHOLOGY.T.STAGE'. P value = 4.02e-14 with Spearman correlation analysis.
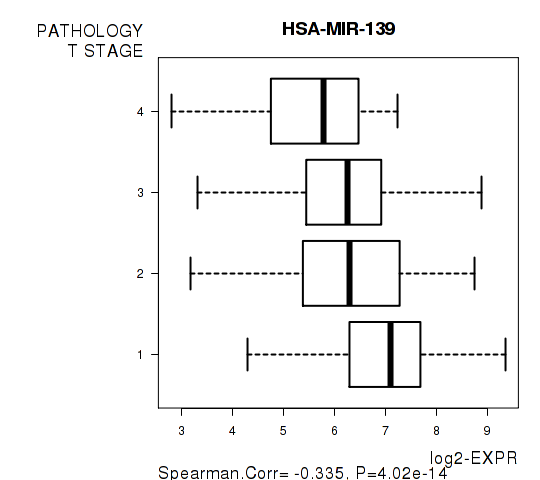
Table S9. Basic characteristics of clinical feature: 'PATHOLOGY.N.STAGE'
| PATHOLOGY.N.STAGE | Labels | N |
| class0 | 222 | |
| class1 | 18 | |
| Significant markers | N = 0 |
Table S10. Basic characteristics of clinical feature: 'PATHOLOGY.M.STAGE'
| PATHOLOGY.M.STAGE | Labels | N |
| M0 | 405 | |
| M1 | 77 | |
| Significant markers | N = 18 | |
| Higher in M1 | 14 | |
| Higher in M0 | 4 |
Table S11. Get Full Table List of top 10 miRs differentially expressed by 'PATHOLOGY.M.STAGE'
| T(pos if higher in 'M1') | ttestP | Q | AUC | |
|---|---|---|---|---|
| HSA-MIR-106B | 5.67 | 7.499e-08 | 3.42e-05 | 0.6749 |
| HSA-MIR-193A | 5.53 | 1.173e-07 | 5.34e-05 | 0.6414 |
| HSA-MIR-625 | 5.39 | 4.312e-07 | 0.000196 | 0.6892 |
| HSA-MIR-28 | 5.27 | 6.543e-07 | 0.000296 | 0.6603 |
| HSA-MIR-155 | 5.26 | 6.851e-07 | 0.00031 | 0.6824 |
| HSA-LET-7I | 4.99 | 1.949e-06 | 0.000879 | 0.6613 |
| HSA-MIR-130B | 4.98 | 2.115e-06 | 0.000952 | 0.6664 |
| HSA-MIR-144 | -4.99 | 2.395e-06 | 0.00108 | 0.676 |
| HSA-MIR-139 | -4.82 | 4.818e-06 | 0.00216 | 0.6691 |
| HSA-MIR-27A | 4.66 | 7.415e-06 | 0.00331 | 0.6275 |
Figure S5. Get High-res Image As an example, this figure shows the association of HSA-MIR-106B to 'PATHOLOGY.M.STAGE'. P value = 7.5e-08 with T-test analysis.
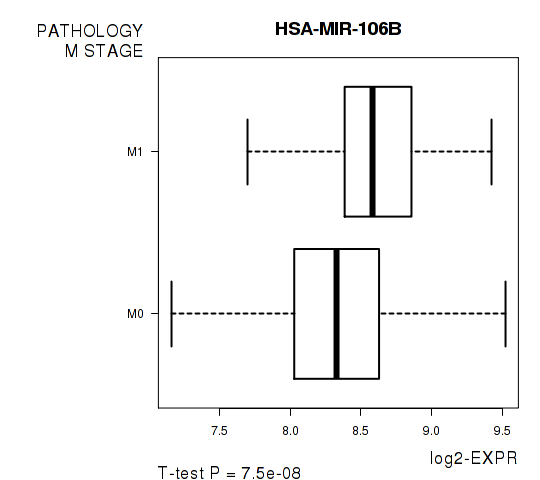
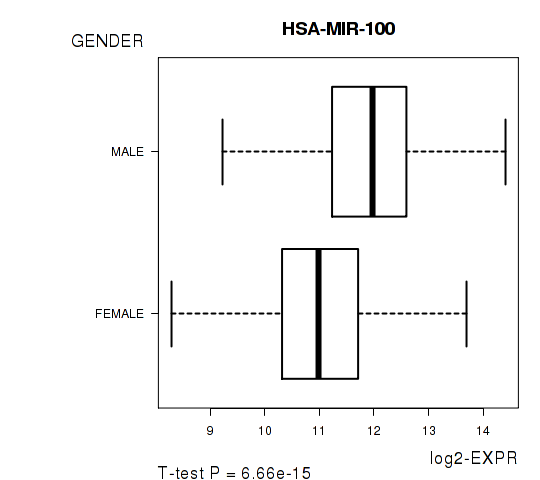
Table S12. Basic characteristics of clinical feature: 'GENDER'
| GENDER | Labels | N |
| FEMALE | 163 | |
| MALE | 319 | |
| Significant markers | N = 9 | |
| Higher in MALE | 3 | |
| Higher in FEMALE | 6 |
Table S13. Get Full Table List of 9 miRs differentially expressed by 'GENDER'
| T(pos if higher in 'MALE') | ttestP | Q | AUC | |
|---|---|---|---|---|
| HSA-MIR-100 | 8.19 | 6.655e-15 | 3.03e-12 | 0.7304 |
| HSA-MIR-708 | 5.48 | 8.984e-08 | 4.09e-05 | 0.659 |
| HSA-MIR-455 | -5.38 | 1.342e-07 | 6.09e-05 | 0.6599 |
| HSA-MIR-599 | -5.16 | 5.008e-07 | 0.000227 | 0.6779 |
| HSA-MIR-30A | -4.37 | 1.585e-05 | 0.00716 | 0.6149 |
| HSA-MIR-31 | 4.37 | 1.715e-05 | 0.00773 | 0.6296 |
| HSA-MIR-30C-2 | -4.16 | 4.06e-05 | 0.0183 | 0.6088 |
| HSA-MIR-628 | -3.99 | 7.91e-05 | 0.0355 | 0.5945 |
| HSA-MIR-204 | -3.96 | 9.203e-05 | 0.0412 | 0.6356 |
Figure S6. Get High-res Image As an example, this figure shows the association of HSA-MIR-100 to 'GENDER'. P value = 6.66e-15 with T-test analysis.
No miR related to 'KARNOFSKY.PERFORMANCE.SCORE'.
Table S14. Basic characteristics of clinical feature: 'KARNOFSKY.PERFORMANCE.SCORE'
| KARNOFSKY.PERFORMANCE.SCORE | Mean (SD) | 88.33 (23) |
| Score | N | |
| 0 | 2 | |
| 70 | 1 | |
| 80 | 3 | |
| 90 | 13 | |
| 100 | 17 | |
| Significant markers | N = 0 |
-
Expresson data file = KIRC-TP.miRseq_RPKM_log2.txt
-
Clinical data file = KIRC-TP.merged_data.txt
-
Number of patients = 482
-
Number of miRs = 456
-
Number of clinical features = 9
For survival clinical features, Wald's test in univariate Cox regression analysis with proportional hazards model (Andersen and Gill 1982) was used to estimate the P values using the 'coxph' function in R. Kaplan-Meier survival curves were plot using the four quartile subgroups of patients based on expression levels
For continuous numerical clinical features, Spearman's rank correlation coefficients (Spearman 1904) and two-tailed P values were estimated using 'cor.test' function in R
For multi-class clinical features (ordinal or nominal), one-way analysis of variance (Howell 2002) was applied to compare the log2-expression levels between different clinical classes using 'anova' function in R
For two-class clinical features, two-tailed Student's t test with unequal variance (Lehmann and Romano 2005) was applied to compare the log2-expression levels between the two clinical classes using 't.test' function in R
For multiple hypothesis correction, Q value is the False Discovery Rate (FDR) analogue of the P value (Benjamini and Hochberg 1995), defined as the minimum FDR at which the test may be called significant. We used the 'Benjamini and Hochberg' method of 'p.adjust' function in R to convert P values into Q values.
In addition to the links below, the full results of the analysis summarized in this report can also be downloaded programmatically using firehose_get, or interactively from either the Broad GDAC website or TCGA Data Coordination Center Portal.