This pipeline computes the correlation between significant arm-level copy number variations (cnvs) and selected clinical features.
Testing the association between copy number variation 30 arm-level events and 3 clinical features across 191 patients, 6 significant findings detected with Q value < 0.25.
-
3p loss cnv correlated to 'AGE'.
-
3q loss cnv correlated to 'AGE'.
-
5q loss cnv correlated to 'Time to Death'.
-
18p loss cnv correlated to 'Time to Death'.
-
18q loss cnv correlated to 'Time to Death' and 'AGE'.
Table 1. Get Full Table Overview of the association between significant copy number variation of 30 arm-level events and 3 clinical features. Shown in the table are P values (Q values). Thresholded by Q value < 0.25, 6 significant findings detected.
|
Clinical Features |
Time to Death |
AGE | GENDER | ||
| nCNV (%) | nWild-Type | logrank test | t-test | Fisher's exact test | |
| 18q loss | 4 (2%) | 187 |
0.000812 (0.0666) |
0.003 (0.234) |
0.127 (1.00) |
| 3p loss | 3 (2%) | 188 |
0.00241 (0.193) |
0.252 (1.00) |
|
| 3q loss | 3 (2%) | 188 |
0.00241 (0.193) |
0.252 (1.00) |
|
| 5q loss | 6 (3%) | 185 |
0.00073 (0.0606) |
0.0601 (1.00) |
0.0325 (1.00) |
| 18p loss | 5 (3%) | 186 |
0.00202 (0.164) |
0.355 (1.00) |
0.0642 (1.00) |
| 1p gain | 3 (2%) | 188 |
0.0913 (1.00) |
0.592 (1.00) |
|
| 4p gain | 4 (2%) | 187 |
0.587 (1.00) |
0.425 (1.00) |
0.627 (1.00) |
| 4q gain | 4 (2%) | 187 |
0.587 (1.00) |
0.425 (1.00) |
0.627 (1.00) |
| 8p gain | 22 (12%) | 169 |
0.511 (1.00) |
0.072 (1.00) |
0.0734 (1.00) |
| 8q gain | 23 (12%) | 168 |
0.557 (1.00) |
0.106 (1.00) |
0.0723 (1.00) |
| 10q gain | 3 (2%) | 188 |
0.947 (1.00) |
0.252 (1.00) |
|
| 11p gain | 4 (2%) | 187 |
0.188 (1.00) |
1 (1.00) |
|
| 11q gain | 7 (4%) | 184 |
0.57 (1.00) |
0.0154 (1.00) |
1 (1.00) |
| 13q gain | 6 (3%) | 185 |
0.829 (1.00) |
0.143 (1.00) |
0.69 (1.00) |
| 17q gain | 3 (2%) | 188 |
0.729 (1.00) |
0.29 (1.00) |
1 (1.00) |
| 19p gain | 5 (3%) | 186 |
0.742 (1.00) |
0.702 (1.00) |
0.378 (1.00) |
| 19q gain | 5 (3%) | 186 |
0.742 (1.00) |
0.702 (1.00) |
0.378 (1.00) |
| 21q gain | 8 (4%) | 183 |
0.0186 (1.00) |
0.616 (1.00) |
0.0732 (1.00) |
| 22q gain | 9 (5%) | 182 |
0.731 (1.00) |
0.0339 (1.00) |
0.513 (1.00) |
| xq gain | 3 (2%) | 188 |
0.0894 (1.00) |
1 (1.00) |
|
| 7p loss | 17 (9%) | 174 |
0.0333 (1.00) |
0.171 (1.00) |
0.802 (1.00) |
| 7q loss | 20 (10%) | 171 |
0.0152 (1.00) |
0.18 (1.00) |
1 (1.00) |
| 12p loss | 4 (2%) | 187 |
0.752 (1.00) |
0.627 (1.00) |
|
| 15q loss | 4 (2%) | 187 |
0.68 (1.00) |
0.277 (1.00) |
1 (1.00) |
| 16q loss | 4 (2%) | 187 |
0.0595 (1.00) |
0.365 (1.00) |
0.627 (1.00) |
| 17p loss | 13 (7%) | 178 |
0.108 (1.00) |
0.783 (1.00) |
0.147 (1.00) |
| 17q loss | 7 (4%) | 184 |
0.403 (1.00) |
0.164 (1.00) |
0.458 (1.00) |
| 19p loss | 4 (2%) | 187 |
0.0999 (1.00) |
0.0521 (1.00) |
1 (1.00) |
| 19q loss | 4 (2%) | 187 |
0.0999 (1.00) |
0.0521 (1.00) |
1 (1.00) |
| xq loss | 5 (3%) | 186 |
0.183 (1.00) |
0.0197 (1.00) |
0.0642 (1.00) |
P value = 0.00241 (t-test), Q value = 0.19
Table S1. Gene #16: '3p loss' versus Clinical Feature #2: 'AGE'
| nPatients | Mean (Std.Dev) | |
|---|---|---|
| ALL | 191 | 55.2 (16.1) |
| 3P LOSS MUTATED | 3 | 74.0 (3.6) |
| 3P LOSS WILD-TYPE | 188 | 54.9 (16.0) |
Figure S1. Get High-res Image Gene #16: '3p loss' versus Clinical Feature #2: 'AGE'

P value = 0.00241 (t-test), Q value = 0.19
Table S2. Gene #17: '3q loss' versus Clinical Feature #2: 'AGE'
| nPatients | Mean (Std.Dev) | |
|---|---|---|
| ALL | 191 | 55.2 (16.1) |
| 3Q LOSS MUTATED | 3 | 74.0 (3.6) |
| 3Q LOSS WILD-TYPE | 188 | 54.9 (16.0) |
Figure S2. Get High-res Image Gene #17: '3q loss' versus Clinical Feature #2: 'AGE'

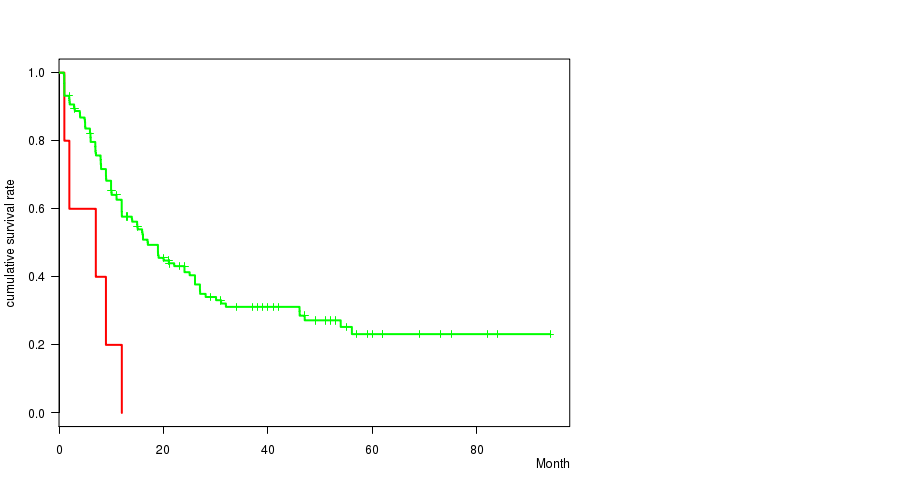
P value = 0.00073 (logrank test), Q value = 0.061
Table S3. Gene #18: '5q loss' versus Clinical Feature #1: 'Time to Death'
| nPatients | nDeath | Duration Range (Median), Month | |
|---|---|---|---|
| ALL | 168 | 106 | 0.9 - 94.1 (12.0) |
| 5Q LOSS MUTATED | 6 | 6 | 1.0 - 12.0 (7.0) |
| 5Q LOSS WILD-TYPE | 162 | 100 | 0.9 - 94.1 (12.5) |
Figure S3. Get High-res Image Gene #18: '5q loss' versus Clinical Feature #1: 'Time to Death'

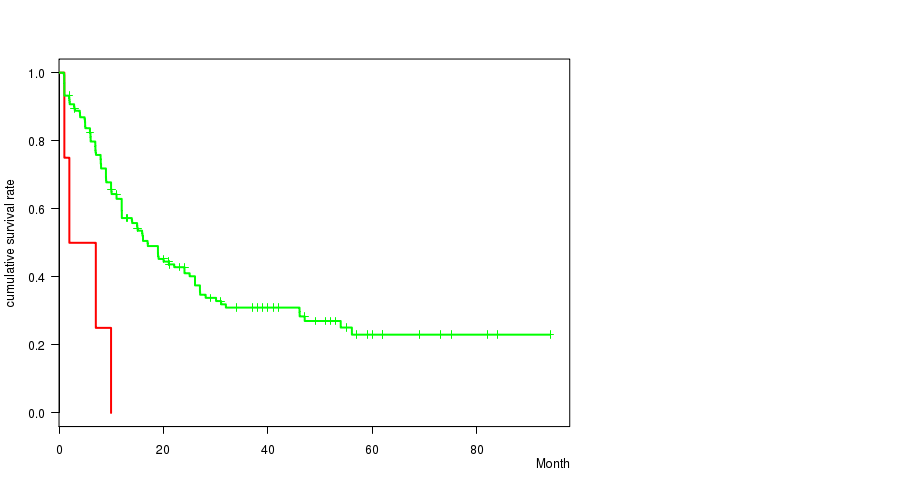
P value = 0.00202 (logrank test), Q value = 0.16
Table S4. Gene #26: '18p loss' versus Clinical Feature #1: 'Time to Death'
| nPatients | nDeath | Duration Range (Median), Month | |
|---|---|---|---|
| ALL | 168 | 106 | 0.9 - 94.1 (12.0) |
| 18P LOSS MUTATED | 5 | 5 | 1.0 - 12.0 (7.0) |
| 18P LOSS WILD-TYPE | 163 | 101 | 0.9 - 94.1 (12.0) |
Figure S4. Get High-res Image Gene #26: '18p loss' versus Clinical Feature #1: 'Time to Death'
P value = 0.000812 (logrank test), Q value = 0.067
Table S5. Gene #27: '18q loss' versus Clinical Feature #1: 'Time to Death'
| nPatients | nDeath | Duration Range (Median), Month | |
|---|---|---|---|
| ALL | 168 | 106 | 0.9 - 94.1 (12.0) |
| 18Q LOSS MUTATED | 4 | 4 | 1.0 - 10.0 (4.5) |
| 18Q LOSS WILD-TYPE | 164 | 102 | 0.9 - 94.1 (12.0) |
Figure S5. Get High-res Image Gene #27: '18q loss' versus Clinical Feature #1: 'Time to Death'
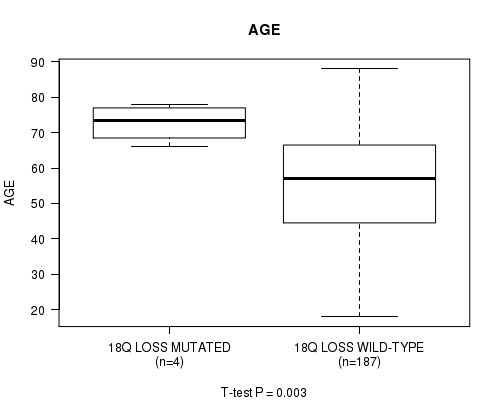
P value = 0.003 (t-test), Q value = 0.23
Table S6. Gene #27: '18q loss' versus Clinical Feature #2: 'AGE'
| nPatients | Mean (Std.Dev) | |
|---|---|---|
| ALL | 191 | 55.2 (16.1) |
| 18Q LOSS MUTATED | 4 | 72.8 (5.4) |
| 18Q LOSS WILD-TYPE | 187 | 54.8 (16.0) |
Figure S6. Get High-res Image Gene #27: '18q loss' versus Clinical Feature #2: 'AGE'
-
Copy number data file = transformed.cor.cli.txt
-
Clinical data file = LAML-TB.merged_data.txt
-
Number of patients = 191
-
Number of significantly arm-level cnvs = 30
-
Number of selected clinical features = 3
-
Exclude regions that fewer than K tumors have mutations, K = 3
For survival clinical features, the Kaplan-Meier survival curves of tumors with and without gene mutations were plotted and the statistical significance P values were estimated by logrank test (Bland and Altman 2004) using the 'survdiff' function in R
For continuous numerical clinical features, two-tailed Student's t test with unequal variance (Lehmann and Romano 2005) was applied to compare the clinical values between tumors with and without gene mutations using 't.test' function in R
For binary or multi-class clinical features (nominal or ordinal), two-tailed Fisher's exact tests (Fisher 1922) were used to estimate the P values using the 'fisher.test' function in R
For multiple hypothesis correction, Q value is the False Discovery Rate (FDR) analogue of the P value (Benjamini and Hochberg 1995), defined as the minimum FDR at which the test may be called significant. We used the 'Benjamini and Hochberg' method of 'p.adjust' function in R to convert P values into Q values.
In addition to the links below, the full results of the analysis summarized in this report can also be downloaded programmatically using firehose_get, or interactively from either the Broad GDAC website or TCGA Data Coordination Center Portal.