This pipeline uses various statistical tests to identify genes whose promoter methylation levels correlated to selected clinical features.
Testing the association between 19042 genes and 3 clinical features across 194 samples, statistically thresholded by Q value < 0.05, 2 clinical features related to at least one genes.
-
66 genes correlated to 'AGE'.
-
TMEM20 , ANGPTL5 , KIAA1377 , JAKMIP1 , AASS , ...
-
12 genes correlated to 'GENDER'.
-
FAM35A , GLUD1 , DKFZP434L187 , AP2B1 , KIF4B , ...
-
No genes correlated to 'Time to Death'
Complete statistical result table is provided in Supplement Table 1
Table 1. Get Full Table This table shows the clinical features, statistical methods used, and the number of genes that are significantly associated with each clinical feature at Q value < 0.05.
| Clinical feature | Statistical test | Significant genes | Associated with | Associated with | ||
|---|---|---|---|---|---|---|
| Time to Death | Cox regression test | N=0 | ||||
| AGE | Spearman correlation test | N=66 | older | N=16 | younger | N=50 |
| GENDER | t test | N=12 | male | N=5 | female | N=7 |
Table S1. Basic characteristics of clinical feature: 'Time to Death'
| Time to Death | Duration (Months) | 0.9-94.1 (median=12) |
| censored | N = 63 | |
| death | N = 106 | |
| Significant markers | N = 0 |
Table S2. Basic characteristics of clinical feature: 'AGE'
| AGE | Mean (SD) | 55.1 (16) |
| Significant markers | N = 66 | |
| pos. correlated | 16 | |
| neg. correlated | 50 |
Table S3. Get Full Table List of top 10 genes significantly correlated to 'AGE' by Spearman correlation test
| SpearmanCorr | corrP | Q | |
|---|---|---|---|
| TMEM20 | -0.4701 | 4.646e-12 | 8.85e-08 |
| ANGPTL5 | -0.4301 | 3.877e-10 | 7.38e-06 |
| KIAA1377 | -0.4301 | 3.877e-10 | 7.38e-06 |
| JAKMIP1 | -0.4278 | 4.904e-10 | 9.34e-06 |
| AASS | -0.4145 | 1.881e-09 | 3.58e-05 |
| TBC1D12 | -0.3926 | 1.503e-08 | 0.000286 |
| CD96 | 0.3879 | 2.283e-08 | 0.000435 |
| CAMK2D | -0.3818 | 3.938e-08 | 0.00075 |
| CBLN3 | -0.3809 | 4.282e-08 | 0.000815 |
| KHNYN | -0.3809 | 4.282e-08 | 0.000815 |
Figure S1. Get High-res Image As an example, this figure shows the association of TMEM20 to 'AGE'. P value = 4.65e-12 with Spearman correlation analysis. The straight line presents the best linear regression.

Table S4. Basic characteristics of clinical feature: 'GENDER'
| GENDER | Labels | N |
| FEMALE | 89 | |
| MALE | 105 | |
| Significant markers | N = 12 | |
| Higher in MALE | 5 | |
| Higher in FEMALE | 7 |
Table S5. Get Full Table List of top 10 genes differentially expressed by 'GENDER'
| T(pos if higher in 'MALE') | ttestP | Q | AUC | |
|---|---|---|---|---|
| FAM35A | -13.42 | 3.19e-29 | 6.07e-25 | 0.8964 |
| GLUD1 | -13.42 | 3.19e-29 | 6.07e-25 | 0.8964 |
| DKFZP434L187 | 12.68 | 7.369e-27 | 1.4e-22 | 0.9388 |
| AP2B1 | -12.75 | 1.219e-26 | 2.32e-22 | 0.8999 |
| KIF4B | -12.12 | 2.683e-24 | 5.11e-20 | 0.8675 |
| CROCC | -10.69 | 4.77e-21 | 9.08e-17 | 0.8856 |
| LOC389791__1 | 5.55 | 9.298e-08 | 0.00177 | 0.7109 |
| PTGES2__1 | 5.55 | 9.298e-08 | 0.00177 | 0.7109 |
| ATP5J | 5.22 | 5.05e-07 | 0.00961 | 0.7353 |
| GABPA__1 | 5.22 | 5.05e-07 | 0.00961 | 0.7353 |
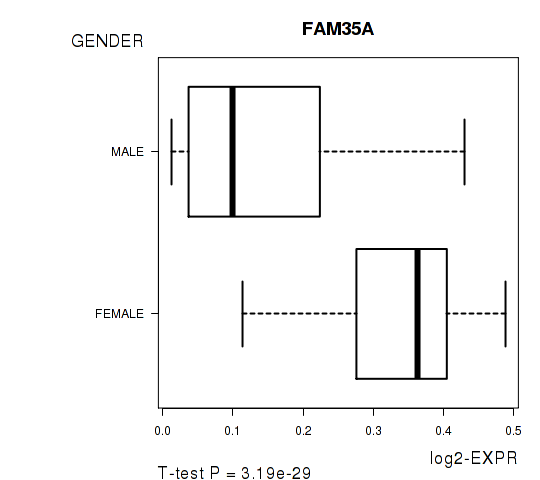
Figure S2. Get High-res Image As an example, this figure shows the association of FAM35A to 'GENDER'. P value = 3.19e-29 with T-test analysis.
-
Expresson data file = LAML-TB.meth.by_min_clin_corr.data.txt
-
Clinical data file = LAML-TB.merged_data.txt
-
Number of patients = 194
-
Number of genes = 19042
-
Number of clinical features = 3
For survival clinical features, Wald's test in univariate Cox regression analysis with proportional hazards model (Andersen and Gill 1982) was used to estimate the P values using the 'coxph' function in R. Kaplan-Meier survival curves were plot using the four quartile subgroups of patients based on expression levels
For continuous numerical clinical features, Spearman's rank correlation coefficients (Spearman 1904) and two-tailed P values were estimated using 'cor.test' function in R
For two-class clinical features, two-tailed Student's t test with unequal variance (Lehmann and Romano 2005) was applied to compare the log2-expression levels between the two clinical classes using 't.test' function in R
For multiple hypothesis correction, Q value is the False Discovery Rate (FDR) analogue of the P value (Benjamini and Hochberg 1995), defined as the minimum FDR at which the test may be called significant. We used the 'Benjamini and Hochberg' method of 'p.adjust' function in R to convert P values into Q values.
In addition to the links below, the full results of the analysis summarized in this report can also be downloaded programmatically using firehose_get, or interactively from either the Broad GDAC website or TCGA Data Coordination Center Portal.