This pipeline computes the correlation between significant copy number variation (cnv focal) genes and selected clinical features.
Testing the association between copy number variation 45 focal events and 6 clinical features across 276 patients, 22 significant findings detected with Q value < 0.25.
-
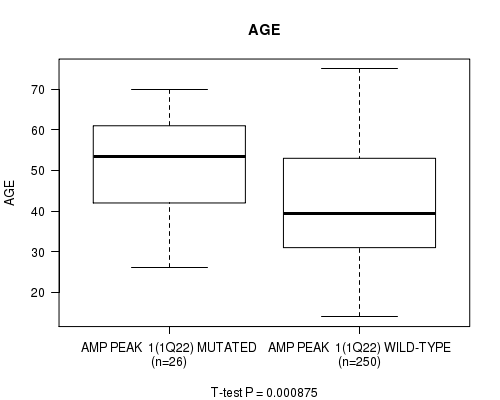
amp_1q22 cnv correlated to 'AGE'.
-
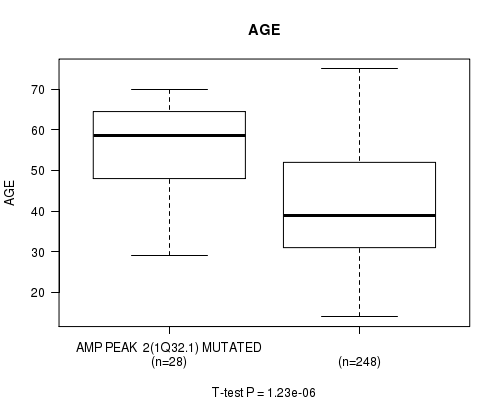
amp_1q32.1 cnv correlated to 'AGE'.
-
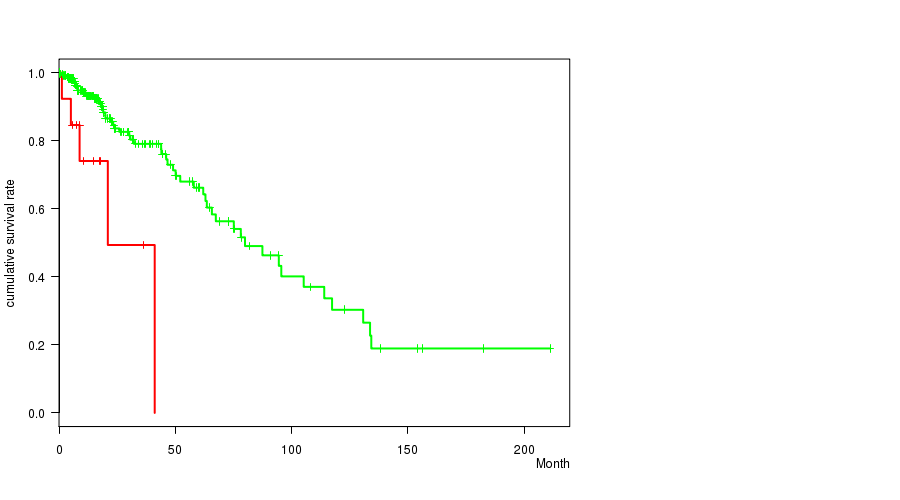
amp_3q26.32 cnv correlated to 'Time to Death'.
-
amp_7p11.2 cnv correlated to 'Time to Death' and 'AGE'.
-
amp_7q31.2 cnv correlated to 'AGE'.
-
amp_7q32.3 cnv correlated to 'AGE'.
-
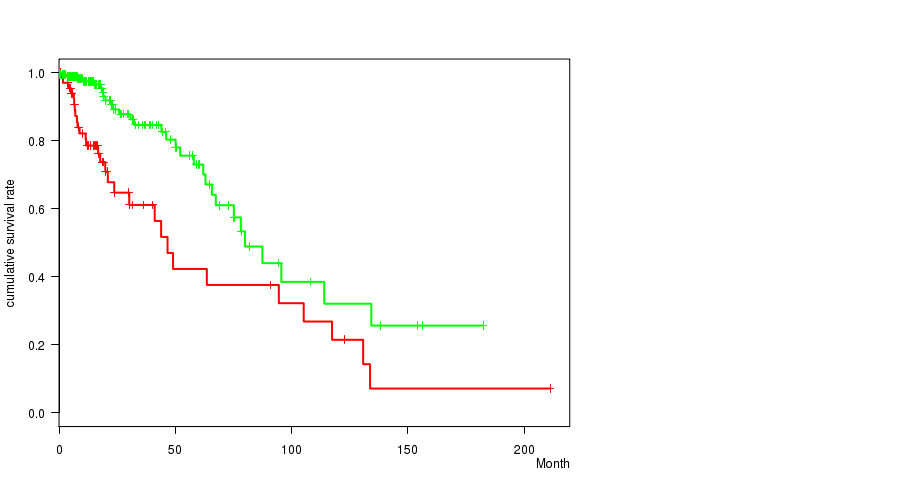
amp_12q14.1 cnv correlated to 'Time to Death'.
-
amp_17q24.3 cnv correlated to 'Time to Death'.
-
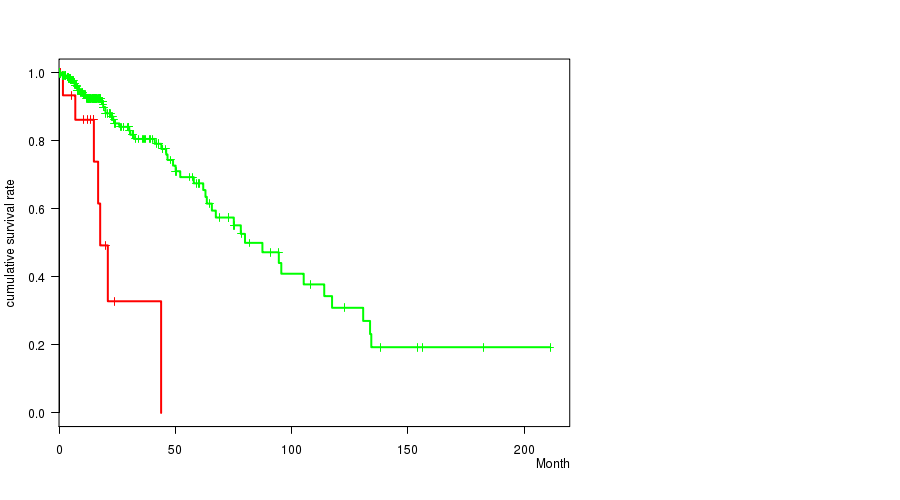
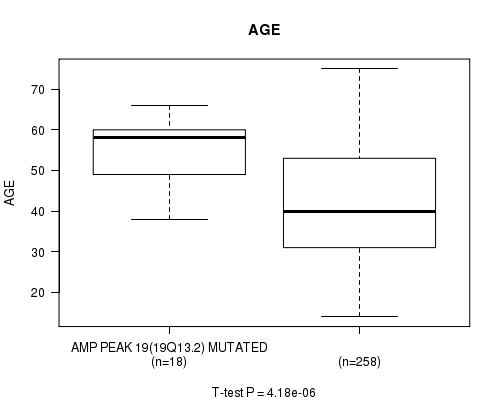
amp_19q13.2 cnv correlated to 'Time to Death' and 'AGE'.
-
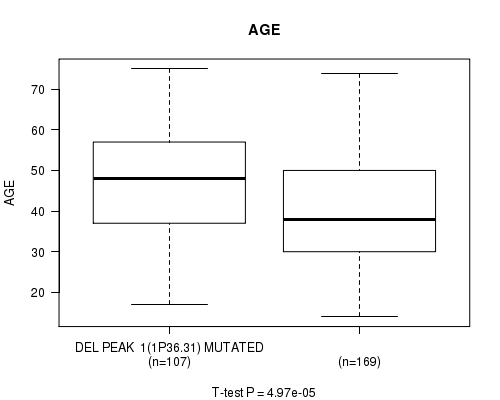
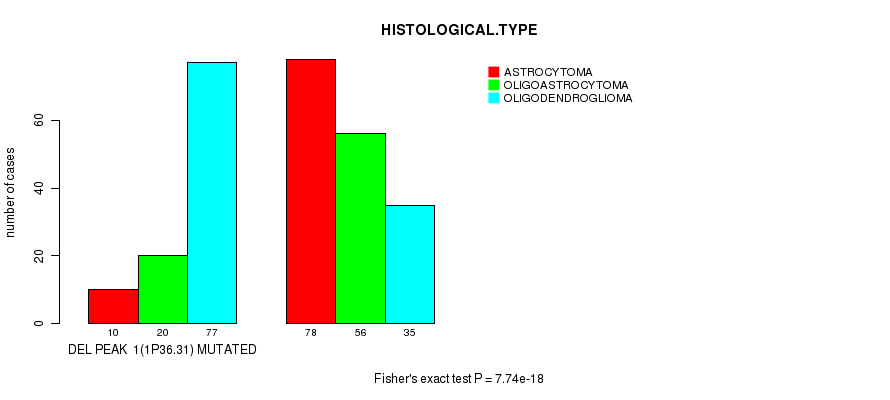
del_1p36.31 cnv correlated to 'AGE' and 'HISTOLOGICAL.TYPE'.
-
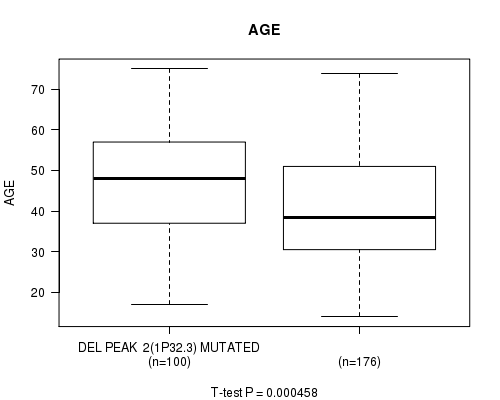
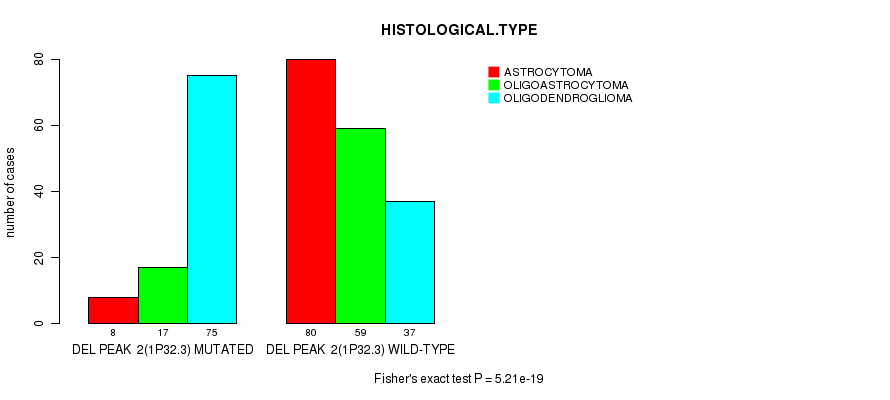
del_1p32.3 cnv correlated to 'AGE' and 'HISTOLOGICAL.TYPE'.
-
del_6p25.3 cnv correlated to 'Time to Death'.
-
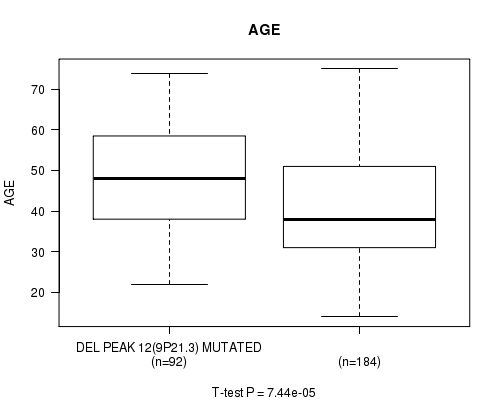
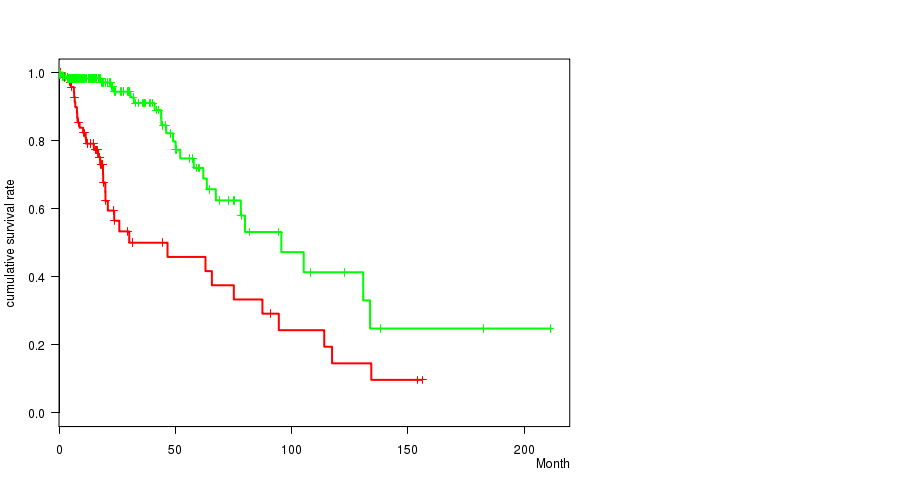
del_9p21.3 cnv correlated to 'Time to Death' and 'AGE'.
-
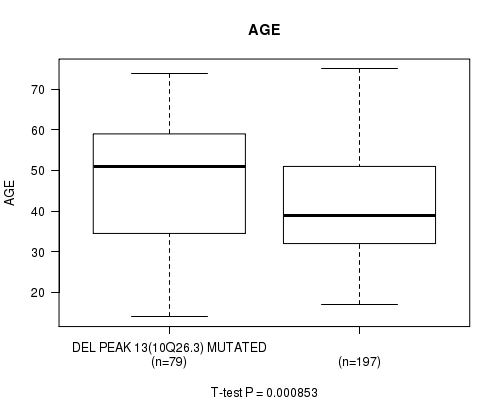
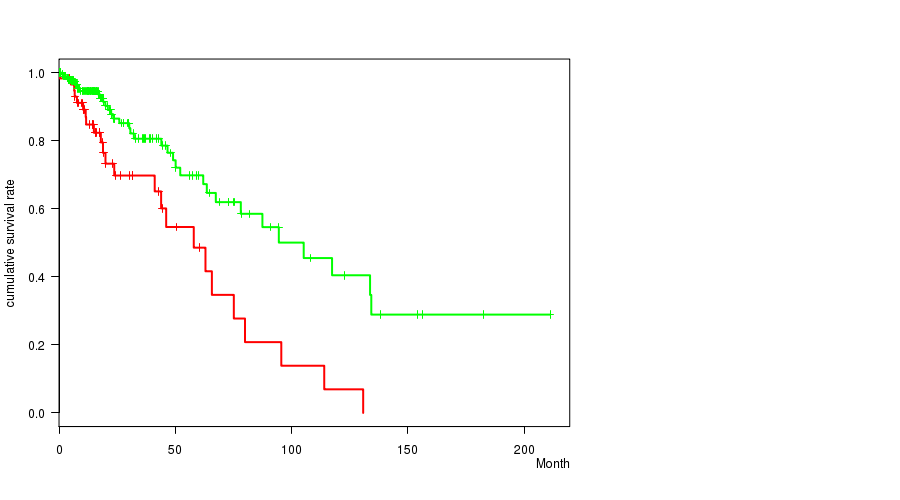
del_10q26.3 cnv correlated to 'Time to Death' and 'AGE'.
-
del_14q24.3 cnv correlated to 'Time to Death'.
-
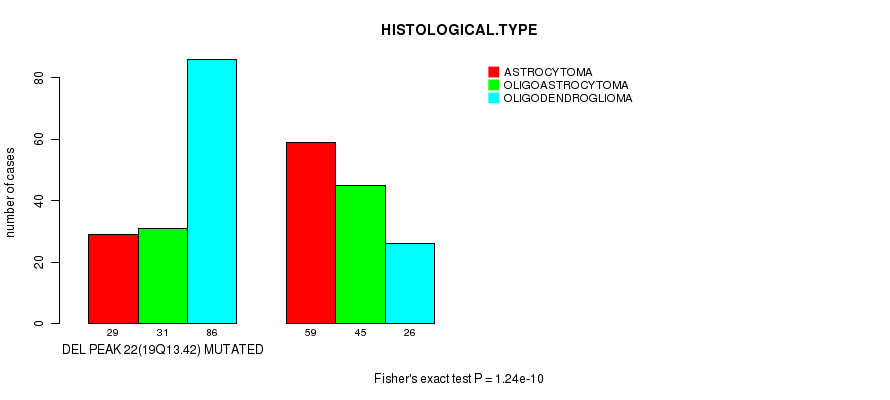
del_19q13.42 cnv correlated to 'HISTOLOGICAL.TYPE'.
Table 1. Get Full Table Overview of the association between significant copy number variation of 45 focal events and 6 clinical features. Shown in the table are P values (Q values). Thresholded by Q value < 0.25, 22 significant findings detected.
|
Clinical Features |
Time to Death |
AGE | GENDER |
KARNOFSKY PERFORMANCE SCORE |
HISTOLOGICAL TYPE |
RADIATIONS RADIATION REGIMENINDICATION |
||
| nCNV (%) | nWild-Type | logrank test | t-test | Fisher's exact test | t-test | Fisher's exact test | Fisher's exact test | |
| amp 7p11 2 | 72 (26%) | 204 |
0.000232 (0.0593) |
1.11e-05 (0.00287) |
0.13 (1.00) |
0.147 (1.00) |
0.0719 (1.00) |
0.66 (1.00) |
| amp 19q13 2 | 18 (7%) | 258 |
8.98e-06 (0.00235) |
4.18e-06 (0.0011) |
1 (1.00) |
0.223 (1.00) |
0.414 (1.00) |
0.298 (1.00) |
| del 1p36 31 | 107 (39%) | 169 |
0.74 (1.00) |
4.97e-05 (0.0128) |
0.265 (1.00) |
0.379 (1.00) |
7.74e-18 (2.08e-15) |
0.0882 (1.00) |
| del 1p32 3 | 100 (36%) | 176 |
0.108 (1.00) |
0.000458 (0.116) |
0.379 (1.00) |
0.61 (1.00) |
5.21e-19 (1.41e-16) |
0.0158 (1.00) |
| del 9p21 3 | 92 (33%) | 184 |
8.29e-08 (2.21e-05) |
7.44e-05 (0.0191) |
0.798 (1.00) |
0.176 (1.00) |
0.0268 (1.00) |
0.0062 (1.00) |
| del 10q26 3 | 79 (29%) | 197 |
3.21e-06 (0.000848) |
0.000853 (0.213) |
0.0834 (1.00) |
0.572 (1.00) |
0.00659 (1.00) |
0.888 (1.00) |
| amp 1q22 | 26 (9%) | 250 |
0.0236 (1.00) |
0.000875 (0.218) |
0.416 (1.00) |
0.92 (1.00) |
0.634 (1.00) |
0.511 (1.00) |
| amp 1q32 1 | 28 (10%) | 248 |
0.00176 (0.432) |
1.23e-06 (0.000328) |
0.693 (1.00) |
0.0375 (1.00) |
0.324 (1.00) |
0.208 (1.00) |
| amp 3q26 32 | 14 (5%) | 262 |
0.000724 (0.183) |
0.206 (1.00) |
0.789 (1.00) |
0.708 (1.00) |
0.0326 (1.00) |
0.39 (1.00) |
| amp 7q31 2 | 97 (35%) | 179 |
0.0267 (1.00) |
1.06e-05 (0.00276) |
0.0227 (1.00) |
0.493 (1.00) |
0.0697 (1.00) |
0.686 (1.00) |
| amp 7q32 3 | 102 (37%) | 174 |
0.0408 (1.00) |
2.79e-06 (0.000741) |
0.0127 (1.00) |
0.589 (1.00) |
0.12 (1.00) |
0.595 (1.00) |
| amp 12q14 1 | 19 (7%) | 257 |
1.44e-05 (0.00374) |
0.0131 (1.00) |
0.636 (1.00) |
0.274 (1.00) |
0.0843 (1.00) |
0.322 (1.00) |
| amp 17q24 3 | 18 (7%) | 258 |
0.000759 (0.19) |
0.246 (1.00) |
0.628 (1.00) |
0.524 (1.00) |
0.908 (1.00) |
1 (1.00) |
| del 6p25 3 | 28 (10%) | 248 |
9.25e-05 (0.0237) |
0.278 (1.00) |
1 (1.00) |
0.3 (1.00) |
0.092 (1.00) |
1 (1.00) |
| del 14q24 3 | 59 (21%) | 217 |
0.000339 (0.0862) |
0.112 (1.00) |
0.0268 (1.00) |
0.825 (1.00) |
0.0964 (1.00) |
0.351 (1.00) |
| del 19q13 42 | 146 (53%) | 130 |
0.0512 (1.00) |
0.529 (1.00) |
1 (1.00) |
0.844 (1.00) |
1.24e-10 (3.31e-08) |
0.897 (1.00) |
| amp 2p24 3 | 8 (3%) | 268 |
0.59 (1.00) |
0.384 (1.00) |
0.477 (1.00) |
0.516 (1.00) |
0.734 (1.00) |
1 (1.00) |
| amp 4q12 | 14 (5%) | 262 |
0.067 (1.00) |
0.273 (1.00) |
1 (1.00) |
0.637 (1.00) |
0.0195 (1.00) |
1 (1.00) |
| amp 6q21 | 6 (2%) | 270 |
0.0249 (1.00) |
0.546 (1.00) |
1 (1.00) |
0.0178 (1.00) |
0.156 (1.00) |
0.0874 (1.00) |
| amp 8q24 13 | 58 (21%) | 218 |
0.869 (1.00) |
0.511 (1.00) |
0.104 (1.00) |
0.841 (1.00) |
0.00385 (0.932) |
0.875 (1.00) |
| amp 9q34 3 | 28 (10%) | 248 |
0.225 (1.00) |
0.729 (1.00) |
0.112 (1.00) |
0.334 (1.00) |
0.0414 (1.00) |
0.674 (1.00) |
| amp 10p15 2 | 41 (15%) | 235 |
0.538 (1.00) |
0.0021 (0.515) |
0.0611 (1.00) |
0.18 (1.00) |
0.00271 (0.661) |
0.205 (1.00) |
| amp 11q23 3 | 47 (17%) | 229 |
0.846 (1.00) |
0.264 (1.00) |
0.748 (1.00) |
0.438 (1.00) |
0.759 (1.00) |
1 (1.00) |
| amp 12p13 32 | 46 (17%) | 230 |
0.419 (1.00) |
0.25 (1.00) |
0.0523 (1.00) |
0.226 (1.00) |
0.41 (1.00) |
0.301 (1.00) |
| amp 13q34 | 13 (5%) | 263 |
0.402 (1.00) |
0.929 (1.00) |
0.394 (1.00) |
0.854 (1.00) |
0.517 (1.00) |
1 (1.00) |
| amp 19p13 3 | 66 (24%) | 210 |
0.786 (1.00) |
0.0409 (1.00) |
1 (1.00) |
0.671 (1.00) |
0.00116 (0.287) |
1 (1.00) |
| amp xp11 22 | 37 (13%) | 239 |
0.625 (1.00) |
0.796 (1.00) |
0.376 (1.00) |
0.963 (1.00) |
0.00602 (1.00) |
0.708 (1.00) |
| del 1q44 | 16 (6%) | 260 |
0.7 (1.00) |
0.545 (1.00) |
0.446 (1.00) |
0.985 (1.00) |
0.134 (1.00) |
1 (1.00) |
| del 2q37 3 | 41 (15%) | 235 |
0.923 (1.00) |
0.0901 (1.00) |
0.397 (1.00) |
0.395 (1.00) |
0.273 (1.00) |
0.588 (1.00) |
| del 3p21 1 | 25 (9%) | 251 |
0.0506 (1.00) |
0.29 (1.00) |
0.675 (1.00) |
0.0442 (1.00) |
0.297 (1.00) |
0.114 (1.00) |
| del 3q29 | 24 (9%) | 252 |
0.126 (1.00) |
0.849 (1.00) |
0.0908 (1.00) |
0.895 (1.00) |
0.0634 (1.00) |
0.648 (1.00) |
| del 4q34 3 | 80 (29%) | 196 |
0.783 (1.00) |
0.209 (1.00) |
0.69 (1.00) |
0.613 (1.00) |
0.303 (1.00) |
0.396 (1.00) |
| del 5p15 33 | 32 (12%) | 244 |
0.975 (1.00) |
0.143 (1.00) |
0.349 (1.00) |
0.0846 (1.00) |
0.00493 (1.00) |
0.0709 (1.00) |
| del 5q33 3 | 37 (13%) | 239 |
0.0387 (1.00) |
0.828 (1.00) |
1 (1.00) |
0.726 (1.00) |
0.0587 (1.00) |
0.453 (1.00) |
| del 6q24 3 | 46 (17%) | 230 |
0.0044 (1.00) |
0.325 (1.00) |
0.419 (1.00) |
0.5 (1.00) |
0.00126 (0.311) |
0.491 (1.00) |
| del 11p15 5 | 61 (22%) | 215 |
0.217 (1.00) |
0.0641 (1.00) |
0.19 (1.00) |
0.322 (1.00) |
0.00406 (0.978) |
1 (1.00) |
| del 11q25 | 22 (8%) | 254 |
0.0804 (1.00) |
0.858 (1.00) |
1 (1.00) |
0.215 (1.00) |
0.168 (1.00) |
0.812 (1.00) |
| del 12q12 | 37 (13%) | 239 |
0.957 (1.00) |
0.958 (1.00) |
0.595 (1.00) |
0.895 (1.00) |
0.00325 (0.789) |
1 (1.00) |
| del 13q21 2 | 83 (30%) | 193 |
0.161 (1.00) |
0.712 (1.00) |
0.431 (1.00) |
0.0886 (1.00) |
0.102 (1.00) |
0.4 (1.00) |
| del 13q34 | 61 (22%) | 215 |
0.0901 (1.00) |
0.813 (1.00) |
1 (1.00) |
0.936 (1.00) |
0.668 (1.00) |
0.352 (1.00) |
| del 17q25 3 | 15 (5%) | 261 |
0.896 (1.00) |
0.423 (1.00) |
0.791 (1.00) |
0.196 (1.00) |
0.893 (1.00) |
0.573 (1.00) |
| del 18q23 | 43 (16%) | 233 |
0.588 (1.00) |
0.166 (1.00) |
0.407 (1.00) |
0.882 (1.00) |
0.777 (1.00) |
0.724 (1.00) |
| del 22q13 31 | 42 (15%) | 234 |
0.0951 (1.00) |
0.0754 (1.00) |
0.867 (1.00) |
0.117 (1.00) |
0.0127 (1.00) |
0.859 (1.00) |
| del xp21 1 | 53 (19%) | 223 |
0.522 (1.00) |
0.627 (1.00) |
0.17 (1.00) |
0.219 (1.00) |
0.925 (1.00) |
0.87 (1.00) |
| del xq21 1 | 36 (13%) | 240 |
0.459 (1.00) |
0.0933 (1.00) |
0.72 (1.00) |
0.843 (1.00) |
0.184 (1.00) |
0.851 (1.00) |
P value = 0.000875 (t-test), Q value = 0.22
Table S1. Gene #1: 'amp_1q22' versus Clinical Feature #2: 'AGE'
| nPatients | Mean (Std.Dev) | |
|---|---|---|
| ALL | 276 | 43.1 (13.3) |
| AMP PEAK 1(1Q22) MUTATED | 26 | 51.9 (12.7) |
| AMP PEAK 1(1Q22) WILD-TYPE | 250 | 42.2 (13.1) |
Figure S1. Get High-res Image Gene #1: 'amp_1q22' versus Clinical Feature #2: 'AGE'
P value = 1.23e-06 (t-test), Q value = 0.00033
Table S2. Gene #2: 'amp_1q32.1' versus Clinical Feature #2: 'AGE'
| nPatients | Mean (Std.Dev) | |
|---|---|---|
| ALL | 276 | 43.1 (13.3) |
| AMP PEAK 2(1Q32.1) MUTATED | 28 | 55.3 (11.5) |
| AMP PEAK 2(1Q32.1) WILD-TYPE | 248 | 41.7 (12.8) |
Figure S2. Get High-res Image Gene #2: 'amp_1q32.1' versus Clinical Feature #2: 'AGE'
P value = 0.000724 (logrank test), Q value = 0.18
Table S3. Gene #4: 'amp_3q26.32' versus Clinical Feature #1: 'Time to Death'
| nPatients | nDeath | Duration Range (Median), Month | |
|---|---|---|---|
| ALL | 275 | 59 | 0.0 - 211.2 (15.4) |
| AMP PEAK 4(3Q26.32) MUTATED | 14 | 5 | 0.2 - 41.1 (9.7) |
| AMP PEAK 4(3Q26.32) WILD-TYPE | 261 | 54 | 0.0 - 211.2 (15.5) |
Figure S3. Get High-res Image Gene #4: 'amp_3q26.32' versus Clinical Feature #1: 'Time to Death'
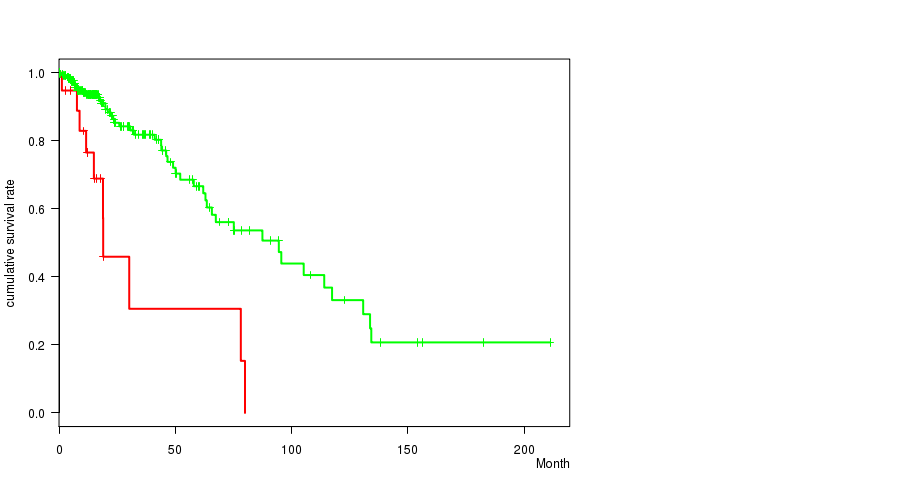
P value = 0.000232 (logrank test), Q value = 0.059
Table S4. Gene #7: 'amp_7p11.2' versus Clinical Feature #1: 'Time to Death'
| nPatients | nDeath | Duration Range (Median), Month | |
|---|---|---|---|
| ALL | 275 | 59 | 0.0 - 211.2 (15.4) |
| AMP PEAK 7(7P11.2) MUTATED | 72 | 29 | 0.1 - 211.2 (15.5) |
| AMP PEAK 7(7P11.2) WILD-TYPE | 203 | 30 | 0.0 - 182.3 (15.4) |
Figure S4. Get High-res Image Gene #7: 'amp_7p11.2' versus Clinical Feature #1: 'Time to Death'
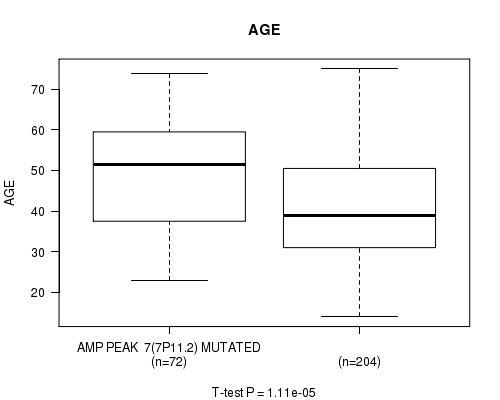
P value = 1.11e-05 (t-test), Q value = 0.0029
Table S5. Gene #7: 'amp_7p11.2' versus Clinical Feature #2: 'AGE'
| nPatients | Mean (Std.Dev) | |
|---|---|---|
| ALL | 276 | 43.1 (13.3) |
| AMP PEAK 7(7P11.2) MUTATED | 72 | 49.3 (13.4) |
| AMP PEAK 7(7P11.2) WILD-TYPE | 204 | 40.9 (12.6) |
Figure S5. Get High-res Image Gene #7: 'amp_7p11.2' versus Clinical Feature #2: 'AGE'
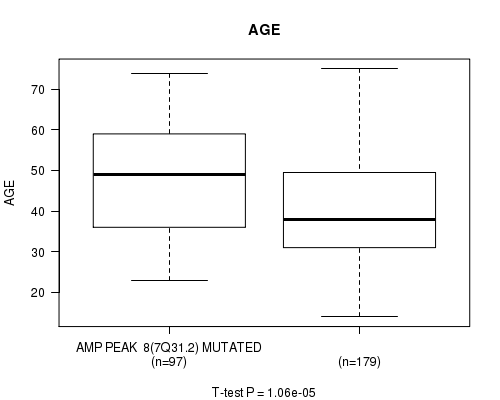
P value = 1.06e-05 (t-test), Q value = 0.0028
Table S6. Gene #8: 'amp_7q31.2' versus Clinical Feature #2: 'AGE'
| nPatients | Mean (Std.Dev) | |
|---|---|---|
| ALL | 276 | 43.1 (13.3) |
| AMP PEAK 8(7Q31.2) MUTATED | 97 | 47.9 (13.1) |
| AMP PEAK 8(7Q31.2) WILD-TYPE | 179 | 40.5 (12.7) |
Figure S6. Get High-res Image Gene #8: 'amp_7q31.2' versus Clinical Feature #2: 'AGE'
P value = 2.79e-06 (t-test), Q value = 0.00074
Table S7. Gene #9: 'amp_7q32.3' versus Clinical Feature #2: 'AGE'
| nPatients | Mean (Std.Dev) | |
|---|---|---|
| ALL | 276 | 43.1 (13.3) |
| AMP PEAK 9(7Q32.3) MUTATED | 102 | 48.0 (13.0) |
| AMP PEAK 9(7Q32.3) WILD-TYPE | 174 | 40.2 (12.7) |
Figure S7. Get High-res Image Gene #9: 'amp_7q32.3' versus Clinical Feature #2: 'AGE'

P value = 1.44e-05 (logrank test), Q value = 0.0037
Table S8. Gene #15: 'amp_12q14.1' versus Clinical Feature #1: 'Time to Death'
| nPatients | nDeath | Duration Range (Median), Month | |
|---|---|---|---|
| ALL | 275 | 59 | 0.0 - 211.2 (15.4) |
| AMP PEAK 15(12Q14.1) MUTATED | 19 | 10 | 1.2 - 80.0 (15.0) |
| AMP PEAK 15(12Q14.1) WILD-TYPE | 256 | 49 | 0.0 - 211.2 (15.5) |
Figure S8. Get High-res Image Gene #15: 'amp_12q14.1' versus Clinical Feature #1: 'Time to Death'
P value = 0.000759 (logrank test), Q value = 0.19
Table S9. Gene #17: 'amp_17q24.3' versus Clinical Feature #1: 'Time to Death'
| nPatients | nDeath | Duration Range (Median), Month | |
|---|---|---|---|
| ALL | 275 | 59 | 0.0 - 211.2 (15.4) |
| AMP PEAK 17(17Q24.3) MUTATED | 18 | 9 | 6.0 - 78.2 (17.6) |
| AMP PEAK 17(17Q24.3) WILD-TYPE | 257 | 50 | 0.0 - 211.2 (15.1) |
Figure S9. Get High-res Image Gene #17: 'amp_17q24.3' versus Clinical Feature #1: 'Time to Death'
P value = 8.98e-06 (logrank test), Q value = 0.0024
Table S10. Gene #19: 'amp_19q13.2' versus Clinical Feature #1: 'Time to Death'
| nPatients | nDeath | Duration Range (Median), Month | |
|---|---|---|---|
| ALL | 275 | 59 | 0.0 - 211.2 (15.4) |
| AMP PEAK 19(19Q13.2) MUTATED | 18 | 7 | 0.0 - 43.9 (14.1) |
| AMP PEAK 19(19Q13.2) WILD-TYPE | 257 | 52 | 0.1 - 211.2 (15.7) |
Figure S10. Get High-res Image Gene #19: 'amp_19q13.2' versus Clinical Feature #1: 'Time to Death'
P value = 4.18e-06 (t-test), Q value = 0.0011
Table S11. Gene #19: 'amp_19q13.2' versus Clinical Feature #2: 'AGE'
| nPatients | Mean (Std.Dev) | |
|---|---|---|
| ALL | 276 | 43.1 (13.3) |
| AMP PEAK 19(19Q13.2) MUTATED | 18 | 54.6 (8.1) |
| AMP PEAK 19(19Q13.2) WILD-TYPE | 258 | 42.3 (13.3) |
Figure S11. Get High-res Image Gene #19: 'amp_19q13.2' versus Clinical Feature #2: 'AGE'
P value = 4.97e-05 (t-test), Q value = 0.013
Table S12. Gene #21: 'del_1p36.31' versus Clinical Feature #2: 'AGE'
| nPatients | Mean (Std.Dev) | |
|---|---|---|
| ALL | 276 | 43.1 (13.3) |
| DEL PEAK 1(1P36.31) MUTATED | 107 | 47.2 (13.1) |
| DEL PEAK 1(1P36.31) WILD-TYPE | 169 | 40.5 (12.8) |
Figure S12. Get High-res Image Gene #21: 'del_1p36.31' versus Clinical Feature #2: 'AGE'
P value = 7.74e-18 (Fisher's exact test), Q value = 2.1e-15
Table S13. Gene #21: 'del_1p36.31' versus Clinical Feature #5: 'HISTOLOGICAL.TYPE'
| nPatients | ASTROCYTOMA | OLIGOASTROCYTOMA | OLIGODENDROGLIOMA |
|---|---|---|---|
| ALL | 88 | 76 | 112 |
| DEL PEAK 1(1P36.31) MUTATED | 10 | 20 | 77 |
| DEL PEAK 1(1P36.31) WILD-TYPE | 78 | 56 | 35 |
Figure S13. Get High-res Image Gene #21: 'del_1p36.31' versus Clinical Feature #5: 'HISTOLOGICAL.TYPE'
P value = 0.000458 (t-test), Q value = 0.12
Table S14. Gene #22: 'del_1p32.3' versus Clinical Feature #2: 'AGE'
| nPatients | Mean (Std.Dev) | |
|---|---|---|
| ALL | 276 | 43.1 (13.3) |
| DEL PEAK 2(1P32.3) MUTATED | 100 | 46.8 (13.0) |
| DEL PEAK 2(1P32.3) WILD-TYPE | 176 | 41.0 (13.1) |
Figure S14. Get High-res Image Gene #22: 'del_1p32.3' versus Clinical Feature #2: 'AGE'
P value = 5.21e-19 (Fisher's exact test), Q value = 1.4e-16
Table S15. Gene #22: 'del_1p32.3' versus Clinical Feature #5: 'HISTOLOGICAL.TYPE'
| nPatients | ASTROCYTOMA | OLIGOASTROCYTOMA | OLIGODENDROGLIOMA |
|---|---|---|---|
| ALL | 88 | 76 | 112 |
| DEL PEAK 2(1P32.3) MUTATED | 8 | 17 | 75 |
| DEL PEAK 2(1P32.3) WILD-TYPE | 80 | 59 | 37 |
Figure S15. Get High-res Image Gene #22: 'del_1p32.3' versus Clinical Feature #5: 'HISTOLOGICAL.TYPE'
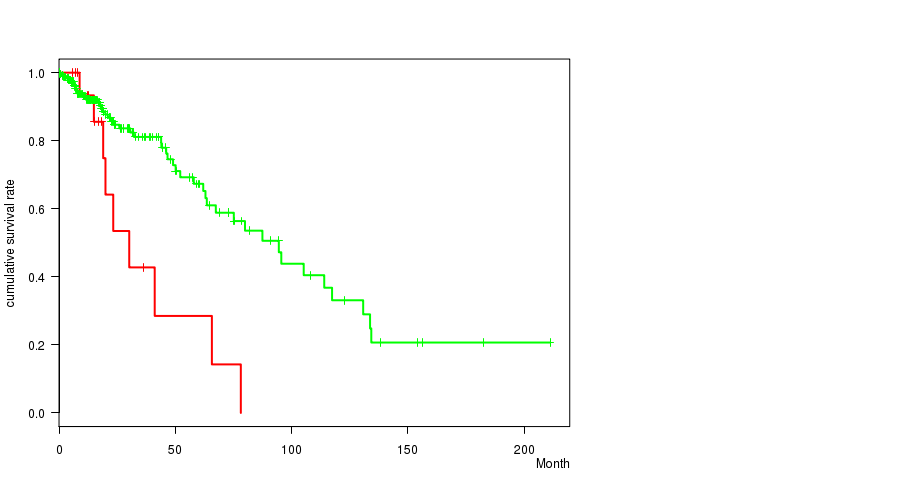
P value = 9.25e-05 (logrank test), Q value = 0.024
Table S16. Gene #30: 'del_6p25.3' versus Clinical Feature #1: 'Time to Death'
| nPatients | nDeath | Duration Range (Median), Month | |
|---|---|---|---|
| ALL | 275 | 59 | 0.0 - 211.2 (15.4) |
| DEL PEAK 10(6P25.3) MUTATED | 28 | 11 | 0.2 - 94.5 (16.8) |
| DEL PEAK 10(6P25.3) WILD-TYPE | 247 | 48 | 0.0 - 211.2 (15.3) |
Figure S16. Get High-res Image Gene #30: 'del_6p25.3' versus Clinical Feature #1: 'Time to Death'
P value = 8.29e-08 (logrank test), Q value = 2.2e-05
Table S17. Gene #32: 'del_9p21.3' versus Clinical Feature #1: 'Time to Death'
| nPatients | nDeath | Duration Range (Median), Month | |
|---|---|---|---|
| ALL | 275 | 59 | 0.0 - 211.2 (15.4) |
| DEL PEAK 12(9P21.3) MUTATED | 92 | 32 | 0.1 - 117.4 (14.8) |
| DEL PEAK 12(9P21.3) WILD-TYPE | 183 | 27 | 0.0 - 211.2 (15.4) |
Figure S17. Get High-res Image Gene #32: 'del_9p21.3' versus Clinical Feature #1: 'Time to Death'
P value = 7.44e-05 (t-test), Q value = 0.019
Table S18. Gene #32: 'del_9p21.3' versus Clinical Feature #2: 'AGE'
| nPatients | Mean (Std.Dev) | |
|---|---|---|
| ALL | 276 | 43.1 (13.3) |
| DEL PEAK 12(9P21.3) MUTATED | 92 | 47.6 (13.2) |
| DEL PEAK 12(9P21.3) WILD-TYPE | 184 | 40.9 (12.9) |
Figure S18. Get High-res Image Gene #32: 'del_9p21.3' versus Clinical Feature #2: 'AGE'
P value = 3.21e-06 (logrank test), Q value = 0.00085
Table S19. Gene #33: 'del_10q26.3' versus Clinical Feature #1: 'Time to Death'
| nPatients | nDeath | Duration Range (Median), Month | |
|---|---|---|---|
| ALL | 275 | 59 | 0.0 - 211.2 (15.4) |
| DEL PEAK 13(10Q26.3) MUTATED | 79 | 34 | 0.1 - 156.2 (16.0) |
| DEL PEAK 13(10Q26.3) WILD-TYPE | 196 | 25 | 0.0 - 211.2 (15.1) |
Figure S19. Get High-res Image Gene #33: 'del_10q26.3' versus Clinical Feature #1: 'Time to Death'
P value = 0.000853 (t-test), Q value = 0.21
Table S20. Gene #33: 'del_10q26.3' versus Clinical Feature #2: 'AGE'
| nPatients | Mean (Std.Dev) | |
|---|---|---|
| ALL | 276 | 43.1 (13.3) |
| DEL PEAK 13(10Q26.3) MUTATED | 79 | 47.5 (13.8) |
| DEL PEAK 13(10Q26.3) WILD-TYPE | 197 | 41.4 (12.8) |
Figure S20. Get High-res Image Gene #33: 'del_10q26.3' versus Clinical Feature #2: 'AGE'
P value = 0.000339 (logrank test), Q value = 0.086
Table S21. Gene #39: 'del_14q24.3' versus Clinical Feature #1: 'Time to Death'
| nPatients | nDeath | Duration Range (Median), Month | |
|---|---|---|---|
| ALL | 275 | 59 | 0.0 - 211.2 (15.4) |
| DEL PEAK 19(14Q24.3) MUTATED | 59 | 24 | 0.2 - 130.8 (17.5) |
| DEL PEAK 19(14Q24.3) WILD-TYPE | 216 | 35 | 0.0 - 211.2 (14.9) |
Figure S21. Get High-res Image Gene #39: 'del_14q24.3' versus Clinical Feature #1: 'Time to Death'
P value = 1.24e-10 (Fisher's exact test), Q value = 3.3e-08
Table S22. Gene #42: 'del_19q13.42' versus Clinical Feature #5: 'HISTOLOGICAL.TYPE'
| nPatients | ASTROCYTOMA | OLIGOASTROCYTOMA | OLIGODENDROGLIOMA |
|---|---|---|---|
| ALL | 88 | 76 | 112 |
| DEL PEAK 22(19Q13.42) MUTATED | 29 | 31 | 86 |
| DEL PEAK 22(19Q13.42) WILD-TYPE | 59 | 45 | 26 |
Figure S22. Get High-res Image Gene #42: 'del_19q13.42' versus Clinical Feature #5: 'HISTOLOGICAL.TYPE'
-
Copy number data file = transformed.cor.cli.txt
-
Clinical data file = LGG-TP.merged_data.txt
-
Number of patients = 276
-
Number of significantly focal cnvs = 45
-
Number of selected clinical features = 6
-
Exclude genes that fewer than K tumors have mutations, K = 3
For survival clinical features, the Kaplan-Meier survival curves of tumors with and without gene mutations were plotted and the statistical significance P values were estimated by logrank test (Bland and Altman 2004) using the 'survdiff' function in R
For continuous numerical clinical features, two-tailed Student's t test with unequal variance (Lehmann and Romano 2005) was applied to compare the clinical values between tumors with and without gene mutations using 't.test' function in R
For binary or multi-class clinical features (nominal or ordinal), two-tailed Fisher's exact tests (Fisher 1922) were used to estimate the P values using the 'fisher.test' function in R
For multiple hypothesis correction, Q value is the False Discovery Rate (FDR) analogue of the P value (Benjamini and Hochberg 1995), defined as the minimum FDR at which the test may be called significant. We used the 'Benjamini and Hochberg' method of 'p.adjust' function in R to convert P values into Q values.
In addition to the links below, the full results of the analysis summarized in this report can also be downloaded programmatically using firehose_get, or interactively from either the Broad GDAC website or TCGA Data Coordination Center Portal.