This pipeline uses various statistical tests to identify genes whose promoter methylation levels correlated to selected clinical features.
Testing the association between 20044 genes and 6 clinical features across 276 samples, statistically thresholded by Q value < 0.05, 5 clinical features related to at least one genes.
-
437 genes correlated to 'AGE'.
-
TRIM58 , SHISA2 , TCHH , LOC150786 , GALNT14 , ...
-
15 genes correlated to 'GENDER'.
-
ALG11__1 , UTP14C , POLDIP3 , RNU12 , WBP11P1 , ...
-
1 gene correlated to 'KARNOFSKY.PERFORMANCE.SCORE'.
-
ELOVL4
-
1257 genes correlated to 'HISTOLOGICAL.TYPE'.
-
BVES , MAPKAP1 , SLC2A4RG , REST , CCDC88C , ...
-
140 genes correlated to 'RADIATIONS.RADIATION.REGIMENINDICATION'.
-
HSPA13 , ANKRD28 , FYTTD1 , KIAA0226 , DAZL , ...
-
No genes correlated to 'Time to Death'
Complete statistical result table is provided in Supplement Table 1
Table 1. Get Full Table This table shows the clinical features, statistical methods used, and the number of genes that are significantly associated with each clinical feature at Q value < 0.05.
| Clinical feature | Statistical test | Significant genes | Associated with | Associated with | ||
|---|---|---|---|---|---|---|
| Time to Death | Cox regression test | N=0 | ||||
| AGE | Spearman correlation test | N=437 | older | N=231 | younger | N=206 |
| GENDER | t test | N=15 | male | N=5 | female | N=10 |
| KARNOFSKY PERFORMANCE SCORE | Spearman correlation test | N=1 | higher score | N=1 | lower score | N=0 |
| HISTOLOGICAL TYPE | ANOVA test | N=1257 | ||||
| RADIATIONS RADIATION REGIMENINDICATION | t test | N=140 | yes | N=86 | no | N=54 |
Table S1. Basic characteristics of clinical feature: 'Time to Death'
| Time to Death | Duration (Months) | 0-211.2 (median=15.3) |
| censored | N = 220 | |
| death | N = 55 | |
| Significant markers | N = 0 |
Table S2. Basic characteristics of clinical feature: 'AGE'
| AGE | Mean (SD) | 43 (13) |
| Significant markers | N = 437 | |
| pos. correlated | 231 | |
| neg. correlated | 206 |
Table S3. Get Full Table List of top 10 genes significantly correlated to 'AGE' by Spearman correlation test
| SpearmanCorr | corrP | Q | |
|---|---|---|---|
| TRIM58 | 0.5629 | 1.793e-24 | 3.59e-20 |
| SHISA2 | 0.5417 | 1.904e-22 | 3.82e-18 |
| TCHH | 0.5402 | 2.627e-22 | 5.26e-18 |
| LOC150786 | 0.5159 | 3.554e-20 | 7.12e-16 |
| GALNT14 | 0.5146 | 4.596e-20 | 9.21e-16 |
| FOXE3 | 0.5051 | 3.823e-19 | 7.66e-15 |
| HOXD8 | 0.4995 | 8.025e-19 | 1.61e-14 |
| TFAP2B | 0.4946 | 1.955e-18 | 3.92e-14 |
| RELN | 0.485 | 1.083e-17 | 2.17e-13 |
| PAX9 | 0.4826 | 1.668e-17 | 3.34e-13 |
Figure S1. Get High-res Image As an example, this figure shows the association of TRIM58 to 'AGE'. P value = 1.79e-24 with Spearman correlation analysis. The straight line presents the best linear regression.
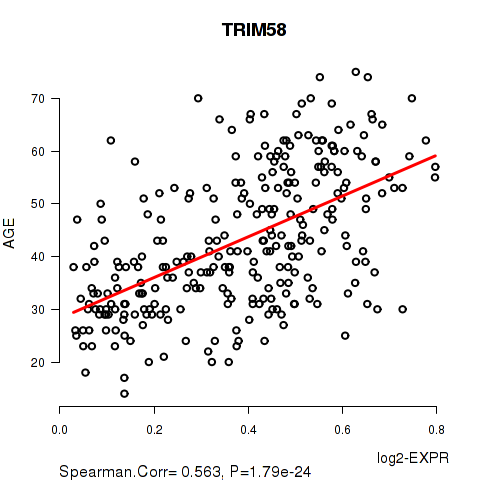
Table S4. Basic characteristics of clinical feature: 'GENDER'
| GENDER | Labels | N |
| FEMALE | 128 | |
| MALE | 148 | |
| Significant markers | N = 15 | |
| Higher in MALE | 5 | |
| Higher in FEMALE | 10 |
Table S5. Get Full Table List of top 10 genes differentially expressed by 'GENDER'
| T(pos if higher in 'MALE') | ttestP | Q | AUC | |
|---|---|---|---|---|
| ALG11__1 | 27.85 | 2.154e-66 | 4.32e-62 | 0.979 |
| UTP14C | 27.85 | 2.154e-66 | 4.32e-62 | 0.979 |
| POLDIP3 | -18.58 | 1.609e-46 | 3.22e-42 | 0.9405 |
| RNU12 | -18.58 | 1.609e-46 | 3.22e-42 | 0.9405 |
| WBP11P1 | 9.48 | 2.142e-18 | 4.29e-14 | 0.8143 |
| TFDP1 | -9.33 | 4.645e-18 | 9.31e-14 | 0.8708 |
| KIF4B | -9.38 | 9.668e-18 | 1.94e-13 | 0.7695 |
| HAX1 | -9.01 | 2.753e-16 | 5.52e-12 | 0.7959 |
| ZNF839 | -7.42 | 1.714e-12 | 3.43e-08 | 0.7693 |
| LOC389791 | 6.43 | 5.688e-10 | 1.14e-05 | 0.7238 |
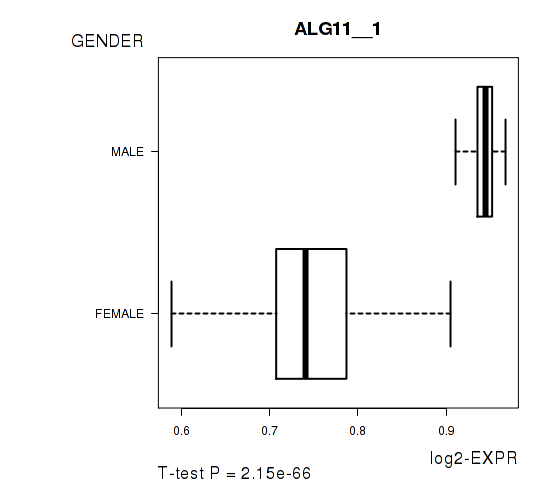
Figure S2. Get High-res Image As an example, this figure shows the association of ALG11__1 to 'GENDER'. P value = 2.15e-66 with T-test analysis.
One gene related to 'KARNOFSKY.PERFORMANCE.SCORE'.
Table S6. Basic characteristics of clinical feature: 'KARNOFSKY.PERFORMANCE.SCORE'
| KARNOFSKY.PERFORMANCE.SCORE | Mean (SD) | 88.09 (11) |
| Significant markers | N = 1 | |
| pos. correlated | 1 | |
| neg. correlated | 0 |
Table S7. Get Full Table List of one gene significantly correlated to 'KARNOFSKY.PERFORMANCE.SCORE' by Spearman correlation test
| SpearmanCorr | corrP | Q | |
|---|---|---|---|
| ELOVL4 | 0.4032 | 1.133e-06 | 0.0227 |
Figure S3. Get High-res Image As an example, this figure shows the association of ELOVL4 to 'KARNOFSKY.PERFORMANCE.SCORE'. P value = 1.13e-06 with Spearman correlation analysis. The straight line presents the best linear regression.
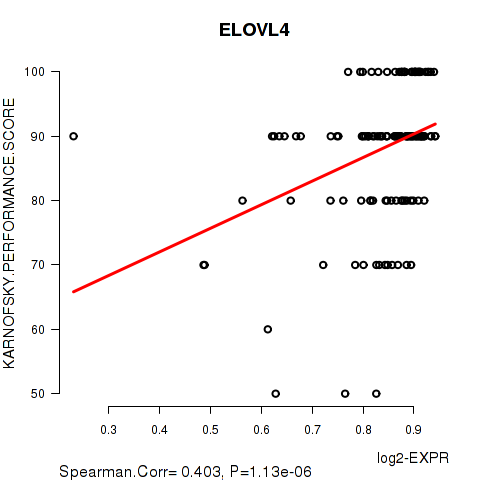
Table S8. Basic characteristics of clinical feature: 'HISTOLOGICAL.TYPE'
| HISTOLOGICAL.TYPE | Labels | N |
| ASTROCYTOMA | 89 | |
| OLIGOASTROCYTOMA | 75 | |
| OLIGODENDROGLIOMA | 112 | |
| Significant markers | N = 1257 |
Table S9. Get Full Table List of top 10 genes differentially expressed by 'HISTOLOGICAL.TYPE'
| ANOVA_P | Q | |
|---|---|---|
| BVES | 9.51e-22 | 1.91e-17 |
| MAPKAP1 | 9.39e-21 | 1.88e-16 |
| SLC2A4RG | 3.34e-20 | 6.69e-16 |
| REST | 6.393e-20 | 1.28e-15 |
| CCDC88C | 9.009e-20 | 1.81e-15 |
| CBX2 | 1.021e-19 | 2.05e-15 |
| CTGF | 4.272e-19 | 8.56e-15 |
| GLIS3 | 2.083e-18 | 4.17e-14 |
| EMP1 | 9.121e-18 | 1.83e-13 |
| TMC6 | 1.909e-17 | 3.82e-13 |
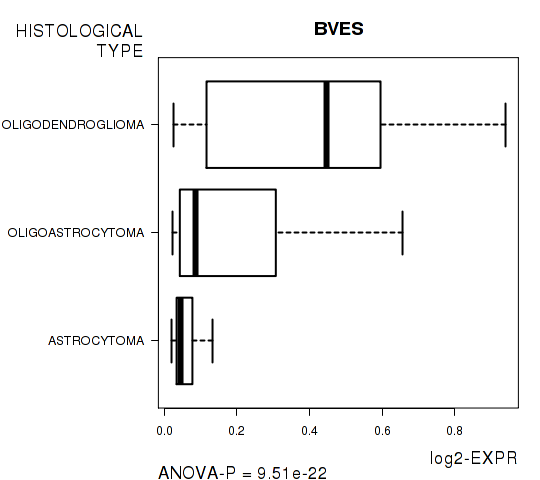
Figure S4. Get High-res Image As an example, this figure shows the association of BVES to 'HISTOLOGICAL.TYPE'. P value = 9.51e-22 with ANOVA analysis.
140 genes related to 'RADIATIONS.RADIATION.REGIMENINDICATION'.
Table S10. Basic characteristics of clinical feature: 'RADIATIONS.RADIATION.REGIMENINDICATION'
| RADIATIONS.RADIATION.REGIMENINDICATION | Labels | N |
| NO | 85 | |
| YES | 191 | |
| Significant markers | N = 140 | |
| Higher in YES | 86 | |
| Higher in NO | 54 |
Table S11. Get Full Table List of top 10 genes differentially expressed by 'RADIATIONS.RADIATION.REGIMENINDICATION'
| T(pos if higher in 'YES') | ttestP | Q | AUC | |
|---|---|---|---|---|
| HSPA13 | 8.33 | 3.95e-15 | 7.92e-11 | 0.7126 |
| ANKRD28 | 7.87 | 8.606e-14 | 1.72e-09 | 0.7143 |
| FYTTD1 | 6.91 | 3.804e-11 | 7.62e-07 | 0.6955 |
| KIAA0226 | 6.91 | 3.804e-11 | 7.62e-07 | 0.6955 |
| DAZL | 6.9 | 3.938e-11 | 7.89e-07 | 0.6896 |
| PPP1R8 | 6.79 | 8.213e-11 | 1.65e-06 | 0.7259 |
| FLRT3 | 6.76 | 8.755e-11 | 1.75e-06 | 0.702 |
| MACROD2 | 6.76 | 8.755e-11 | 1.75e-06 | 0.702 |
| AASDH | 6.66 | 1.957e-10 | 3.92e-06 | 0.7097 |
| PCYOX1 | 6.57 | 2.497e-10 | 5e-06 | 0.6325 |
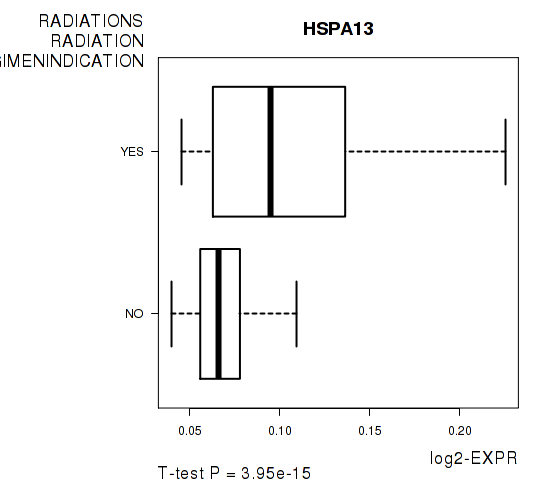
Figure S5. Get High-res Image As an example, this figure shows the association of HSPA13 to 'RADIATIONS.RADIATION.REGIMENINDICATION'. P value = 3.95e-15 with T-test analysis.
-
Expresson data file = LGG-TP.meth.by_min_clin_corr.data.txt
-
Clinical data file = LGG-TP.merged_data.txt
-
Number of patients = 276
-
Number of genes = 20044
-
Number of clinical features = 6
For survival clinical features, Wald's test in univariate Cox regression analysis with proportional hazards model (Andersen and Gill 1982) was used to estimate the P values using the 'coxph' function in R. Kaplan-Meier survival curves were plot using the four quartile subgroups of patients based on expression levels
For continuous numerical clinical features, Spearman's rank correlation coefficients (Spearman 1904) and two-tailed P values were estimated using 'cor.test' function in R
For two-class clinical features, two-tailed Student's t test with unequal variance (Lehmann and Romano 2005) was applied to compare the log2-expression levels between the two clinical classes using 't.test' function in R
For multi-class clinical features (ordinal or nominal), one-way analysis of variance (Howell 2002) was applied to compare the log2-expression levels between different clinical classes using 'anova' function in R
For multiple hypothesis correction, Q value is the False Discovery Rate (FDR) analogue of the P value (Benjamini and Hochberg 1995), defined as the minimum FDR at which the test may be called significant. We used the 'Benjamini and Hochberg' method of 'p.adjust' function in R to convert P values into Q values.
In addition to the links below, the full results of the analysis summarized in this report can also be downloaded programmatically using firehose_get, or interactively from either the Broad GDAC website or TCGA Data Coordination Center Portal.