This pipeline computes the correlation between significantly recurrent gene mutations and selected clinical features.
Testing the association between mutation status of 22 genes and 6 clinical features across 261 patients, 14 significant findings detected with Q value < 0.25.
-
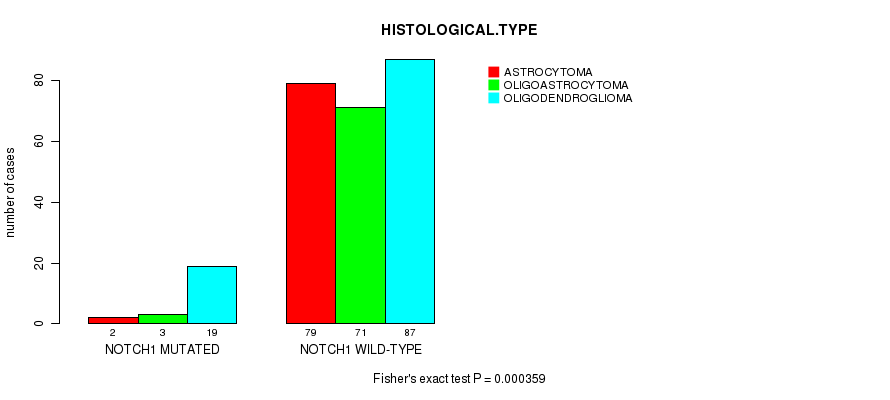
NOTCH1 mutation correlated to 'HISTOLOGICAL.TYPE'.
-
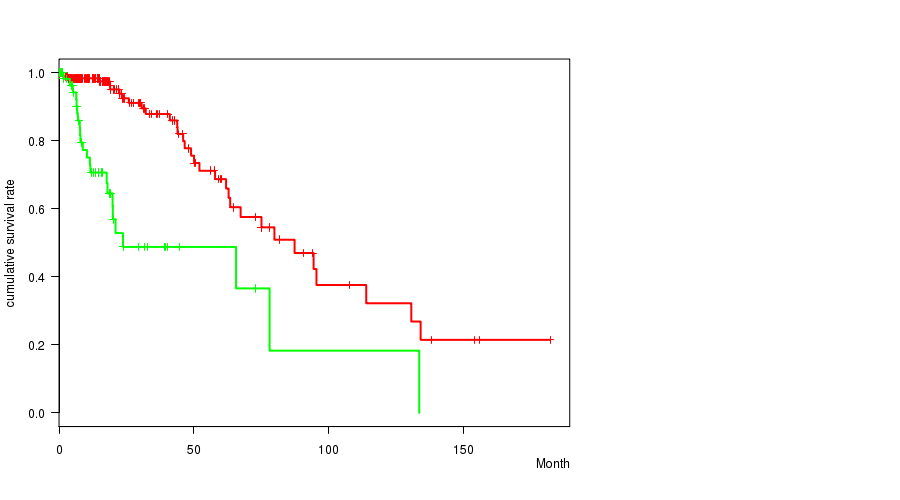
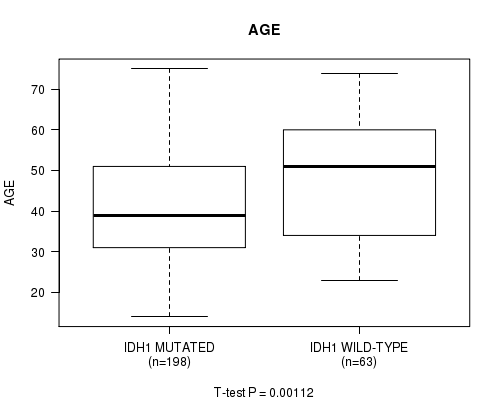
IDH1 mutation correlated to 'Time to Death' and 'AGE'.
-
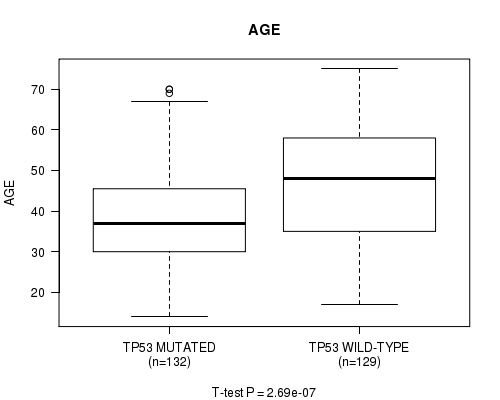
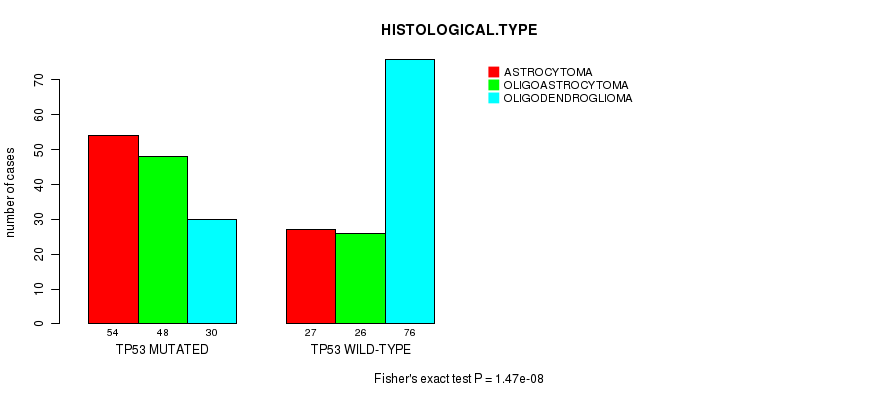
TP53 mutation correlated to 'AGE' and 'HISTOLOGICAL.TYPE'.
-
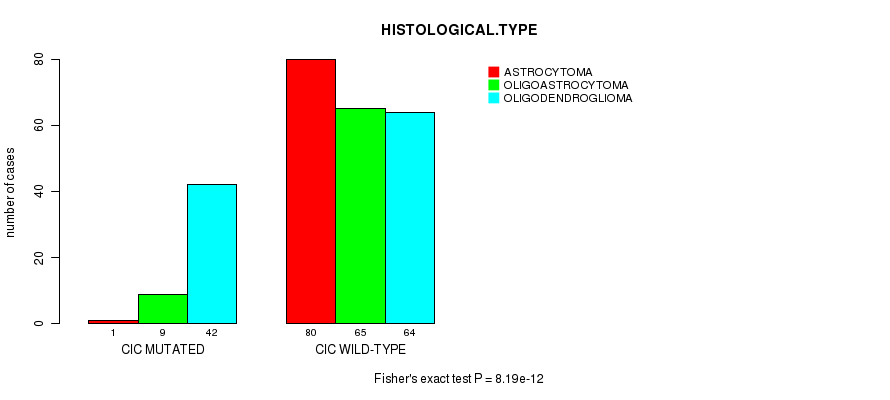
CIC mutation correlated to 'HISTOLOGICAL.TYPE'.
-
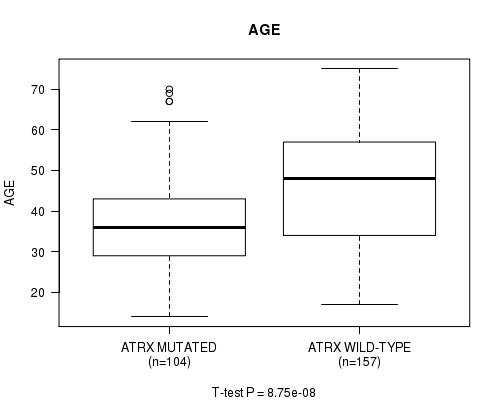
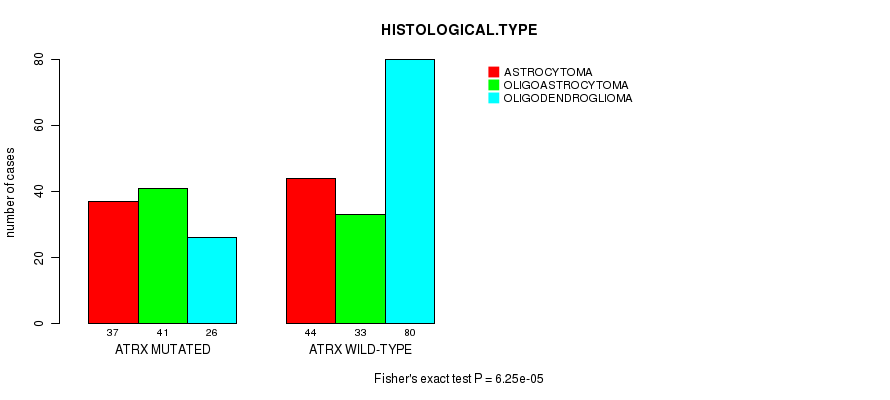
ATRX mutation correlated to 'AGE' and 'HISTOLOGICAL.TYPE'.
-
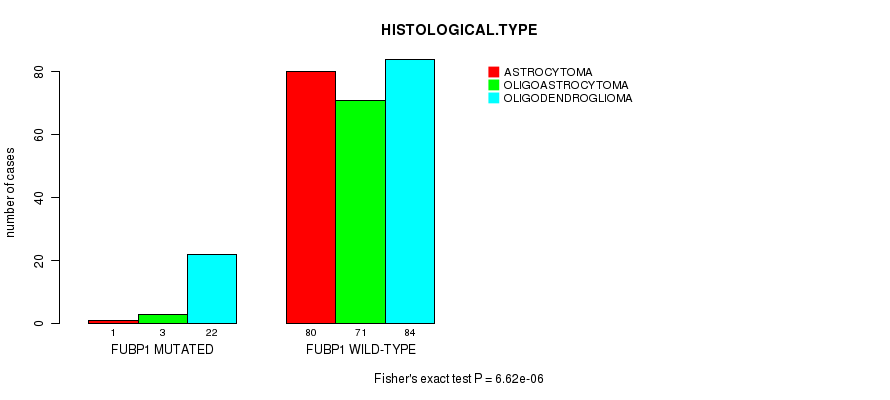
FUBP1 mutation correlated to 'HISTOLOGICAL.TYPE'.
-
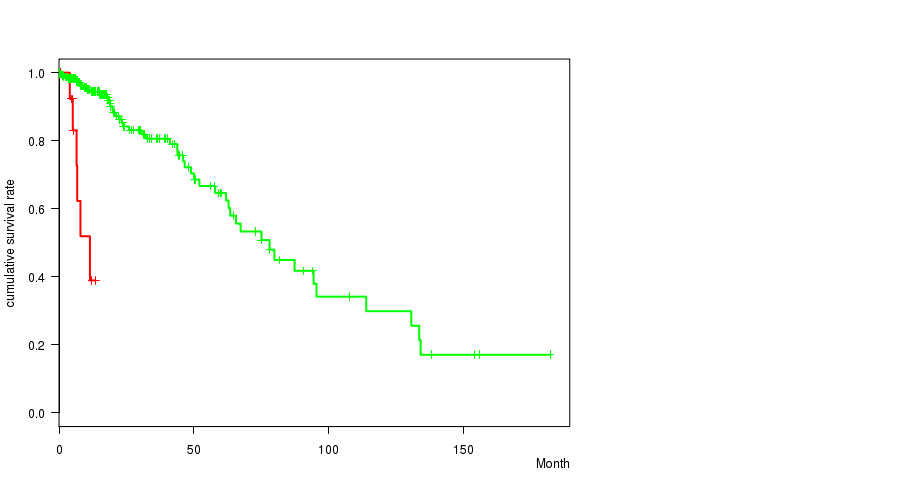
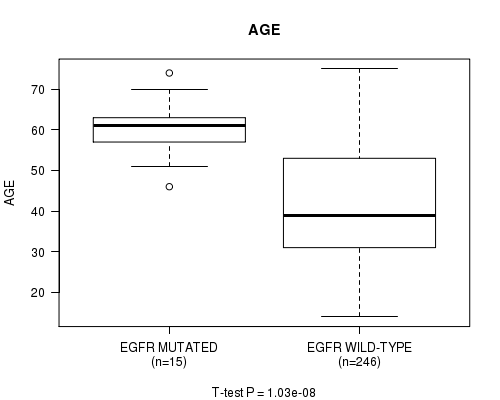
EGFR mutation correlated to 'Time to Death' and 'AGE'.
-
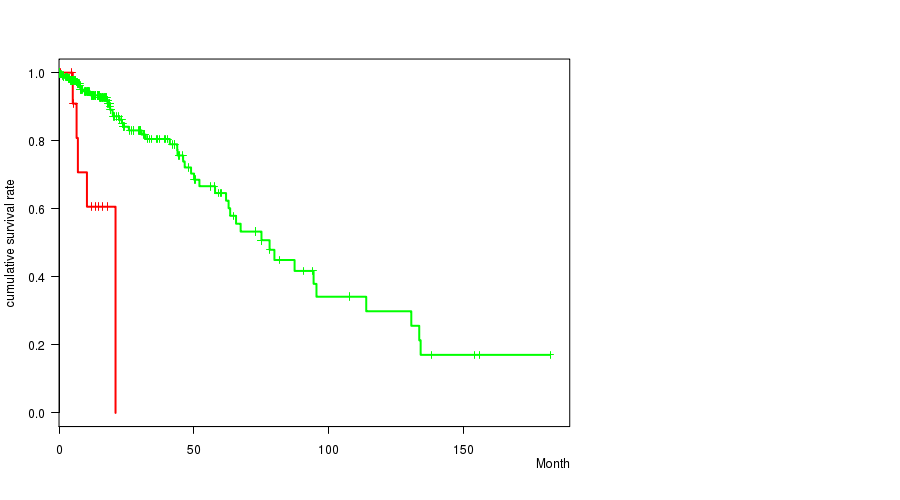
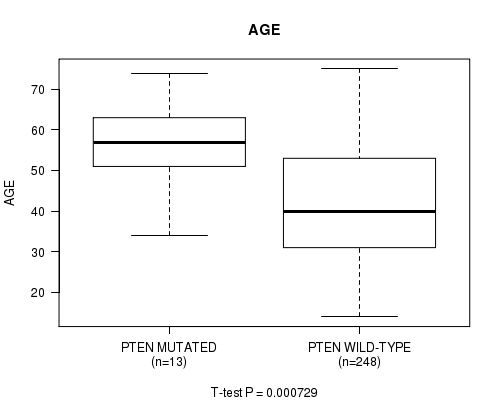
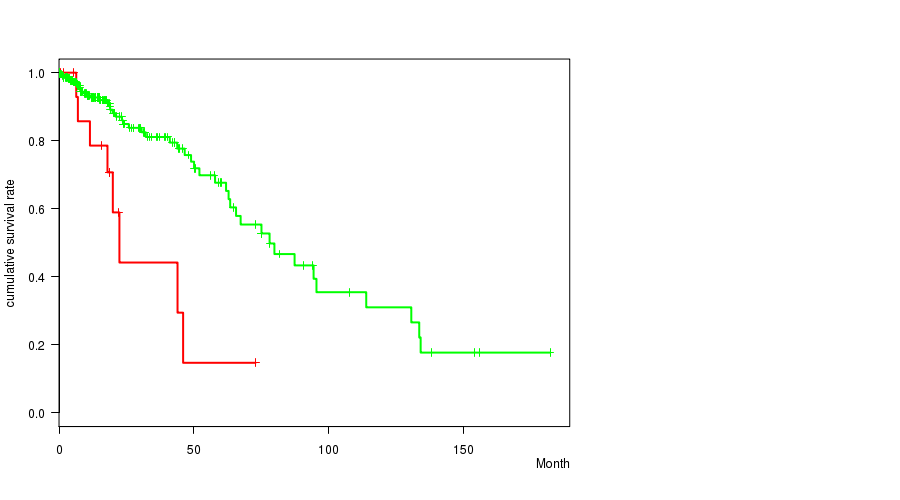
PTEN mutation correlated to 'Time to Death' and 'AGE'.
-
NF1 mutation correlated to 'Time to Death'.
Table 1. Get Full Table Overview of the association between mutation status of 22 genes and 6 clinical features. Shown in the table are P values (Q values). Thresholded by Q value < 0.25, 14 significant findings detected.
|
Clinical Features |
Time to Death |
AGE | GENDER |
KARNOFSKY PERFORMANCE SCORE |
HISTOLOGICAL TYPE |
RADIATIONS RADIATION REGIMENINDICATION |
||
| nMutated (%) | nWild-Type | logrank test | t-test | Fisher's exact test | t-test | Fisher's exact test | Fisher's exact test | |
| IDH1 | 198 (76%) | 63 |
9.52e-08 (1.18e-05) |
0.00112 (0.13) |
0.11 (1.00) |
0.147 (1.00) |
0.0237 (1.00) |
0.758 (1.00) |
| TP53 | 132 (51%) | 129 |
0.519 (1.00) |
2.69e-07 (3.31e-05) |
0.0822 (1.00) |
0.329 (1.00) |
1.47e-08 (1.85e-06) |
0.0181 (1.00) |
| ATRX | 104 (40%) | 157 |
0.142 (1.00) |
8.75e-08 (1.09e-05) |
0.0312 (1.00) |
0.318 (1.00) |
6.25e-05 (0.0075) |
0.0599 (1.00) |
| EGFR | 15 (6%) | 246 |
2.57e-11 (3.29e-09) |
1.03e-08 (1.31e-06) |
1 (1.00) |
0.0759 (1.00) |
0.375 (1.00) |
0.154 (1.00) |
| PTEN | 13 (5%) | 248 |
5.75e-06 (0.000701) |
0.000729 (0.0853) |
0.574 (1.00) |
0.146 (1.00) |
0.00237 (0.272) |
0.762 (1.00) |
| NOTCH1 | 24 (9%) | 237 |
0.85 (1.00) |
0.0157 (1.00) |
0.669 (1.00) |
0.715 (1.00) |
0.000359 (0.0427) |
0.497 (1.00) |
| CIC | 52 (20%) | 209 |
0.0629 (1.00) |
0.304 (1.00) |
0.277 (1.00) |
0.515 (1.00) |
8.19e-12 (1.06e-09) |
0.068 (1.00) |
| FUBP1 | 26 (10%) | 235 |
1 (1.00) |
0.00247 (0.281) |
0.838 (1.00) |
0.87 (1.00) |
6.62e-06 (0.000801) |
1 (1.00) |
| NF1 | 19 (7%) | 242 |
0.00038 (0.0449) |
0.231 (1.00) |
0.816 (1.00) |
0.291 (1.00) |
0.0377 (1.00) |
0.202 (1.00) |
| PIK3CA | 24 (9%) | 237 |
0.0427 (1.00) |
0.0936 (1.00) |
0.831 (1.00) |
0.481 (1.00) |
0.0878 (1.00) |
0.497 (1.00) |
| IDH2 | 12 (5%) | 249 |
0.256 (1.00) |
0.0382 (1.00) |
0.772 (1.00) |
0.919 (1.00) |
0.00983 (1.00) |
1 (1.00) |
| STK19 | 5 (2%) | 256 |
0.688 (1.00) |
0.691 (1.00) |
0.659 (1.00) |
0.523 (1.00) |
0.177 (1.00) |
|
| PIK3R1 | 12 (5%) | 249 |
0.575 (1.00) |
0.0582 (1.00) |
0.235 (1.00) |
0.861 (1.00) |
0.272 (1.00) |
0.213 (1.00) |
| PCDHAC2 | 13 (5%) | 248 |
0.699 (1.00) |
0.185 (1.00) |
0.574 (1.00) |
0.456 (1.00) |
0.204 (1.00) |
0.127 (1.00) |
| CREBZF | 4 (2%) | 257 |
0.73 (1.00) |
0.215 (1.00) |
0.328 (1.00) |
0.349 (1.00) |
0.471 (1.00) |
1 (1.00) |
| EIF1AX | 4 (2%) | 257 |
0.384 (1.00) |
0.99 (1.00) |
0.13 (1.00) |
0.919 (1.00) |
0.185 (1.00) |
0.598 (1.00) |
| HTRA2 | 4 (2%) | 257 |
0.852 (1.00) |
0.136 (1.00) |
0.63 (1.00) |
0.566 (1.00) |
0.307 (1.00) |
|
| VAV3 | 6 (2%) | 255 |
0.39 (1.00) |
0.918 (1.00) |
0.413 (1.00) |
0.0439 (1.00) |
0.882 (1.00) |
0.395 (1.00) |
| SPANXE | 4 (2%) | 257 |
0.39 (1.00) |
0.987 (1.00) |
1 (1.00) |
0.388 (1.00) |
1 (1.00) |
|
| TCF12 | 8 (3%) | 253 |
0.3 (1.00) |
0.0906 (1.00) |
1 (1.00) |
0.422 (1.00) |
0.179 (1.00) |
0.281 (1.00) |
| SMARCA4 | 12 (5%) | 249 |
0.124 (1.00) |
0.162 (1.00) |
1 (1.00) |
0.0156 (1.00) |
0.702 (1.00) |
0.0626 (1.00) |
| BCOR | 8 (3%) | 253 |
0.915 (1.00) |
0.473 (1.00) |
0.0242 (1.00) |
0.0583 (1.00) |
0.349 (1.00) |
0.718 (1.00) |
P value = 0.000359 (Fisher's exact test), Q value = 0.043
Table S1. Gene #1: 'NOTCH1 MUTATION STATUS' versus Clinical Feature #5: 'HISTOLOGICAL.TYPE'
| nPatients | ASTROCYTOMA | OLIGOASTROCYTOMA | OLIGODENDROGLIOMA |
|---|---|---|---|
| ALL | 81 | 74 | 106 |
| NOTCH1 MUTATED | 2 | 3 | 19 |
| NOTCH1 WILD-TYPE | 79 | 71 | 87 |
Figure S1. Get High-res Image Gene #1: 'NOTCH1 MUTATION STATUS' versus Clinical Feature #5: 'HISTOLOGICAL.TYPE'
P value = 9.52e-08 (logrank test), Q value = 1.2e-05
Table S2. Gene #4: 'IDH1 MUTATION STATUS' versus Clinical Feature #1: 'Time to Death'
| nPatients | nDeath | Duration Range (Median), Month | |
|---|---|---|---|
| ALL | 261 | 55 | 0.0 - 182.3 (15.1) |
| IDH1 MUTATED | 198 | 32 | 0.0 - 182.3 (16.0) |
| IDH1 WILD-TYPE | 63 | 23 | 0.1 - 133.7 (11.9) |
Figure S2. Get High-res Image Gene #4: 'IDH1 MUTATION STATUS' versus Clinical Feature #1: 'Time to Death'
P value = 0.00112 (t-test), Q value = 0.13
Table S3. Gene #4: 'IDH1 MUTATION STATUS' versus Clinical Feature #2: 'AGE'
| nPatients | Mean (Std.Dev) | |
|---|---|---|
| ALL | 261 | 42.9 (13.4) |
| IDH1 MUTATED | 198 | 41.3 (12.8) |
| IDH1 WILD-TYPE | 63 | 48.0 (14.3) |
Figure S3. Get High-res Image Gene #4: 'IDH1 MUTATION STATUS' versus Clinical Feature #2: 'AGE'
P value = 2.69e-07 (t-test), Q value = 3.3e-05
Table S4. Gene #5: 'TP53 MUTATION STATUS' versus Clinical Feature #2: 'AGE'
| nPatients | Mean (Std.Dev) | |
|---|---|---|
| ALL | 261 | 42.9 (13.4) |
| TP53 MUTATED | 132 | 38.8 (12.0) |
| TP53 WILD-TYPE | 129 | 47.1 (13.5) |
Figure S4. Get High-res Image Gene #5: 'TP53 MUTATION STATUS' versus Clinical Feature #2: 'AGE'
P value = 1.47e-08 (Fisher's exact test), Q value = 1.8e-06
Table S5. Gene #5: 'TP53 MUTATION STATUS' versus Clinical Feature #5: 'HISTOLOGICAL.TYPE'
| nPatients | ASTROCYTOMA | OLIGOASTROCYTOMA | OLIGODENDROGLIOMA |
|---|---|---|---|
| ALL | 81 | 74 | 106 |
| TP53 MUTATED | 54 | 48 | 30 |
| TP53 WILD-TYPE | 27 | 26 | 76 |
Figure S5. Get High-res Image Gene #5: 'TP53 MUTATION STATUS' versus Clinical Feature #5: 'HISTOLOGICAL.TYPE'
P value = 8.19e-12 (Fisher's exact test), Q value = 1.1e-09
Table S6. Gene #7: 'CIC MUTATION STATUS' versus Clinical Feature #5: 'HISTOLOGICAL.TYPE'
| nPatients | ASTROCYTOMA | OLIGOASTROCYTOMA | OLIGODENDROGLIOMA |
|---|---|---|---|
| ALL | 81 | 74 | 106 |
| CIC MUTATED | 1 | 9 | 42 |
| CIC WILD-TYPE | 80 | 65 | 64 |
Figure S6. Get High-res Image Gene #7: 'CIC MUTATION STATUS' versus Clinical Feature #5: 'HISTOLOGICAL.TYPE'
P value = 8.75e-08 (t-test), Q value = 1.1e-05
Table S7. Gene #8: 'ATRX MUTATION STATUS' versus Clinical Feature #2: 'AGE'
| nPatients | Mean (Std.Dev) | |
|---|---|---|
| ALL | 261 | 42.9 (13.4) |
| ATRX MUTATED | 104 | 37.7 (11.7) |
| ATRX WILD-TYPE | 157 | 46.4 (13.4) |
Figure S7. Get High-res Image Gene #8: 'ATRX MUTATION STATUS' versus Clinical Feature #2: 'AGE'
P value = 6.25e-05 (Fisher's exact test), Q value = 0.0075
Table S8. Gene #8: 'ATRX MUTATION STATUS' versus Clinical Feature #5: 'HISTOLOGICAL.TYPE'
| nPatients | ASTROCYTOMA | OLIGOASTROCYTOMA | OLIGODENDROGLIOMA |
|---|---|---|---|
| ALL | 81 | 74 | 106 |
| ATRX MUTATED | 37 | 41 | 26 |
| ATRX WILD-TYPE | 44 | 33 | 80 |
Figure S8. Get High-res Image Gene #8: 'ATRX MUTATION STATUS' versus Clinical Feature #5: 'HISTOLOGICAL.TYPE'
P value = 6.62e-06 (Fisher's exact test), Q value = 8e-04
Table S9. Gene #9: 'FUBP1 MUTATION STATUS' versus Clinical Feature #5: 'HISTOLOGICAL.TYPE'
| nPatients | ASTROCYTOMA | OLIGOASTROCYTOMA | OLIGODENDROGLIOMA |
|---|---|---|---|
| ALL | 81 | 74 | 106 |
| FUBP1 MUTATED | 1 | 3 | 22 |
| FUBP1 WILD-TYPE | 80 | 71 | 84 |
Figure S9. Get High-res Image Gene #9: 'FUBP1 MUTATION STATUS' versus Clinical Feature #5: 'HISTOLOGICAL.TYPE'
P value = 2.57e-11 (logrank test), Q value = 3.3e-09
Table S10. Gene #10: 'EGFR MUTATION STATUS' versus Clinical Feature #1: 'Time to Death'
| nPatients | nDeath | Duration Range (Median), Month | |
|---|---|---|---|
| ALL | 261 | 55 | 0.0 - 182.3 (15.1) |
| EGFR MUTATED | 15 | 6 | 0.5 - 13.6 (6.5) |
| EGFR WILD-TYPE | 246 | 49 | 0.0 - 182.3 (16.0) |
Figure S10. Get High-res Image Gene #10: 'EGFR MUTATION STATUS' versus Clinical Feature #1: 'Time to Death'
P value = 1.03e-08 (t-test), Q value = 1.3e-06
Table S11. Gene #10: 'EGFR MUTATION STATUS' versus Clinical Feature #2: 'AGE'
| nPatients | Mean (Std.Dev) | |
|---|---|---|
| ALL | 261 | 42.9 (13.4) |
| EGFR MUTATED | 15 | 60.5 (7.1) |
| EGFR WILD-TYPE | 246 | 41.8 (13.0) |
Figure S11. Get High-res Image Gene #10: 'EGFR MUTATION STATUS' versus Clinical Feature #2: 'AGE'
P value = 5.75e-06 (logrank test), Q value = 7e-04
Table S12. Gene #13: 'PTEN MUTATION STATUS' versus Clinical Feature #1: 'Time to Death'
| nPatients | nDeath | Duration Range (Median), Month | |
|---|---|---|---|
| ALL | 261 | 55 | 0.0 - 182.3 (15.1) |
| PTEN MUTATED | 13 | 5 | 0.5 - 21.0 (10.4) |
| PTEN WILD-TYPE | 248 | 50 | 0.0 - 182.3 (15.5) |
Figure S12. Get High-res Image Gene #13: 'PTEN MUTATION STATUS' versus Clinical Feature #1: 'Time to Death'
P value = 0.000729 (t-test), Q value = 0.085
Table S13. Gene #13: 'PTEN MUTATION STATUS' versus Clinical Feature #2: 'AGE'
| nPatients | Mean (Std.Dev) | |
|---|---|---|
| ALL | 261 | 42.9 (13.4) |
| PTEN MUTATED | 13 | 55.3 (10.5) |
| PTEN WILD-TYPE | 248 | 42.2 (13.3) |
Figure S13. Get High-res Image Gene #13: 'PTEN MUTATION STATUS' versus Clinical Feature #2: 'AGE'
P value = 0.00038 (logrank test), Q value = 0.045
Table S14. Gene #21: 'NF1 MUTATION STATUS' versus Clinical Feature #1: 'Time to Death'
| nPatients | nDeath | Duration Range (Median), Month | |
|---|---|---|---|
| ALL | 261 | 55 | 0.0 - 182.3 (15.1) |
| NF1 MUTATED | 19 | 8 | 0.2 - 73.0 (18.0) |
| NF1 WILD-TYPE | 242 | 47 | 0.0 - 182.3 (15.1) |
Figure S14. Get High-res Image Gene #21: 'NF1 MUTATION STATUS' versus Clinical Feature #1: 'Time to Death'
-
Mutation data file = transformed.cor.cli.txt
-
Clinical data file = LGG-TP.merged_data.txt
-
Number of patients = 261
-
Number of significantly mutated genes = 22
-
Number of selected clinical features = 6
-
Exclude genes that fewer than K tumors have mutations, K = 3
For survival clinical features, the Kaplan-Meier survival curves of tumors with and without gene mutations were plotted and the statistical significance P values were estimated by logrank test (Bland and Altman 2004) using the 'survdiff' function in R
For continuous numerical clinical features, two-tailed Student's t test with unequal variance (Lehmann and Romano 2005) was applied to compare the clinical values between tumors with and without gene mutations using 't.test' function in R
For binary or multi-class clinical features (nominal or ordinal), two-tailed Fisher's exact tests (Fisher 1922) were used to estimate the P values using the 'fisher.test' function in R
For multiple hypothesis correction, Q value is the False Discovery Rate (FDR) analogue of the P value (Benjamini and Hochberg 1995), defined as the minimum FDR at which the test may be called significant. We used the 'Benjamini and Hochberg' method of 'p.adjust' function in R to convert P values into Q values.
In addition to the links below, the full results of the analysis summarized in this report can also be downloaded programmatically using firehose_get, or interactively from either the Broad GDAC website or TCGA Data Coordination Center Portal.