This pipeline uses various statistical tests to identify mRNAs whose expression levels correlated to selected clinical features.
Testing the association between 18310 genes and 6 clinical features across 277 samples, statistically thresholded by Q value < 0.05, 6 clinical features related to at least one genes.
-
683 genes correlated to 'Time to Death'.
-
SLITRK5|26050 , FNDC3B|64778 , CRTAC1|55118 , ARL3|403 , RANBP17|64901 , ...
-
290 genes correlated to 'AGE'.
-
SYT6|148281 , PRSS35|167681 , SFRP2|6423 , ABI1|10006 , CNTN3|5067 , ...
-
30 genes correlated to 'GENDER'.
-
XIST|7503 , ZFY|7544 , RPS4Y1|6192 , PRKY|5616 , DDX3Y|8653 , ...
-
1 gene correlated to 'KARNOFSKY.PERFORMANCE.SCORE'.
-
RCVRN|5957
-
2876 genes correlated to 'HISTOLOGICAL.TYPE'.
-
TXNDC12|51060 , AK2|204 , WLS|79971 , RPF1|80135 , NADK|65220 , ...
-
22 genes correlated to 'RADIATIONS.RADIATION.REGIMENINDICATION'.
-
MAMDC4|158056 , GOLGA6L9|440295 , NUDT3|11165 , RHOT2|89941 , MAN2C1|4123 , ...
Complete statistical result table is provided in Supplement Table 1
Table 1. Get Full Table This table shows the clinical features, statistical methods used, and the number of genes that are significantly associated with each clinical feature at Q value < 0.05.
| Clinical feature | Statistical test | Significant genes | Associated with | Associated with | ||
|---|---|---|---|---|---|---|
| Time to Death | Cox regression test | N=683 | shorter survival | N=345 | longer survival | N=338 |
| AGE | Spearman correlation test | N=290 | older | N=123 | younger | N=167 |
| GENDER | t test | N=30 | male | N=17 | female | N=13 |
| KARNOFSKY PERFORMANCE SCORE | Spearman correlation test | N=1 | higher score | N=0 | lower score | N=1 |
| HISTOLOGICAL TYPE | ANOVA test | N=2876 | ||||
| RADIATIONS RADIATION REGIMENINDICATION | t test | N=22 | yes | N=19 | no | N=3 |
Table S1. Basic characteristics of clinical feature: 'Time to Death'
| Time to Death | Duration (Months) | 0-211.2 (median=15.4) |
| censored | N = 217 | |
| death | N = 59 | |
| Significant markers | N = 683 | |
| associated with shorter survival | 345 | |
| associated with longer survival | 338 |
Table S2. Get Full Table List of top 10 genes significantly associated with 'Time to Death' by Cox regression test
| HazardRatio | Wald_P | Q | C_index | |
|---|---|---|---|---|
| SLITRK5|26050 | 0.47 | 6.029e-14 | 1.1e-09 | 0.269 |
| FNDC3B|64778 | 3.6 | 7.246e-13 | 1.3e-08 | 0.782 |
| CRTAC1|55118 | 0.63 | 7.39e-13 | 1.4e-08 | 0.231 |
| ARL3|403 | 0.17 | 8.55e-13 | 1.6e-08 | 0.204 |
| RANBP17|64901 | 0.63 | 9.789e-13 | 1.8e-08 | 0.297 |
| CUEDC2|79004 | 0.1 | 1.69e-12 | 3.1e-08 | 0.226 |
| ZNF217|7764 | 3.5 | 3.944e-12 | 7.2e-08 | 0.778 |
| IGFBP2|3485 | 1.54 | 5.369e-12 | 9.8e-08 | 0.79 |
| CBARA1|10367 | 0.16 | 6.389e-12 | 1.2e-07 | 0.244 |
| LOC254559|254559 | 0.56 | 7.081e-12 | 1.3e-07 | 0.212 |
Figure S1. Get High-res Image As an example, this figure shows the association of SLITRK5|26050 to 'Time to Death'. four curves present the cumulative survival rates of 4 quartile subsets of patients. P value = 6.03e-14 with univariate Cox regression analysis using continuous log-2 expression values.
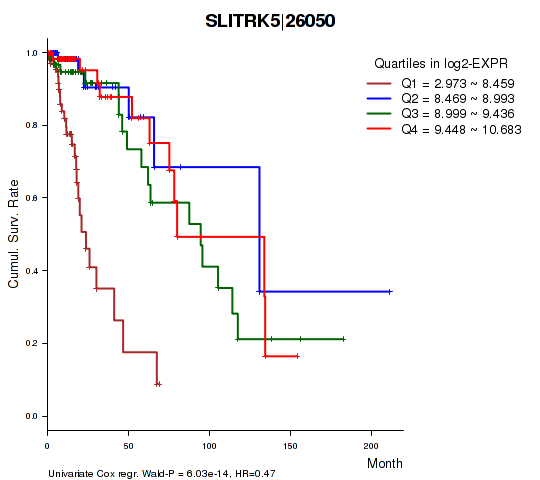
Table S3. Basic characteristics of clinical feature: 'AGE'
| AGE | Mean (SD) | 43.06 (13) |
| Significant markers | N = 290 | |
| pos. correlated | 123 | |
| neg. correlated | 167 |
Table S4. Get Full Table List of top 10 genes significantly correlated to 'AGE' by Spearman correlation test
| SpearmanCorr | corrP | Q | |
|---|---|---|---|
| SYT6|148281 | -0.4316 | 5.34e-14 | 9.78e-10 |
| PRSS35|167681 | -0.4232 | 1.841e-13 | 3.37e-09 |
| SFRP2|6423 | -0.4231 | 1.854e-13 | 3.39e-09 |
| ABI1|10006 | -0.3995 | 4.905e-12 | 8.98e-08 |
| CNTN3|5067 | -0.3927 | 1.196e-11 | 2.19e-07 |
| EN1|2019 | 0.439 | 1.371e-11 | 2.51e-07 |
| SIM2|6493 | 0.3883 | 2.115e-11 | 3.87e-07 |
| MKX|283078 | -0.3816 | 4.951e-11 | 9.06e-07 |
| CTBP2|1488 | -0.3805 | 5.638e-11 | 1.03e-06 |
| TCTA|6988 | 0.3802 | 5.9e-11 | 1.08e-06 |
Figure S2. Get High-res Image As an example, this figure shows the association of SYT6|148281 to 'AGE'. P value = 5.34e-14 with Spearman correlation analysis. The straight line presents the best linear regression.
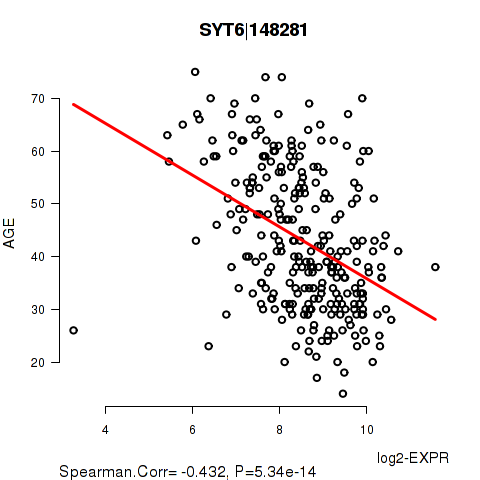
Table S5. Basic characteristics of clinical feature: 'GENDER'
| GENDER | Labels | N |
| FEMALE | 127 | |
| MALE | 150 | |
| Significant markers | N = 30 | |
| Higher in MALE | 17 | |
| Higher in FEMALE | 13 |
Table S6. Get Full Table List of top 10 genes differentially expressed by 'GENDER'
| T(pos if higher in 'MALE') | ttestP | Q | AUC | |
|---|---|---|---|---|
| XIST|7503 | -60.6 | 1.202e-157 | 2.2e-153 | 0.9999 |
| ZFY|7544 | 77.07 | 3.883e-125 | 7.11e-121 | 1 |
| RPS4Y1|6192 | 70.23 | 8.973e-110 | 1.64e-105 | 1 |
| PRKY|5616 | 38.7 | 5.18e-99 | 9.48e-95 | 0.9995 |
| DDX3Y|8653 | 80.71 | 2.394e-92 | 4.38e-88 | 1 |
| KDM5D|8284 | 79.19 | 1.261e-90 | 2.31e-86 | 1 |
| NLGN4Y|22829 | 39.05 | 9.021e-89 | 1.65e-84 | 0.9978 |
| USP9Y|8287 | 82.49 | 6.386e-85 | 1.17e-80 | 1 |
| TSIX|9383 | -27.6 | 1.265e-68 | 2.31e-64 | 0.9997 |
| EIF1AY|9086 | 87.34 | 3.022e-66 | 5.53e-62 | 1 |
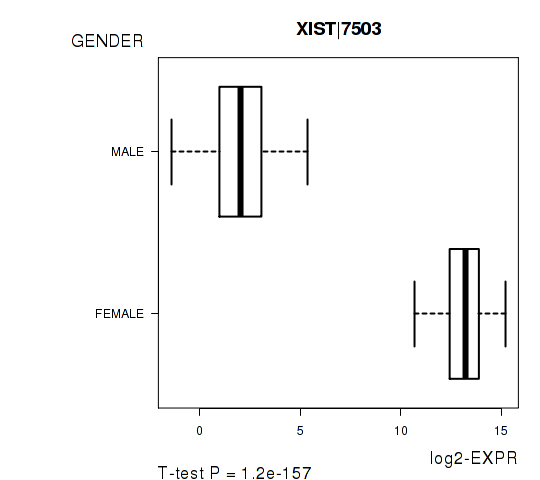
Figure S3. Get High-res Image As an example, this figure shows the association of XIST|7503 to 'GENDER'. P value = 1.2e-157 with T-test analysis.
One gene related to 'KARNOFSKY.PERFORMANCE.SCORE'.
Table S7. Basic characteristics of clinical feature: 'KARNOFSKY.PERFORMANCE.SCORE'
| KARNOFSKY.PERFORMANCE.SCORE | Mean (SD) | 87.82 (11) |
| Significant markers | N = 1 | |
| pos. correlated | 0 | |
| neg. correlated | 1 |
Table S8. Get Full Table List of one gene significantly correlated to 'KARNOFSKY.PERFORMANCE.SCORE' by Spearman correlation test
| SpearmanCorr | corrP | Q | |
|---|---|---|---|
| RCVRN|5957 | -0.4258 | 8.189e-07 | 0.015 |
Figure S4. Get High-res Image As an example, this figure shows the association of RCVRN|5957 to 'KARNOFSKY.PERFORMANCE.SCORE'. P value = 8.19e-07 with Spearman correlation analysis. The straight line presents the best linear regression.
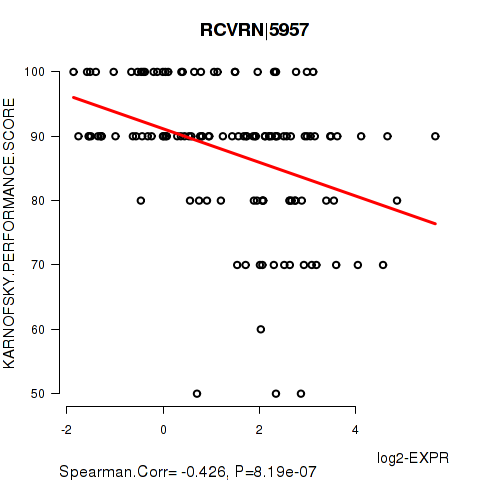
Table S9. Basic characteristics of clinical feature: 'HISTOLOGICAL.TYPE'
| HISTOLOGICAL.TYPE | Labels | N |
| ASTROCYTOMA | 88 | |
| OLIGOASTROCYTOMA | 77 | |
| OLIGODENDROGLIOMA | 112 | |
| Significant markers | N = 2876 |
Table S10. Get Full Table List of top 10 genes differentially expressed by 'HISTOLOGICAL.TYPE'
| ANOVA_P | Q | |
|---|---|---|
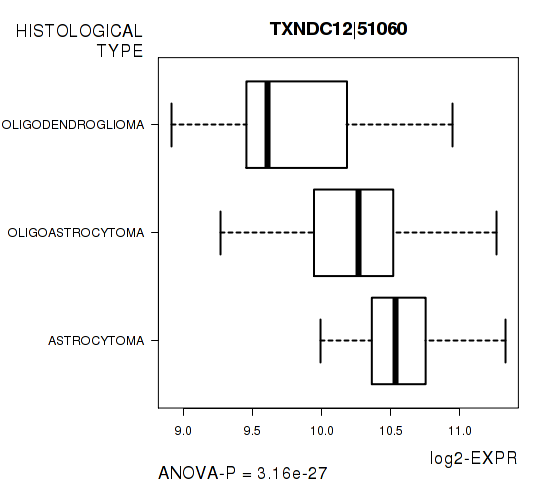
| TXNDC12|51060 | 3.158e-27 | 5.78e-23 |
| AK2|204 | 3.095e-25 | 5.67e-21 |
| WLS|79971 | 4.57e-24 | 8.37e-20 |
| RPF1|80135 | 7.576e-24 | 1.39e-19 |
| NADK|65220 | 3.155e-23 | 5.78e-19 |
| WDR77|79084 | 5.982e-23 | 1.1e-18 |
| TRAPPC3|27095 | 1.177e-22 | 2.15e-18 |
| SEP15|9403 | 1.216e-22 | 2.23e-18 |
| STK40|83931 | 1.643e-22 | 3.01e-18 |
| LRRC42|115353 | 1.686e-22 | 3.09e-18 |
Figure S5. Get High-res Image As an example, this figure shows the association of TXNDC12|51060 to 'HISTOLOGICAL.TYPE'. P value = 3.16e-27 with ANOVA analysis.
22 genes related to 'RADIATIONS.RADIATION.REGIMENINDICATION'.
Table S11. Basic characteristics of clinical feature: 'RADIATIONS.RADIATION.REGIMENINDICATION'
| RADIATIONS.RADIATION.REGIMENINDICATION | Labels | N |
| NO | 89 | |
| YES | 188 | |
| Significant markers | N = 22 | |
| Higher in YES | 19 | |
| Higher in NO | 3 |
Table S12. Get Full Table List of top 10 genes differentially expressed by 'RADIATIONS.RADIATION.REGIMENINDICATION'
| T(pos if higher in 'YES') | ttestP | Q | AUC | |
|---|---|---|---|---|
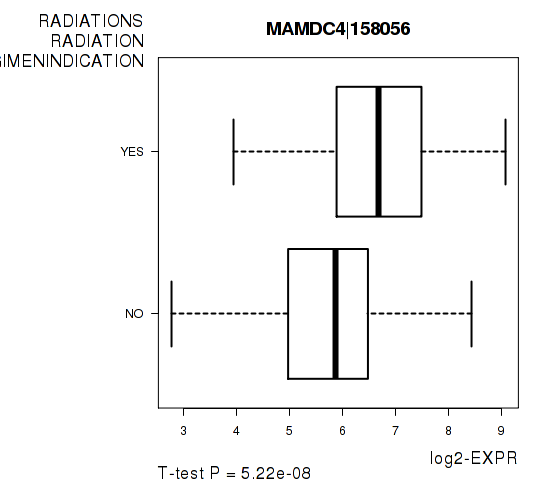
| MAMDC4|158056 | 5.72 | 5.216e-08 | 0.000955 | 0.7018 |
| GOLGA6L9|440295 | 5.69 | 5.887e-08 | 0.00108 | 0.7001 |
| NUDT3|11165 | -5.57 | 6.525e-08 | 0.00119 | 0.6831 |
| RHOT2|89941 | 5.51 | 1.091e-07 | 0.002 | 0.6892 |
| MAN2C1|4123 | 5.37 | 2.146e-07 | 0.00393 | 0.6811 |
| NSUN5P2|260294 | 5.26 | 3.438e-07 | 0.00629 | 0.6746 |
| CSAD|51380 | 5.29 | 3.571e-07 | 0.00654 | 0.6902 |
| CCDC154|645811 | 5.25 | 4.392e-07 | 0.00804 | 0.6758 |
| EIF5B|9669 | -5.23 | 4.564e-07 | 0.00835 | 0.6814 |
| CENPT|80152 | 5.03 | 1.037e-06 | 0.019 | 0.6713 |
Figure S6. Get High-res Image As an example, this figure shows the association of MAMDC4|158056 to 'RADIATIONS.RADIATION.REGIMENINDICATION'. P value = 5.22e-08 with T-test analysis.
-
Expresson data file = LGG-TP.uncv2.mRNAseq_RSEM_normalized_log2.txt
-
Clinical data file = LGG-TP.merged_data.txt
-
Number of patients = 277
-
Number of genes = 18310
-
Number of clinical features = 6
For survival clinical features, Wald's test in univariate Cox regression analysis with proportional hazards model (Andersen and Gill 1982) was used to estimate the P values using the 'coxph' function in R. Kaplan-Meier survival curves were plot using the four quartile subgroups of patients based on expression levels
For continuous numerical clinical features, Spearman's rank correlation coefficients (Spearman 1904) and two-tailed P values were estimated using 'cor.test' function in R
For two-class clinical features, two-tailed Student's t test with unequal variance (Lehmann and Romano 2005) was applied to compare the log2-expression levels between the two clinical classes using 't.test' function in R
For multi-class clinical features (ordinal or nominal), one-way analysis of variance (Howell 2002) was applied to compare the log2-expression levels between different clinical classes using 'anova' function in R
For multiple hypothesis correction, Q value is the False Discovery Rate (FDR) analogue of the P value (Benjamini and Hochberg 1995), defined as the minimum FDR at which the test may be called significant. We used the 'Benjamini and Hochberg' method of 'p.adjust' function in R to convert P values into Q values.
In addition to the links below, the full results of the analysis summarized in this report can also be downloaded programmatically using firehose_get, or interactively from either the Broad GDAC website or TCGA Data Coordination Center Portal.