This pipeline uses various statistical tests to identify miRs whose expression levels correlated to selected clinical features.
Testing the association between 542 miRs and 6 clinical features across 275 samples, statistically thresholded by Q value < 0.05, 4 clinical features related to at least one miRs.
-
12 miRs correlated to 'Time to Death'.
-
HSA-MIR-346 , HSA-MIR-155 , HSA-MIR-10A , HSA-MIR-15B , HSA-MIR-9-1 , ...
-
14 miRs correlated to 'AGE'.
-
HSA-MIR-34A , HSA-MIR-10B , HSA-MIR-25 , HSA-MIR-10A , HSA-MIR-2115 , ...
-
34 miRs correlated to 'HISTOLOGICAL.TYPE'.
-
HSA-MIR-1262 , HSA-MIR-3074 , HSA-MIR-186 , HSA-MIR-21 , HSA-MIR-219-1 , ...
-
7 miRs correlated to 'RADIATIONS.RADIATION.REGIMENINDICATION'.
-
HSA-MIR-628 , HSA-MIR-424 , HSA-MIR-296 , HSA-MIR-3613 , HSA-MIR-30C-1 , ...
-
No miRs correlated to 'GENDER', and 'KARNOFSKY.PERFORMANCE.SCORE'.
Complete statistical result table is provided in Supplement Table 1
Table 1. Get Full Table This table shows the clinical features, statistical methods used, and the number of miRs that are significantly associated with each clinical feature at Q value < 0.05.
| Clinical feature | Statistical test | Significant miRs | Associated with | Associated with | ||
|---|---|---|---|---|---|---|
| Time to Death | Cox regression test | N=12 | shorter survival | N=9 | longer survival | N=3 |
| AGE | Spearman correlation test | N=14 | older | N=12 | younger | N=2 |
| GENDER | t test | N=0 | ||||
| KARNOFSKY PERFORMANCE SCORE | Spearman correlation test | N=0 | ||||
| HISTOLOGICAL TYPE | ANOVA test | N=34 | ||||
| RADIATIONS RADIATION REGIMENINDICATION | t test | N=7 | yes | N=0 | no | N=7 |
Table S1. Basic characteristics of clinical feature: 'Time to Death'
| Time to Death | Duration (Months) | 0-211.2 (median=15.2) |
| censored | N = 216 | |
| death | N = 58 | |
| Significant markers | N = 12 | |
| associated with shorter survival | 9 | |
| associated with longer survival | 3 |
Table S2. Get Full Table List of top 10 miRs significantly associated with 'Time to Death' by Cox regression test
| HazardRatio | Wald_P | Q | C_index | |
|---|---|---|---|---|
| HSA-MIR-346 | 0.49 | 3.266e-11 | 1.8e-08 | 0.281 |
| HSA-MIR-155 | 1.91 | 1.068e-09 | 5.8e-07 | 0.763 |
| HSA-MIR-10A | 1.4 | 5.965e-09 | 3.2e-06 | 0.728 |
| HSA-MIR-15B | 1.79 | 1.711e-07 | 9.2e-05 | 0.789 |
| HSA-MIR-9-1 | 0.45 | 7.888e-06 | 0.0042 | 0.262 |
| HSA-MIR-9-2 | 0.45 | 7.999e-06 | 0.0043 | 0.261 |
| HSA-MIR-196B | 1.19 | 1.105e-05 | 0.0059 | 0.692 |
| HSA-MIR-148A | 1.49 | 2.25e-05 | 0.012 | 0.712 |
| HSA-MIR-335 | 1.74 | 2.482e-05 | 0.013 | 0.761 |
| HSA-MIR-3677 | 1.46 | 3.008e-05 | 0.016 | 0.724 |
Figure S1. Get High-res Image As an example, this figure shows the association of HSA-MIR-346 to 'Time to Death'. four curves present the cumulative survival rates of 4 quartile subsets of patients. P value = 3.27e-11 with univariate Cox regression analysis using continuous log-2 expression values.
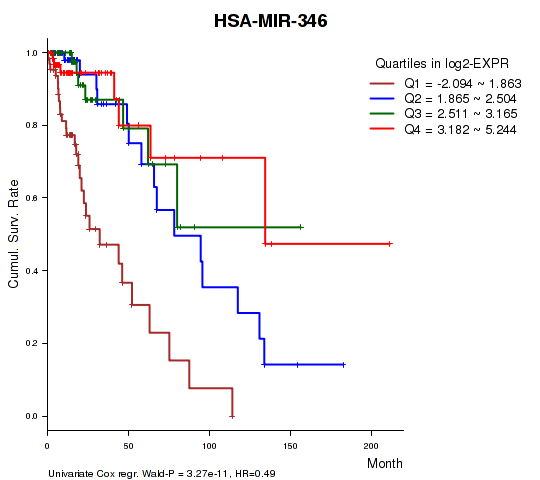
Table S3. Basic characteristics of clinical feature: 'AGE'
| AGE | Mean (SD) | 43.18 (13) |
| Significant markers | N = 14 | |
| pos. correlated | 12 | |
| neg. correlated | 2 |
Table S4. Get Full Table List of top 10 miRs significantly correlated to 'AGE' by Spearman correlation test
| SpearmanCorr | corrP | Q | |
|---|---|---|---|
| HSA-MIR-34A | 0.3124 | 1.22e-07 | 6.61e-05 |
| HSA-MIR-10B | 0.2925 | 7.965e-07 | 0.000431 |
| HSA-MIR-25 | 0.285 | 1.55e-06 | 0.000837 |
| HSA-MIR-10A | 0.2779 | 2.874e-06 | 0.00155 |
| HSA-MIR-2115 | 0.2875 | 3.825e-06 | 0.00206 |
| HSA-MIR-155 | 0.2631 | 9.85e-06 | 0.00529 |
| HSA-MIR-3934 | 0.3845 | 2.851e-05 | 0.0153 |
| HSA-MIR-146A | 0.2494 | 2.87e-05 | 0.0154 |
| HSA-MIR-664 | 0.2365 | 7.507e-05 | 0.0401 |
| HSA-MIR-301A | -0.2354 | 8.117e-05 | 0.0433 |
Figure S2. Get High-res Image As an example, this figure shows the association of HSA-MIR-34A to 'AGE'. P value = 1.22e-07 with Spearman correlation analysis. The straight line presents the best linear regression.
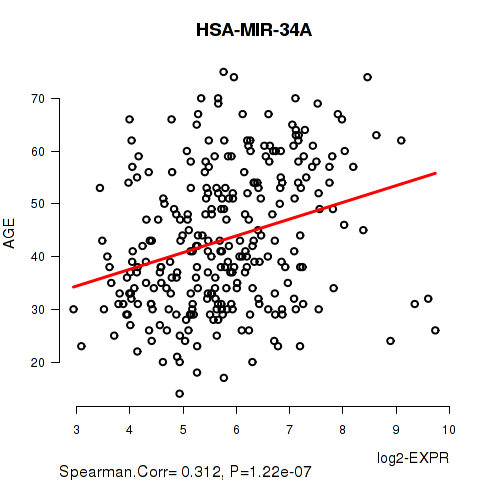
Table S5. Basic characteristics of clinical feature: 'GENDER'
| GENDER | Labels | N |
| FEMALE | 127 | |
| MALE | 148 | |
| Significant markers | N = 0 |
No miR related to 'KARNOFSKY.PERFORMANCE.SCORE'.
Table S6. Basic characteristics of clinical feature: 'KARNOFSKY.PERFORMANCE.SCORE'
| KARNOFSKY.PERFORMANCE.SCORE | Mean (SD) | 87.63 (11) |
| Significant markers | N = 0 |
Table S7. Basic characteristics of clinical feature: 'HISTOLOGICAL.TYPE'
| HISTOLOGICAL.TYPE | Labels | N |
| ASTROCYTOMA | 86 | |
| OLIGOASTROCYTOMA | 76 | |
| OLIGODENDROGLIOMA | 113 | |
| Significant markers | N = 34 |
Table S8. Get Full Table List of top 10 miRs differentially expressed by 'HISTOLOGICAL.TYPE'
| ANOVA_P | Q | |
|---|---|---|
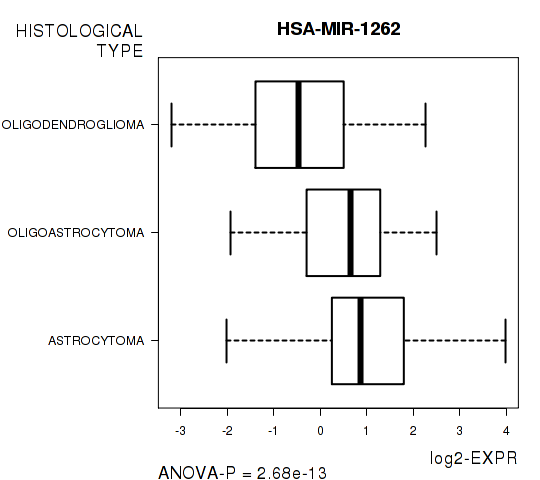
| HSA-MIR-1262 | 2.676e-13 | 1.45e-10 |
| HSA-MIR-3074 | 2.199e-09 | 1.19e-06 |
| HSA-MIR-186 | 3.724e-08 | 2.01e-05 |
| HSA-MIR-21 | 5.132e-08 | 2.77e-05 |
| HSA-MIR-219-1 | 6.522e-08 | 3.51e-05 |
| HSA-MIR-592 | 1.09e-07 | 5.85e-05 |
| HSA-MIR-3065 | 1.705e-07 | 9.14e-05 |
| HSA-MIR-455 | 7.285e-07 | 0.00039 |
| HSA-MIR-576 | 9.585e-07 | 0.000512 |
| HSA-MIR-23A | 9.626e-07 | 0.000513 |
Figure S3. Get High-res Image As an example, this figure shows the association of HSA-MIR-1262 to 'HISTOLOGICAL.TYPE'. P value = 2.68e-13 with ANOVA analysis.
7 miRs related to 'RADIATIONS.RADIATION.REGIMENINDICATION'.
Table S9. Basic characteristics of clinical feature: 'RADIATIONS.RADIATION.REGIMENINDICATION'
| RADIATIONS.RADIATION.REGIMENINDICATION | Labels | N |
| NO | 88 | |
| YES | 187 | |
| Significant markers | N = 7 | |
| Higher in YES | 0 | |
| Higher in NO | 7 |
Table S10. Get Full Table List of 7 miRs differentially expressed by 'RADIATIONS.RADIATION.REGIMENINDICATION'
| T(pos if higher in 'YES') | ttestP | Q | AUC | |
|---|---|---|---|---|
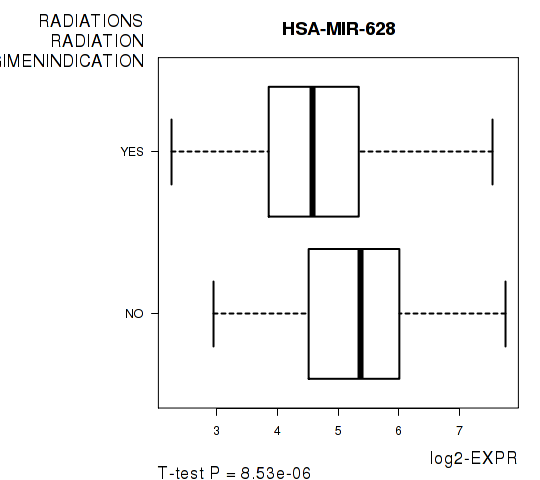
| HSA-MIR-628 | -4.57 | 8.528e-06 | 0.00462 | 0.6712 |
| HSA-MIR-424 | -4.61 | 8.572e-06 | 0.00464 | 0.6784 |
| HSA-MIR-296 | -4.54 | 9.304e-06 | 0.00502 | 0.6438 |
| HSA-MIR-3613 | -4.52 | 1.109e-05 | 0.00598 | 0.6474 |
| HSA-MIR-30C-1 | -4.23 | 3.307e-05 | 0.0178 | 0.6305 |
| HSA-MIR-3130-1 | -4.19 | 4.547e-05 | 0.0244 | 0.6564 |
| HSA-MIR-32 | -4.05 | 7.76e-05 | 0.0416 | 0.6367 |
Figure S4. Get High-res Image As an example, this figure shows the association of HSA-MIR-628 to 'RADIATIONS.RADIATION.REGIMENINDICATION'. P value = 8.53e-06 with T-test analysis.
-
Expresson data file = LGG-TP.miRseq_RPKM_log2.txt
-
Clinical data file = LGG-TP.merged_data.txt
-
Number of patients = 275
-
Number of miRs = 542
-
Number of clinical features = 6
For survival clinical features, Wald's test in univariate Cox regression analysis with proportional hazards model (Andersen and Gill 1982) was used to estimate the P values using the 'coxph' function in R. Kaplan-Meier survival curves were plot using the four quartile subgroups of patients based on expression levels
For continuous numerical clinical features, Spearman's rank correlation coefficients (Spearman 1904) and two-tailed P values were estimated using 'cor.test' function in R
For two-class clinical features, two-tailed Student's t test with unequal variance (Lehmann and Romano 2005) was applied to compare the log2-expression levels between the two clinical classes using 't.test' function in R
For multi-class clinical features (ordinal or nominal), one-way analysis of variance (Howell 2002) was applied to compare the log2-expression levels between different clinical classes using 'anova' function in R
For multiple hypothesis correction, Q value is the False Discovery Rate (FDR) analogue of the P value (Benjamini and Hochberg 1995), defined as the minimum FDR at which the test may be called significant. We used the 'Benjamini and Hochberg' method of 'p.adjust' function in R to convert P values into Q values.
In addition to the links below, the full results of the analysis summarized in this report can also be downloaded programmatically using firehose_get, or interactively from either the Broad GDAC website or TCGA Data Coordination Center Portal.