This pipeline uses various statistical tests to identify mRNAs whose expression levels correlated to selected clinical features.
Testing the association between 17802 genes and 8 clinical features across 124 samples, statistically thresholded by Q value < 0.05, 6 clinical features related to at least one genes.
-
5 genes correlated to 'NEOPLASM.DISEASESTAGE'.
-
KCNT1|57582 , THNSL2|55258 , DPYS|1807 , LOC399815|399815 , DPH1|1801
-
4 genes correlated to 'PATHOLOGY.T.STAGE'.
-
TFAP2A|7020 , POLA2|23649 , RNF123|63891 , CARKD|55739
-
33 genes correlated to 'PATHOLOGY.N.STAGE'.
-
PI4KAP2|375133 , AGPAT2|10555 , PRSS35|167681 , ATP5F1|515 , WARS2|10352 , ...
-
1 gene correlated to 'PATHOLOGY.M.STAGE'.
-
KCNT1|57582
-
34 genes correlated to 'GENDER'.
-
XIST|7503 , RPS4Y1|6192 , ZFY|7544 , TSIX|9383 , PRKY|5616 , ...
-
1 gene correlated to 'COMPLETENESS.OF.RESECTION'.
-
PGA5|5222
-
No genes correlated to 'Time to Death', and 'AGE'.
Complete statistical result table is provided in Supplement Table 1
Table 1. Get Full Table This table shows the clinical features, statistical methods used, and the number of genes that are significantly associated with each clinical feature at Q value < 0.05.
| Clinical feature | Statistical test | Significant genes | Associated with | Associated with | ||
|---|---|---|---|---|---|---|
| Time to Death | Cox regression test | N=0 | ||||
| AGE | Spearman correlation test | N=0 | ||||
| NEOPLASM DISEASESTAGE | ANOVA test | N=5 | ||||
| PATHOLOGY T STAGE | Spearman correlation test | N=4 | higher stage | N=2 | lower stage | N=2 |
| PATHOLOGY N STAGE | t test | N=33 | class1 | N=24 | class0 | N=9 |
| PATHOLOGY M STAGE | ANOVA test | N=1 | ||||
| GENDER | t test | N=34 | male | N=14 | female | N=20 |
| COMPLETENESS OF RESECTION | ANOVA test | N=1 |
Table S1. Basic characteristics of clinical feature: 'Time to Death'
| Time to Death | Duration (Months) | 0-113 (median=14.3) |
| censored | N = 67 | |
| death | N = 53 | |
| Significant markers | N = 0 |
Table S2. Basic characteristics of clinical feature: 'AGE'
| AGE | Mean (SD) | 61.55 (14) |
| Significant markers | N = 0 |
Table S3. Basic characteristics of clinical feature: 'NEOPLASM.DISEASESTAGE'
| NEOPLASM.DISEASESTAGE | Labels | N |
| STAGE I | 47 | |
| STAGE II | 27 | |
| STAGE III | 2 | |
| STAGE IIIA | 29 | |
| STAGE IIIB | 2 | |
| STAGE IIIC | 5 | |
| STAGE IV | 1 | |
| STAGE IVA | 1 | |
| STAGE IVB | 1 | |
| Significant markers | N = 5 |
Table S4. Get Full Table List of 5 genes differentially expressed by 'NEOPLASM.DISEASESTAGE'
| ANOVA_P | Q | |
|---|---|---|
| KCNT1|57582 | 1.733e-08 | 0.000309 |
| THNSL2|55258 | 3.705e-07 | 0.0066 |
| DPYS|1807 | 1.313e-06 | 0.0234 |
| LOC399815|399815 | 1.745e-06 | 0.0311 |
| DPH1|1801 | 2.536e-06 | 0.0451 |
Figure S1. Get High-res Image As an example, this figure shows the association of KCNT1|57582 to 'NEOPLASM.DISEASESTAGE'. P value = 1.73e-08 with ANOVA analysis.
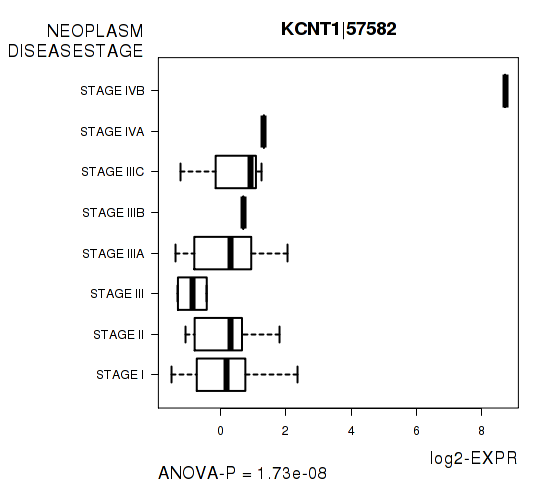
Table S5. Basic characteristics of clinical feature: 'PATHOLOGY.T.STAGE'
| PATHOLOGY.T.STAGE | Mean (SD) | 2.01 (0.97) |
| N | ||
| 1 | 50 | |
| 2 | 30 | |
| 3 | 37 | |
| 4 | 7 | |
| Significant markers | N = 4 | |
| pos. correlated | 2 | |
| neg. correlated | 2 |
Table S6. Get Full Table List of 4 genes significantly correlated to 'PATHOLOGY.T.STAGE' by Spearman correlation test
| SpearmanCorr | corrP | Q | |
|---|---|---|---|
| TFAP2A|7020 | 0.4348 | 6.958e-07 | 0.0124 |
| POLA2|23649 | 0.4224 | 1.027e-06 | 0.0183 |
| RNF123|63891 | -0.4177 | 1.385e-06 | 0.0246 |
| CARKD|55739 | -0.4107 | 2.159e-06 | 0.0384 |
Figure S2. Get High-res Image As an example, this figure shows the association of TFAP2A|7020 to 'PATHOLOGY.T.STAGE'. P value = 6.96e-07 with Spearman correlation analysis.
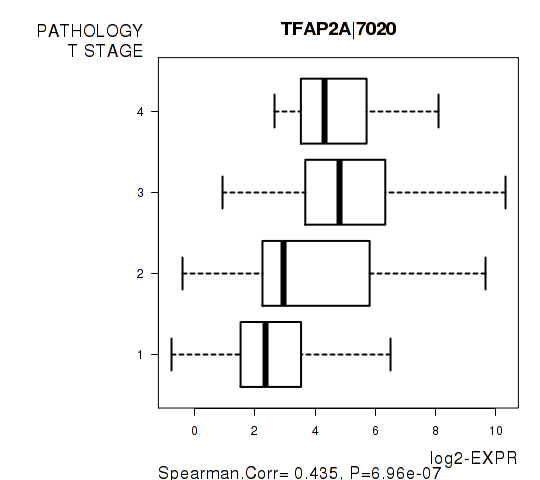
Table S7. Basic characteristics of clinical feature: 'PATHOLOGY.N.STAGE'
| PATHOLOGY.N.STAGE | Labels | N |
| class0 | 80 | |
| class1 | 3 | |
| Significant markers | N = 33 | |
| Higher in class1 | 24 | |
| Higher in class0 | 9 |
Table S8. Get Full Table List of top 10 genes differentially expressed by 'PATHOLOGY.N.STAGE'
| T(pos if higher in 'class1') | ttestP | Q | AUC | |
|---|---|---|---|---|
| PI4KAP2|375133 | 9.36 | 1.24e-10 | 1.98e-06 | 0.9083 |
| AGPAT2|10555 | 7.38 | 1.244e-10 | 1.98e-06 | 0.8125 |
| PRSS35|167681 | -8.06 | 2.395e-10 | 3.81e-06 | 0.859 |
| ATP5F1|515 | 7.22 | 4.032e-10 | 6.42e-06 | 0.8042 |
| WARS2|10352 | 9.2 | 5.19e-10 | 8.26e-06 | 0.9083 |
| STAB2|55576 | -7.24 | 1.877e-09 | 2.99e-05 | 0.801 |
| ARMCX3|51566 | 7.33 | 4.673e-09 | 7.44e-05 | 0.7917 |
| SFRS6|6431 | 7.02 | 1.063e-08 | 0.000169 | 0.7917 |
| WNT5A|7474 | 6.89 | 1.355e-08 | 0.000216 | 0.7958 |
| LRRC1|55227 | 6.67 | 1.8e-08 | 0.000286 | 0.8042 |
Figure S3. Get High-res Image As an example, this figure shows the association of PI4KAP2|375133 to 'PATHOLOGY.N.STAGE'. P value = 1.24e-10 with T-test analysis.
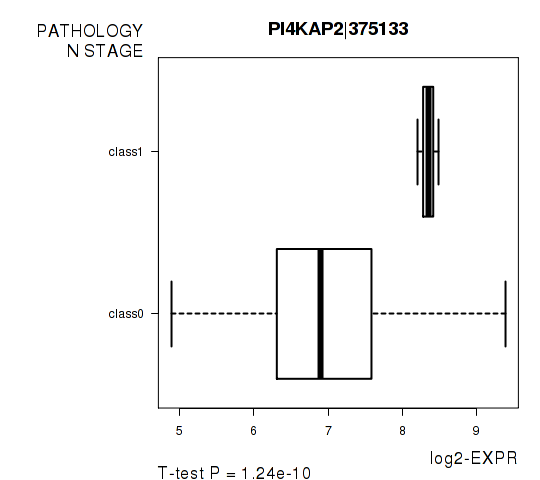
Table S9. Basic characteristics of clinical feature: 'PATHOLOGY.M.STAGE'
| PATHOLOGY.M.STAGE | Labels | N |
| M0 | 97 | |
| M1 | 2 | |
| MX | 25 | |
| Significant markers | N = 1 |
Table S10. Get Full Table List of one gene differentially expressed by 'PATHOLOGY.M.STAGE'
| ANOVA_P | Q | |
|---|---|---|
| KCNT1|57582 | 8.041e-11 | 1.43e-06 |
Figure S4. Get High-res Image As an example, this figure shows the association of KCNT1|57582 to 'PATHOLOGY.M.STAGE'. P value = 8.04e-11 with ANOVA analysis.
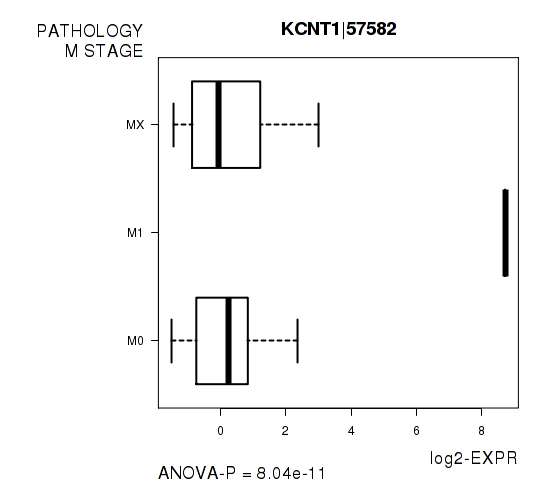
Table S11. Basic characteristics of clinical feature: 'GENDER'
| GENDER | Labels | N |
| FEMALE | 47 | |
| MALE | 77 | |
| Significant markers | N = 34 | |
| Higher in MALE | 14 | |
| Higher in FEMALE | 20 |
Table S12. Get Full Table List of top 10 genes differentially expressed by 'GENDER'
| T(pos if higher in 'MALE') | ttestP | Q | AUC | |
|---|---|---|---|---|
| XIST|7503 | -14.01 | 2.482e-24 | 4.42e-20 | 0.9648 |
| RPS4Y1|6192 | 22.85 | 2.775e-21 | 4.94e-17 | 0.9966 |
| ZFY|7544 | 21.32 | 2.136e-19 | 3.8e-15 | 0.9952 |
| TSIX|9383 | -12.66 | 1.208e-17 | 2.15e-13 | 0.9695 |
| PRKY|5616 | 17.14 | 2.323e-17 | 4.13e-13 | 0.9938 |
| DDX3Y|8653 | 20.66 | 1.586e-15 | 2.82e-11 | 0.9986 |
| NLGN4Y|22829 | 15.1 | 2.677e-15 | 4.76e-11 | 0.9877 |
| KDM5D|8284 | 18.91 | 2.825e-14 | 5.03e-10 | 0.9968 |
| KDM5C|8242 | -7.39 | 3.731e-11 | 6.64e-07 | 0.832 |
| BMP8B|656 | -6.34 | 7.79e-09 | 0.000139 | 0.7983 |
Figure S5. Get High-res Image As an example, this figure shows the association of XIST|7503 to 'GENDER'. P value = 2.48e-24 with T-test analysis.
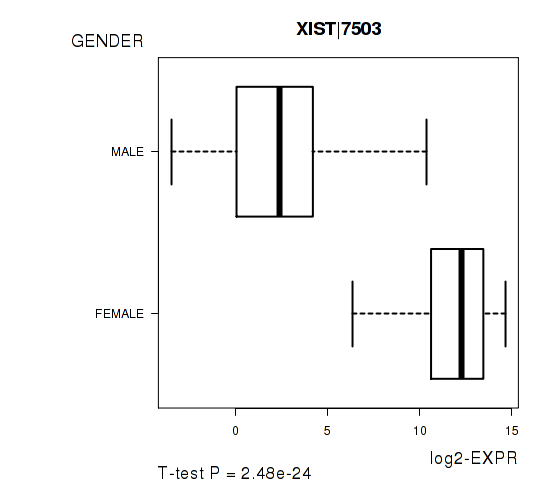
Table S13. Basic characteristics of clinical feature: 'COMPLETENESS.OF.RESECTION'
| COMPLETENESS.OF.RESECTION | Labels | N |
| R0 | 100 | |
| R1 | 10 | |
| R2 | 1 | |
| RX | 8 | |
| Significant markers | N = 1 |
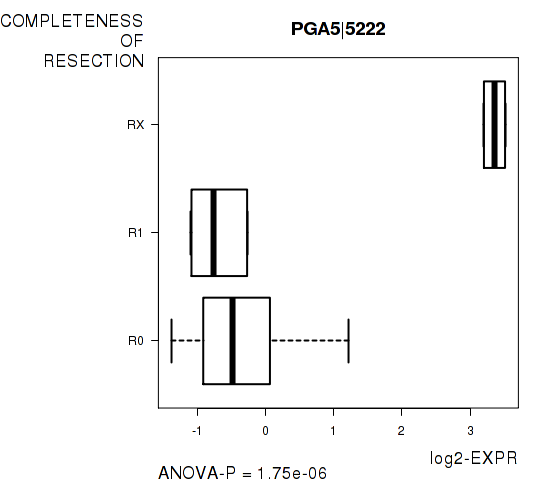
Table S14. Get Full Table List of one gene differentially expressed by 'COMPLETENESS.OF.RESECTION'
| ANOVA_P | Q | |
|---|---|---|
| PGA5|5222 | 1.751e-06 | 0.0312 |
Figure S6. Get High-res Image As an example, this figure shows the association of PGA5|5222 to 'COMPLETENESS.OF.RESECTION'. P value = 1.75e-06 with ANOVA analysis.
-
Expresson data file = LIHC-TP.uncv2.mRNAseq_RSEM_normalized_log2.txt
-
Clinical data file = LIHC-TP.merged_data.txt
-
Number of patients = 124
-
Number of genes = 17802
-
Number of clinical features = 8
For survival clinical features, Wald's test in univariate Cox regression analysis with proportional hazards model (Andersen and Gill 1982) was used to estimate the P values using the 'coxph' function in R. Kaplan-Meier survival curves were plot using the four quartile subgroups of patients based on expression levels
For continuous numerical clinical features, Spearman's rank correlation coefficients (Spearman 1904) and two-tailed P values were estimated using 'cor.test' function in R
For multi-class clinical features (ordinal or nominal), one-way analysis of variance (Howell 2002) was applied to compare the log2-expression levels between different clinical classes using 'anova' function in R
For two-class clinical features, two-tailed Student's t test with unequal variance (Lehmann and Romano 2005) was applied to compare the log2-expression levels between the two clinical classes using 't.test' function in R
For multiple hypothesis correction, Q value is the False Discovery Rate (FDR) analogue of the P value (Benjamini and Hochberg 1995), defined as the minimum FDR at which the test may be called significant. We used the 'Benjamini and Hochberg' method of 'p.adjust' function in R to convert P values into Q values.
In addition to the links below, the full results of the analysis summarized in this report can also be downloaded programmatically using firehose_get, or interactively from either the Broad GDAC website or TCGA Data Coordination Center Portal.