This pipeline computes the correlation between significant arm-level copy number variations (cnvs) and selected clinical features.
Testing the association between copy number variation 80 arm-level events and 6 clinical features across 562 patients, 15 significant findings detected with Q value < 0.25.
-
1q gain cnv correlated to 'AGE'.
-
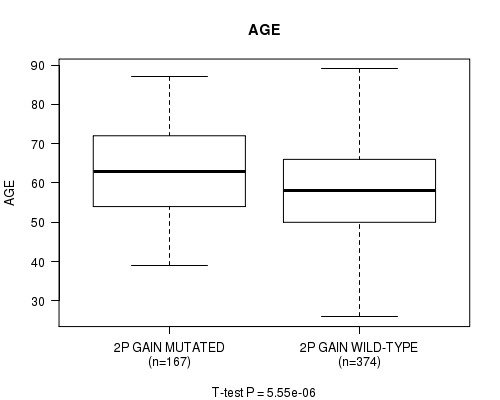
2p gain cnv correlated to 'AGE'.
-
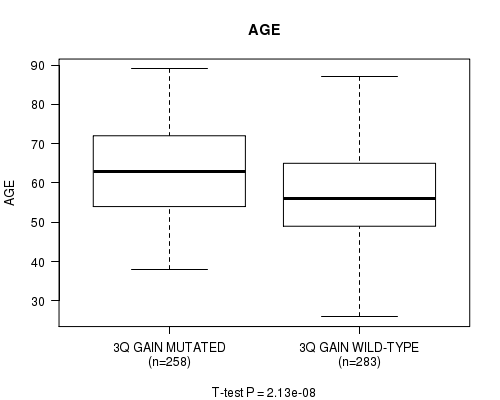
3q gain cnv correlated to 'AGE'.
-
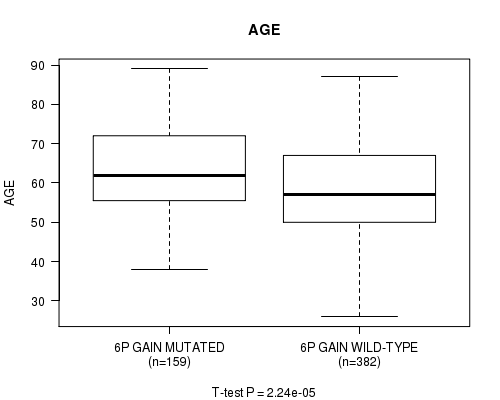
6p gain cnv correlated to 'AGE'.
-
6q gain cnv correlated to 'AGE'.
-
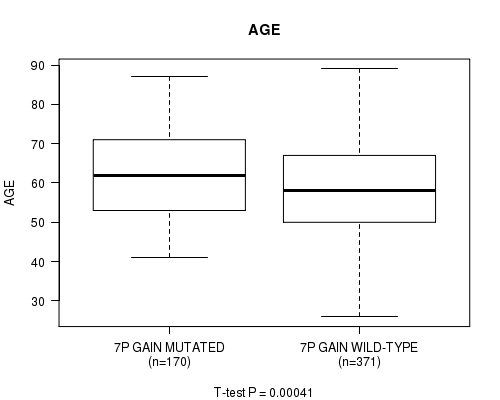
7p gain cnv correlated to 'AGE'.
-
10p gain cnv correlated to 'AGE'.
-
12p gain cnv correlated to 'AGE'.
-
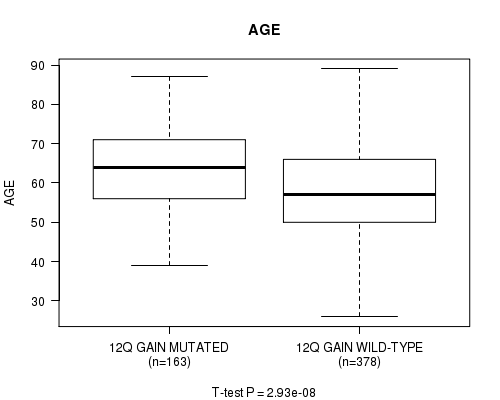
12q gain cnv correlated to 'AGE'.
-
20p gain cnv correlated to 'AGE'.
-
20q gain cnv correlated to 'AGE'.
-
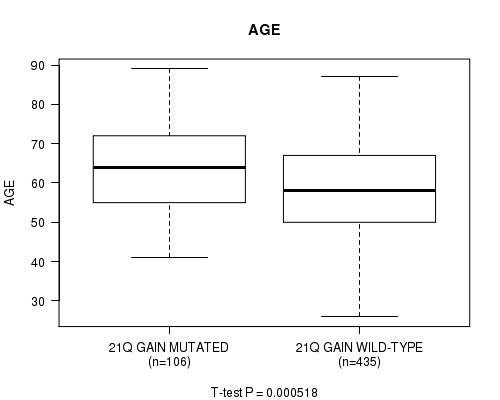
21q gain cnv correlated to 'AGE'.
-
9q loss cnv correlated to 'AGE'.
-
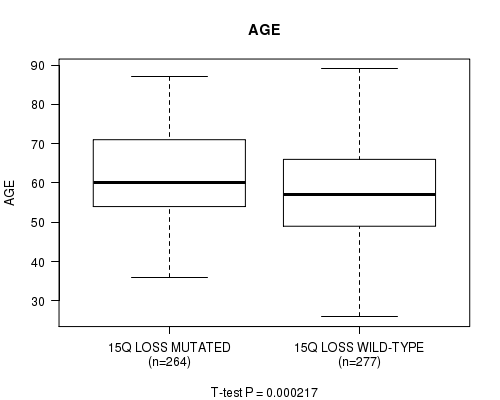
15q loss cnv correlated to 'AGE'.
-
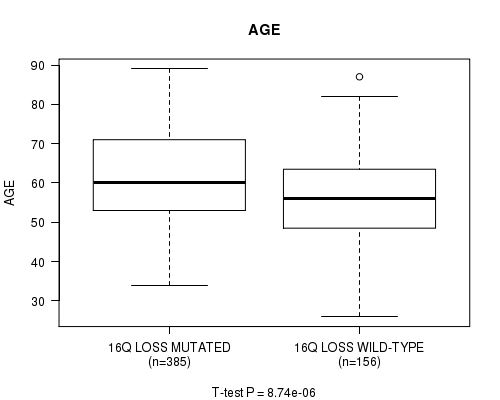
16q loss cnv correlated to 'AGE'.
Table 1. Get Full Table Overview of the association between significant copy number variation of 80 arm-level events and 6 clinical features. Shown in the table are P values (Q values). Thresholded by Q value < 0.25, 15 significant findings detected.
|
Clinical Features |
Time to Death |
AGE |
PRIMARY SITE OF DISEASE |
KARNOFSKY PERFORMANCE SCORE |
RADIATIONS RADIATION REGIMENINDICATION |
COMPLETENESS OF RESECTION |
||
| nCNV (%) | nWild-Type | logrank test | t-test | Fisher's exact test | t-test | Fisher's exact test | Fisher's exact test | |
| 1q gain | 216 (38%) | 346 |
0.731 (1.00) |
0.000434 (0.199) |
0.266 (1.00) |
0.0241 (1.00) |
1 (1.00) |
1 (1.00) |
| 2p gain | 176 (31%) | 386 |
0.1 (1.00) |
5.55e-06 (0.00258) |
1 (1.00) |
0.695 (1.00) |
1 (1.00) |
0.837 (1.00) |
| 3q gain | 265 (47%) | 297 |
0.554 (1.00) |
2.13e-08 (1e-05) |
0.175 (1.00) |
0.564 (1.00) |
0.251 (1.00) |
0.759 (1.00) |
| 6p gain | 163 (29%) | 399 |
0.3 (1.00) |
2.24e-05 (0.0103) |
0.747 (1.00) |
0.0837 (1.00) |
0.56 (1.00) |
1 (1.00) |
| 6q gain | 96 (17%) | 466 |
0.434 (1.00) |
0.000175 (0.0808) |
1 (1.00) |
0.184 (1.00) |
1 (1.00) |
0.741 (1.00) |
| 7p gain | 178 (32%) | 384 |
0.857 (1.00) |
0.00041 (0.188) |
0.378 (1.00) |
0.0632 (1.00) |
0.555 (1.00) |
1 (1.00) |
| 10p gain | 181 (32%) | 381 |
0.363 (1.00) |
3.85e-08 (1.8e-05) |
0.102 (1.00) |
0.323 (1.00) |
0.244 (1.00) |
0.664 (1.00) |
| 12p gain | 249 (44%) | 313 |
0.295 (1.00) |
2.81e-10 (1.33e-07) |
0.347 (1.00) |
0.0292 (1.00) |
1 (1.00) |
0.574 (1.00) |
| 12q gain | 173 (31%) | 389 |
0.155 (1.00) |
2.93e-08 (1.37e-05) |
0.0849 (1.00) |
0.00638 (1.00) |
1 (1.00) |
0.664 (1.00) |
| 20p gain | 280 (50%) | 282 |
0.0181 (1.00) |
1.05e-06 (0.000488) |
0.749 (1.00) |
0.0983 (1.00) |
0.623 (1.00) |
0.869 (1.00) |
| 20q gain | 317 (56%) | 245 |
0.053 (1.00) |
1.21e-05 (0.00559) |
0.758 (1.00) |
0.215 (1.00) |
1 (1.00) |
1 (1.00) |
| 21q gain | 109 (19%) | 453 |
1 (1.00) |
0.000518 (0.237) |
0.0719 (1.00) |
0.323 (1.00) |
1 (1.00) |
0.576 (1.00) |
| 9q loss | 280 (50%) | 282 |
0.364 (1.00) |
4.57e-07 (0.000213) |
0.494 (1.00) |
0.985 (1.00) |
0.623 (1.00) |
0.867 (1.00) |
| 15q loss | 272 (48%) | 290 |
0.365 (1.00) |
0.000217 (0.0997) |
0.483 (1.00) |
0.985 (1.00) |
0.613 (1.00) |
0.751 (1.00) |
| 16q loss | 400 (71%) | 162 |
0.13 (1.00) |
8.74e-06 (0.00406) |
0.749 (1.00) |
0.152 (1.00) |
0.561 (1.00) |
0.662 (1.00) |
| 1p gain | 166 (30%) | 396 |
0.317 (1.00) |
0.0462 (1.00) |
0.337 (1.00) |
0.0649 (1.00) |
0.21 (1.00) |
0.299 (1.00) |
| 2q gain | 148 (26%) | 414 |
0.115 (1.00) |
0.000894 (0.407) |
1 (1.00) |
0.991 (1.00) |
0.171 (1.00) |
1 (1.00) |
| 3p gain | 154 (27%) | 408 |
0.568 (1.00) |
0.000717 (0.327) |
0.723 (1.00) |
0.636 (1.00) |
0.565 (1.00) |
0.217 (1.00) |
| 4p gain | 57 (10%) | 505 |
0.053 (1.00) |
0.0243 (1.00) |
0.349 (1.00) |
0.417 (1.00) |
0.275 (1.00) |
0.411 (1.00) |
| 4q gain | 32 (6%) | 530 |
0.241 (1.00) |
0.0435 (1.00) |
1 (1.00) |
0.497 (1.00) |
0.162 (1.00) |
|
| 5p gain | 193 (34%) | 369 |
0.364 (1.00) |
0.00211 (0.956) |
0.115 (1.00) |
0.429 (1.00) |
1 (1.00) |
0.0524 (1.00) |
| 5q gain | 59 (10%) | 503 |
0.91 (1.00) |
0.171 (1.00) |
0.354 (1.00) |
0.554 (1.00) |
1 (1.00) |
0.121 (1.00) |
| 7q gain | 193 (34%) | 369 |
0.521 (1.00) |
0.00223 (1.00) |
0.797 (1.00) |
0.0736 (1.00) |
0.555 (1.00) |
0.574 (1.00) |
| 8p gain | 116 (21%) | 446 |
0.888 (1.00) |
0.974 (1.00) |
0.608 (1.00) |
0.733 (1.00) |
0.501 (1.00) |
0.664 (1.00) |
| 8q gain | 236 (42%) | 326 |
0.423 (1.00) |
0.112 (1.00) |
0.327 (1.00) |
0.779 (1.00) |
1 (1.00) |
0.0733 (1.00) |
| 9p gain | 88 (16%) | 474 |
0.464 (1.00) |
0.825 (1.00) |
1 (1.00) |
0.25 (1.00) |
0.401 (1.00) |
1 (1.00) |
| 9q gain | 43 (8%) | 519 |
0.64 (1.00) |
0.154 (1.00) |
1 (1.00) |
0.00339 (1.00) |
0.213 (1.00) |
1 (1.00) |
| 10q gain | 105 (19%) | 457 |
0.683 (1.00) |
0.00238 (1.00) |
0.163 (1.00) |
0.809 (1.00) |
1 (1.00) |
1 (1.00) |
| 11p gain | 75 (13%) | 487 |
0.116 (1.00) |
0.458 (1.00) |
1 (1.00) |
0.407 (1.00) |
0.35 (1.00) |
|
| 11q gain | 111 (20%) | 451 |
0.945 (1.00) |
0.803 (1.00) |
1 (1.00) |
0.234 (1.00) |
1 (1.00) |
0.576 (1.00) |
| 13q gain | 60 (11%) | 502 |
0.63 (1.00) |
0.00586 (1.00) |
1 (1.00) |
0.541 (1.00) |
0.288 (1.00) |
0.675 (1.00) |
| 14q gain | 57 (10%) | 505 |
0.0599 (1.00) |
0.233 (1.00) |
1 (1.00) |
0.742 (1.00) |
0.0284 (1.00) |
0.722 (1.00) |
| 15q gain | 38 (7%) | 524 |
0.169 (1.00) |
0.765 (1.00) |
1 (1.00) |
0.0326 (1.00) |
1 (1.00) |
|
| 16p gain | 58 (10%) | 504 |
0.904 (1.00) |
0.249 (1.00) |
1 (1.00) |
0.0757 (1.00) |
1 (1.00) |
0.277 (1.00) |
| 16q gain | 30 (5%) | 532 |
0.819 (1.00) |
0.718 (1.00) |
1 (1.00) |
0.22 (1.00) |
1 (1.00) |
0.377 (1.00) |
| 17p gain | 22 (4%) | 540 |
0.17 (1.00) |
0.581 (1.00) |
1 (1.00) |
0.921 (1.00) |
1 (1.00) |
|
| 17q gain | 49 (9%) | 513 |
0.819 (1.00) |
0.486 (1.00) |
1 (1.00) |
0.417 (1.00) |
1 (1.00) |
0.00697 (1.00) |
| 18p gain | 117 (21%) | 445 |
0.17 (1.00) |
0.0404 (1.00) |
1 (1.00) |
0.595 (1.00) |
1 (1.00) |
0.812 (1.00) |
| 18q gain | 71 (13%) | 491 |
0.327 (1.00) |
0.428 (1.00) |
1 (1.00) |
0.618 (1.00) |
1 (1.00) |
0.722 (1.00) |
| 19p gain | 165 (29%) | 397 |
0.456 (1.00) |
0.0641 (1.00) |
0.752 (1.00) |
0.595 (1.00) |
1 (1.00) |
1 (1.00) |
| 19q gain | 159 (28%) | 403 |
0.689 (1.00) |
0.00627 (1.00) |
0.155 (1.00) |
0.903 (1.00) |
0.194 (1.00) |
0.859 (1.00) |
| 22q gain | 25 (4%) | 537 |
0.0507 (1.00) |
0.643 (1.00) |
0.17 (1.00) |
0.00338 (1.00) |
1 (1.00) |
1 (1.00) |
| xq gain | 104 (19%) | 458 |
0.661 (1.00) |
0.124 (1.00) |
0.0692 (1.00) |
0.935 (1.00) |
1 (1.00) |
1 (1.00) |
| 1p loss | 60 (11%) | 502 |
0.915 (1.00) |
0.428 (1.00) |
1 (1.00) |
0.331 (1.00) |
0.288 (1.00) |
1 (1.00) |
| 1q loss | 39 (7%) | 523 |
0.883 (1.00) |
0.458 (1.00) |
1 (1.00) |
0.498 (1.00) |
0.194 (1.00) |
|
| 2p loss | 53 (9%) | 509 |
0.93 (1.00) |
0.393 (1.00) |
1 (1.00) |
0.181 (1.00) |
1 (1.00) |
|
| 2q loss | 59 (10%) | 503 |
0.986 (1.00) |
0.0166 (1.00) |
0.359 (1.00) |
0.181 (1.00) |
1 (1.00) |
1 (1.00) |
| 3p loss | 93 (17%) | 469 |
0.933 (1.00) |
0.0113 (1.00) |
0.523 (1.00) |
0.437 (1.00) |
0.419 (1.00) |
0.0386 (1.00) |
| 3q loss | 41 (7%) | 521 |
0.299 (1.00) |
0.155 (1.00) |
0.266 (1.00) |
0.753 (1.00) |
0.204 (1.00) |
|
| 4p loss | 308 (55%) | 254 |
0.462 (1.00) |
0.963 (1.00) |
0.167 (1.00) |
0.11 (1.00) |
1 (1.00) |
0.659 (1.00) |
| 4q loss | 352 (63%) | 210 |
0.366 (1.00) |
0.577 (1.00) |
0.778 (1.00) |
0.832 (1.00) |
1 (1.00) |
0.645 (1.00) |
| 5p loss | 127 (23%) | 435 |
0.805 (1.00) |
0.0532 (1.00) |
0.646 (1.00) |
0.0319 (1.00) |
1 (1.00) |
0.741 (1.00) |
| 5q loss | 216 (38%) | 346 |
0.437 (1.00) |
0.023 (1.00) |
1 (1.00) |
0.144 (1.00) |
1 (1.00) |
0.778 (1.00) |
| 6p loss | 162 (29%) | 400 |
0.231 (1.00) |
0.11 (1.00) |
0.744 (1.00) |
0.853 (1.00) |
1 (1.00) |
0.493 (1.00) |
| 6q loss | 235 (42%) | 327 |
0.587 (1.00) |
0.131 (1.00) |
0.149 (1.00) |
0.68 (1.00) |
1 (1.00) |
1 (1.00) |
| 7p loss | 117 (21%) | 445 |
0.76 (1.00) |
0.767 (1.00) |
0.608 (1.00) |
0.0452 (1.00) |
1 (1.00) |
0.356 (1.00) |
| 7q loss | 81 (14%) | 481 |
0.289 (1.00) |
0.198 (1.00) |
0.471 (1.00) |
0.0326 (1.00) |
0.374 (1.00) |
0.476 (1.00) |
| 8p loss | 267 (48%) | 295 |
0.138 (1.00) |
0.0321 (1.00) |
0.175 (1.00) |
0.103 (1.00) |
1 (1.00) |
0.339 (1.00) |
| 8q loss | 87 (15%) | 475 |
0.0758 (1.00) |
0.00876 (1.00) |
1 (1.00) |
0.15 (1.00) |
1 (1.00) |
0.741 (1.00) |
| 9p loss | 255 (45%) | 307 |
0.753 (1.00) |
0.0171 (1.00) |
0.455 (1.00) |
0.31 (1.00) |
0.593 (1.00) |
0.382 (1.00) |
| 10p loss | 93 (17%) | 469 |
0.449 (1.00) |
0.156 (1.00) |
1 (1.00) |
0.964 (1.00) |
0.419 (1.00) |
0.62 (1.00) |
| 10q loss | 122 (22%) | 440 |
0.81 (1.00) |
0.0689 (1.00) |
0.619 (1.00) |
0.948 (1.00) |
0.01 (1.00) |
1 (1.00) |
| 11p loss | 191 (34%) | 371 |
0.916 (1.00) |
0.0039 (1.00) |
1 (1.00) |
0.925 (1.00) |
1 (1.00) |
0.658 (1.00) |
| 11q loss | 144 (26%) | 418 |
0.603 (1.00) |
0.0377 (1.00) |
0.274 (1.00) |
0.206 (1.00) |
1 (1.00) |
0.601 (1.00) |
| 12p loss | 77 (14%) | 485 |
0.809 (1.00) |
0.0843 (1.00) |
1 (1.00) |
0.243 (1.00) |
1 (1.00) |
1 (1.00) |
| 12q loss | 102 (18%) | 460 |
0.346 (1.00) |
0.302 (1.00) |
1 (1.00) |
0.832 (1.00) |
1 (1.00) |
1 (1.00) |
| 13q loss | 298 (53%) | 264 |
0.508 (1.00) |
0.432 (1.00) |
0.751 (1.00) |
0.83 (1.00) |
0.603 (1.00) |
0.645 (1.00) |
| 14q loss | 206 (37%) | 356 |
0.52 (1.00) |
0.00124 (0.564) |
0.784 (1.00) |
0.684 (1.00) |
0.302 (1.00) |
0.632 (1.00) |
| 16p loss | 322 (57%) | 240 |
0.361 (1.00) |
0.106 (1.00) |
0.759 (1.00) |
0.866 (1.00) |
0.265 (1.00) |
0.871 (1.00) |
| 17p loss | 466 (83%) | 96 |
0.808 (1.00) |
0.48 (1.00) |
0.527 (1.00) |
0.862 (1.00) |
0.431 (1.00) |
0.0968 (1.00) |
| 17q loss | 372 (66%) | 190 |
0.54 (1.00) |
0.779 (1.00) |
0.798 (1.00) |
0.0108 (1.00) |
0.554 (1.00) |
0.0627 (1.00) |
| 18p loss | 230 (41%) | 332 |
0.0745 (1.00) |
0.973 (1.00) |
0.765 (1.00) |
0.981 (1.00) |
0.068 (1.00) |
0.871 (1.00) |
| 18q loss | 286 (51%) | 276 |
0.113 (1.00) |
0.3 (1.00) |
0.492 (1.00) |
0.952 (1.00) |
0.249 (1.00) |
1 (1.00) |
| 19p loss | 180 (32%) | 382 |
0.169 (1.00) |
0.0128 (1.00) |
0.195 (1.00) |
0.774 (1.00) |
1 (1.00) |
0.308 (1.00) |
| 19q loss | 170 (30%) | 392 |
0.771 (1.00) |
0.336 (1.00) |
0.172 (1.00) |
0.232 (1.00) |
0.557 (1.00) |
0.164 (1.00) |
| 20p loss | 48 (9%) | 514 |
0.0923 (1.00) |
0.351 (1.00) |
1 (1.00) |
0.00337 (1.00) |
0.235 (1.00) |
|
| 20q loss | 31 (6%) | 531 |
0.142 (1.00) |
0.908 (1.00) |
1 (1.00) |
0.00338 (1.00) |
1 (1.00) |
|
| 21q loss | 190 (34%) | 372 |
0.792 (1.00) |
0.344 (1.00) |
0.406 (1.00) |
0.365 (1.00) |
1 (1.00) |
1 (1.00) |
| 22q loss | 419 (75%) | 143 |
0.121 (1.00) |
0.0556 (1.00) |
0.271 (1.00) |
0.88 (1.00) |
0.574 (1.00) |
0.0627 (1.00) |
| xq loss | 270 (48%) | 292 |
0.769 (1.00) |
0.00522 (1.00) |
0.75 (1.00) |
0.799 (1.00) |
0.11 (1.00) |
0.867 (1.00) |
P value = 0.000434 (t-test), Q value = 0.2
Table S1. Gene #2: '1q gain' versus Clinical Feature #2: 'AGE'
| nPatients | Mean (Std.Dev) | |
|---|---|---|
| ALL | 541 | 59.8 (11.6) |
| 1Q GAIN MUTATED | 206 | 62.0 (10.7) |
| 1Q GAIN WILD-TYPE | 335 | 58.5 (12.0) |
Figure S1. Get High-res Image Gene #2: '1q gain' versus Clinical Feature #2: 'AGE'

P value = 5.55e-06 (t-test), Q value = 0.0026
Table S2. Gene #3: '2p gain' versus Clinical Feature #2: 'AGE'
| nPatients | Mean (Std.Dev) | |
|---|---|---|
| ALL | 541 | 59.8 (11.6) |
| 2P GAIN MUTATED | 167 | 63.1 (11.2) |
| 2P GAIN WILD-TYPE | 374 | 58.3 (11.5) |
Figure S2. Get High-res Image Gene #3: '2p gain' versus Clinical Feature #2: 'AGE'
P value = 2.13e-08 (t-test), Q value = 1e-05
Table S3. Gene #6: '3q gain' versus Clinical Feature #2: 'AGE'
| nPatients | Mean (Std.Dev) | |
|---|---|---|
| ALL | 541 | 59.8 (11.6) |
| 3Q GAIN MUTATED | 258 | 62.7 (11.2) |
| 3Q GAIN WILD-TYPE | 283 | 57.2 (11.4) |
Figure S3. Get High-res Image Gene #6: '3q gain' versus Clinical Feature #2: 'AGE'
P value = 2.24e-05 (t-test), Q value = 0.01
Table S4. Gene #11: '6p gain' versus Clinical Feature #2: 'AGE'
| nPatients | Mean (Std.Dev) | |
|---|---|---|
| ALL | 541 | 59.8 (11.6) |
| 6P GAIN MUTATED | 159 | 63.0 (11.0) |
| 6P GAIN WILD-TYPE | 382 | 58.5 (11.6) |
Figure S4. Get High-res Image Gene #11: '6p gain' versus Clinical Feature #2: 'AGE'
P value = 0.000175 (t-test), Q value = 0.081
Table S5. Gene #12: '6q gain' versus Clinical Feature #2: 'AGE'
| nPatients | Mean (Std.Dev) | |
|---|---|---|
| ALL | 541 | 59.8 (11.6) |
| 6Q GAIN MUTATED | 92 | 63.7 (10.6) |
| 6Q GAIN WILD-TYPE | 449 | 59.0 (11.7) |
Figure S5. Get High-res Image Gene #12: '6q gain' versus Clinical Feature #2: 'AGE'

P value = 0.00041 (t-test), Q value = 0.19
Table S6. Gene #13: '7p gain' versus Clinical Feature #2: 'AGE'
| nPatients | Mean (Std.Dev) | |
|---|---|---|
| ALL | 541 | 59.8 (11.6) |
| 7P GAIN MUTATED | 170 | 62.3 (10.9) |
| 7P GAIN WILD-TYPE | 371 | 58.6 (11.8) |
Figure S6. Get High-res Image Gene #13: '7p gain' versus Clinical Feature #2: 'AGE'
P value = 3.85e-08 (t-test), Q value = 1.8e-05
Table S7. Gene #19: '10p gain' versus Clinical Feature #2: 'AGE'
| nPatients | Mean (Std.Dev) | |
|---|---|---|
| ALL | 541 | 59.8 (11.6) |
| 10P GAIN MUTATED | 175 | 63.7 (10.9) |
| 10P GAIN WILD-TYPE | 366 | 57.9 (11.5) |
Figure S7. Get High-res Image Gene #19: '10p gain' versus Clinical Feature #2: 'AGE'

P value = 2.81e-10 (t-test), Q value = 1.3e-07
Table S8. Gene #23: '12p gain' versus Clinical Feature #2: 'AGE'
| nPatients | Mean (Std.Dev) | |
|---|---|---|
| ALL | 541 | 59.8 (11.6) |
| 12P GAIN MUTATED | 236 | 63.3 (11.1) |
| 12P GAIN WILD-TYPE | 305 | 57.1 (11.3) |
Figure S8. Get High-res Image Gene #23: '12p gain' versus Clinical Feature #2: 'AGE'

P value = 2.93e-08 (t-test), Q value = 1.4e-05
Table S9. Gene #24: '12q gain' versus Clinical Feature #2: 'AGE'
| nPatients | Mean (Std.Dev) | |
|---|---|---|
| ALL | 541 | 59.8 (11.6) |
| 12Q GAIN MUTATED | 163 | 63.8 (10.4) |
| 12Q GAIN WILD-TYPE | 378 | 58.1 (11.7) |
Figure S9. Get High-res Image Gene #24: '12q gain' versus Clinical Feature #2: 'AGE'
P value = 1.05e-06 (t-test), Q value = 0.00049
Table S10. Gene #36: '20p gain' versus Clinical Feature #2: 'AGE'
| nPatients | Mean (Std.Dev) | |
|---|---|---|
| ALL | 541 | 59.8 (11.6) |
| 20P GAIN MUTATED | 271 | 62.2 (11.7) |
| 20P GAIN WILD-TYPE | 270 | 57.4 (11.1) |
Figure S10. Get High-res Image Gene #36: '20p gain' versus Clinical Feature #2: 'AGE'

P value = 1.21e-05 (t-test), Q value = 0.0056
Table S11. Gene #37: '20q gain' versus Clinical Feature #2: 'AGE'
| nPatients | Mean (Std.Dev) | |
|---|---|---|
| ALL | 541 | 59.8 (11.6) |
| 20Q GAIN MUTATED | 306 | 61.7 (11.8) |
| 20Q GAIN WILD-TYPE | 235 | 57.3 (10.9) |
Figure S11. Get High-res Image Gene #37: '20q gain' versus Clinical Feature #2: 'AGE'

P value = 0.000518 (t-test), Q value = 0.24
Table S12. Gene #38: '21q gain' versus Clinical Feature #2: 'AGE'
| nPatients | Mean (Std.Dev) | |
|---|---|---|
| ALL | 541 | 59.8 (11.6) |
| 21Q GAIN MUTATED | 106 | 63.1 (10.5) |
| 21Q GAIN WILD-TYPE | 435 | 59.0 (11.7) |
Figure S12. Get High-res Image Gene #38: '21q gain' versus Clinical Feature #2: 'AGE'
P value = 4.57e-07 (t-test), Q value = 0.00021
Table S13. Gene #58: '9q loss' versus Clinical Feature #2: 'AGE'
| nPatients | Mean (Std.Dev) | |
|---|---|---|
| ALL | 541 | 59.8 (11.6) |
| 9Q LOSS MUTATED | 266 | 62.3 (11.3) |
| 9Q LOSS WILD-TYPE | 275 | 57.3 (11.4) |
Figure S13. Get High-res Image Gene #58: '9q loss' versus Clinical Feature #2: 'AGE'

P value = 0.000217 (t-test), Q value = 0.1
Table S14. Gene #67: '15q loss' versus Clinical Feature #2: 'AGE'
| nPatients | Mean (Std.Dev) | |
|---|---|---|
| ALL | 541 | 59.8 (11.6) |
| 15Q LOSS MUTATED | 264 | 61.7 (11.3) |
| 15Q LOSS WILD-TYPE | 277 | 58.0 (11.6) |
Figure S14. Get High-res Image Gene #67: '15q loss' versus Clinical Feature #2: 'AGE'
P value = 8.74e-06 (t-test), Q value = 0.0041
Table S15. Gene #69: '16q loss' versus Clinical Feature #2: 'AGE'
| nPatients | Mean (Std.Dev) | |
|---|---|---|
| ALL | 541 | 59.8 (11.6) |
| 16Q LOSS MUTATED | 385 | 61.2 (11.4) |
| 16Q LOSS WILD-TYPE | 156 | 56.3 (11.5) |
Figure S15. Get High-res Image Gene #69: '16q loss' versus Clinical Feature #2: 'AGE'
-
Copy number data file = transformed.cor.cli.txt
-
Clinical data file = OV-TP.merged_data.txt
-
Number of patients = 562
-
Number of significantly arm-level cnvs = 80
-
Number of selected clinical features = 6
-
Exclude regions that fewer than K tumors have mutations, K = 3
For survival clinical features, the Kaplan-Meier survival curves of tumors with and without gene mutations were plotted and the statistical significance P values were estimated by logrank test (Bland and Altman 2004) using the 'survdiff' function in R
For continuous numerical clinical features, two-tailed Student's t test with unequal variance (Lehmann and Romano 2005) was applied to compare the clinical values between tumors with and without gene mutations using 't.test' function in R
For binary or multi-class clinical features (nominal or ordinal), two-tailed Fisher's exact tests (Fisher 1922) were used to estimate the P values using the 'fisher.test' function in R
For multiple hypothesis correction, Q value is the False Discovery Rate (FDR) analogue of the P value (Benjamini and Hochberg 1995), defined as the minimum FDR at which the test may be called significant. We used the 'Benjamini and Hochberg' method of 'p.adjust' function in R to convert P values into Q values.
In addition to the links below, the full results of the analysis summarized in this report can also be downloaded programmatically using firehose_get, or interactively from either the Broad GDAC website or TCGA Data Coordination Center Portal.