This pipeline computes the correlation between significantly recurrent gene mutations and molecular subtypes.
Testing the association between mutation status of 3 genes and 14 molecular subtypes across 316 patients, no significant finding detected with P value < 0.05 and Q value < 0.25.
-
No gene mutations related to molecuar subtypes.
Table 1. Get Full Table Overview of the association between mutation status of 3 genes and 14 molecular subtypes. Shown in the table are P values (Q values). Thresholded by P value < 0.05 and Q value < 0.25, no significant finding detected.
|
Clinical Features |
MRNA CNMF |
MRNA CHIERARCHICAL |
MIR CNMF |
MIR CHIERARCHICAL |
CN CNMF |
METHLYATION CNMF |
RPPA CNMF |
RPPA CHIERARCHICAL |
MRNASEQ CNMF |
MRNASEQ CHIERARCHICAL |
MIRSEQ CNMF |
MIRSEQ CHIERARCHICAL |
MIRSEQ MATURE CNMF |
MIRSEQ MATURE CHIERARCHICAL |
||
| nMutated (%) | nWild-Type | Fisher's exact test | Fisher's exact test | Fisher's exact test | Chi-square test | Fisher's exact test | Fisher's exact test | Fisher's exact test | Fisher's exact test | Fisher's exact test | Fisher's exact test | Fisher's exact test | Fisher's exact test | Fisher's exact test | Fisher's exact test | |
| TP53 | 276 (87%) | 40 |
0.814 (1.00) |
0.407 (1.00) |
0.493 (1.00) |
0.367 (1.00) |
0.553 (1.00) |
0.79 (1.00) |
0.393 (1.00) |
0.316 (1.00) |
0.768 (1.00) |
0.882 (1.00) |
0.341 (1.00) |
0.176 (1.00) |
0.15 (1.00) |
0.727 (1.00) |
| TBP | 4 (1%) | 312 |
1 (1.00) |
0.837 (1.00) |
0.692 (1.00) |
0.596 (1.00) |
0.0365 (1.00) |
0.018 (0.684) |
0.131 (1.00) |
0.872 (1.00) |
1 (1.00) |
1 (1.00) |
0.689 (1.00) |
1 (1.00) |
1 (1.00) |
1 (1.00) |
| SRC | 4 (1%) | 312 |
0.838 (1.00) |
0.837 (1.00) |
0.566 (1.00) |
0.16 (1.00) |
0.161 (1.00) |
0.464 (1.00) |
0.483 (1.00) |
0.325 (1.00) |
0.605 (1.00) |
0.324 (1.00) |
P value = 0.814 (Fisher's exact test), Q value = 1
Table S1. Gene #1: 'TP53 MUTATION STATUS' versus Molecular Subtype #1: 'MRNA_CNMF'
| nPatients | CLUS_1 | CLUS_2 | CLUS_3 |
|---|---|---|---|
| ALL | 119 | 115 | 82 |
| TP53 MUTATED | 105 | 101 | 70 |
| TP53 WILD-TYPE | 14 | 14 | 12 |
P value = 0.407 (Fisher's exact test), Q value = 1
Table S2. Gene #1: 'TP53 MUTATION STATUS' versus Molecular Subtype #2: 'MRNA_CHIERARCHICAL'
| nPatients | CLUS_1 | CLUS_2 | CLUS_3 |
|---|---|---|---|
| ALL | 85 | 118 | 113 |
| TP53 MUTATED | 71 | 106 | 99 |
| TP53 WILD-TYPE | 14 | 12 | 14 |
P value = 0.493 (Fisher's exact test), Q value = 1
Table S3. Gene #1: 'TP53 MUTATION STATUS' versus Molecular Subtype #3: 'MIR_CNMF'
| nPatients | CLUS_1 | CLUS_2 | CLUS_3 |
|---|---|---|---|
| ALL | 92 | 96 | 128 |
| TP53 MUTATED | 83 | 81 | 112 |
| TP53 WILD-TYPE | 9 | 15 | 16 |
P value = 0.367 (Chi-square test), Q value = 1
Table S4. Gene #1: 'TP53 MUTATION STATUS' versus Molecular Subtype #4: 'MIR_CHIERARCHICAL'
| nPatients | CLUS_1 | CLUS_2 | CLUS_3 | CLUS_4 | CLUS_5 | CLUS_6 |
|---|---|---|---|---|---|---|
| ALL | 32 | 76 | 75 | 57 | 27 | 49 |
| TP53 MUTATED | 29 | 67 | 68 | 50 | 24 | 38 |
| TP53 WILD-TYPE | 3 | 9 | 7 | 7 | 3 | 11 |
P value = 0.553 (Fisher's exact test), Q value = 1
Table S5. Gene #1: 'TP53 MUTATION STATUS' versus Molecular Subtype #5: 'CN_CNMF'
| nPatients | CLUS_1 | CLUS_2 | CLUS_3 |
|---|---|---|---|
| ALL | 112 | 103 | 96 |
| TP53 MUTATED | 97 | 93 | 82 |
| TP53 WILD-TYPE | 15 | 10 | 14 |
P value = 0.79 (Fisher's exact test), Q value = 1
Table S6. Gene #1: 'TP53 MUTATION STATUS' versus Molecular Subtype #6: 'METHLYATION_CNMF'
| nPatients | CLUS_1 | CLUS_2 | CLUS_3 |
|---|---|---|---|
| ALL | 90 | 105 | 121 |
| TP53 MUTATED | 80 | 90 | 106 |
| TP53 WILD-TYPE | 10 | 15 | 15 |
P value = 0.393 (Fisher's exact test), Q value = 1
Table S7. Gene #1: 'TP53 MUTATION STATUS' versus Molecular Subtype #7: 'RPPA_CNMF'
| nPatients | CLUS_1 | CLUS_2 | CLUS_3 |
|---|---|---|---|
| ALL | 76 | 96 | 38 |
| TP53 MUTATED | 65 | 88 | 33 |
| TP53 WILD-TYPE | 11 | 8 | 5 |
P value = 0.316 (Fisher's exact test), Q value = 1
Table S8. Gene #1: 'TP53 MUTATION STATUS' versus Molecular Subtype #8: 'RPPA_CHIERARCHICAL'
| nPatients | CLUS_1 | CLUS_2 | CLUS_3 | CLUS_4 |
|---|---|---|---|---|
| ALL | 30 | 45 | 52 | 83 |
| TP53 MUTATED | 28 | 41 | 48 | 69 |
| TP53 WILD-TYPE | 2 | 4 | 4 | 14 |
P value = 0.768 (Fisher's exact test), Q value = 1
Table S9. Gene #1: 'TP53 MUTATION STATUS' versus Molecular Subtype #9: 'MRNASEQ_CNMF'
| nPatients | CLUS_1 | CLUS_2 | CLUS_3 |
|---|---|---|---|
| ALL | 70 | 40 | 51 |
| TP53 MUTATED | 60 | 36 | 46 |
| TP53 WILD-TYPE | 10 | 4 | 5 |
P value = 0.882 (Fisher's exact test), Q value = 1
Table S10. Gene #1: 'TP53 MUTATION STATUS' versus Molecular Subtype #10: 'MRNASEQ_CHIERARCHICAL'
| nPatients | CLUS_1 | CLUS_2 | CLUS_3 |
|---|---|---|---|
| ALL | 68 | 66 | 27 |
| TP53 MUTATED | 61 | 57 | 24 |
| TP53 WILD-TYPE | 7 | 9 | 3 |
P value = 0.341 (Fisher's exact test), Q value = 1
Table S11. Gene #1: 'TP53 MUTATION STATUS' versus Molecular Subtype #11: 'MIRSEQ_CNMF'
| nPatients | CLUS_1 | CLUS_2 | CLUS_3 |
|---|---|---|---|
| ALL | 79 | 119 | 89 |
| TP53 MUTATED | 65 | 106 | 79 |
| TP53 WILD-TYPE | 14 | 13 | 10 |
P value = 0.176 (Fisher's exact test), Q value = 1
Table S12. Gene #1: 'TP53 MUTATION STATUS' versus Molecular Subtype #12: 'MIRSEQ_CHIERARCHICAL'
| nPatients | CLUS_1 | CLUS_2 | CLUS_3 |
|---|---|---|---|
| ALL | 4 | 181 | 102 |
| TP53 MUTATED | 3 | 154 | 93 |
| TP53 WILD-TYPE | 1 | 27 | 9 |
P value = 0.15 (Fisher's exact test), Q value = 1
Table S13. Gene #1: 'TP53 MUTATION STATUS' versus Molecular Subtype #13: 'MIRSEQ_MATURE_CNMF'
| nPatients | CLUS_1 | CLUS_2 | CLUS_3 |
|---|---|---|---|
| ALL | 64 | 124 | 99 |
| TP53 MUTATED | 51 | 111 | 88 |
| TP53 WILD-TYPE | 13 | 13 | 11 |
P value = 0.727 (Fisher's exact test), Q value = 1
Table S14. Gene #1: 'TP53 MUTATION STATUS' versus Molecular Subtype #14: 'MIRSEQ_MATURE_CHIERARCHICAL'
| nPatients | CLUS_1 | CLUS_2 | CLUS_3 |
|---|---|---|---|
| ALL | 100 | 5 | 182 |
| TP53 MUTATED | 89 | 5 | 156 |
| TP53 WILD-TYPE | 11 | 0 | 26 |
P value = 1 (Fisher's exact test), Q value = 1
Table S15. Gene #2: 'TBP MUTATION STATUS' versus Molecular Subtype #1: 'MRNA_CNMF'
| nPatients | CLUS_1 | CLUS_2 | CLUS_3 |
|---|---|---|---|
| ALL | 119 | 115 | 82 |
| TBP MUTATED | 2 | 1 | 1 |
| TBP WILD-TYPE | 117 | 114 | 81 |
P value = 0.837 (Fisher's exact test), Q value = 1
Table S16. Gene #2: 'TBP MUTATION STATUS' versus Molecular Subtype #2: 'MRNA_CHIERARCHICAL'
| nPatients | CLUS_1 | CLUS_2 | CLUS_3 |
|---|---|---|---|
| ALL | 85 | 118 | 113 |
| TBP MUTATED | 1 | 1 | 2 |
| TBP WILD-TYPE | 84 | 117 | 111 |
P value = 0.692 (Fisher's exact test), Q value = 1
Table S17. Gene #2: 'TBP MUTATION STATUS' versus Molecular Subtype #3: 'MIR_CNMF'
| nPatients | CLUS_1 | CLUS_2 | CLUS_3 |
|---|---|---|---|
| ALL | 92 | 96 | 128 |
| TBP MUTATED | 2 | 1 | 1 |
| TBP WILD-TYPE | 90 | 95 | 127 |
P value = 0.596 (Chi-square test), Q value = 1
Table S18. Gene #2: 'TBP MUTATION STATUS' versus Molecular Subtype #4: 'MIR_CHIERARCHICAL'
| nPatients | CLUS_1 | CLUS_2 | CLUS_3 | CLUS_4 | CLUS_5 | CLUS_6 |
|---|---|---|---|---|---|---|
| ALL | 32 | 76 | 75 | 57 | 27 | 49 |
| TBP MUTATED | 0 | 1 | 1 | 2 | 0 | 0 |
| TBP WILD-TYPE | 32 | 75 | 74 | 55 | 27 | 49 |
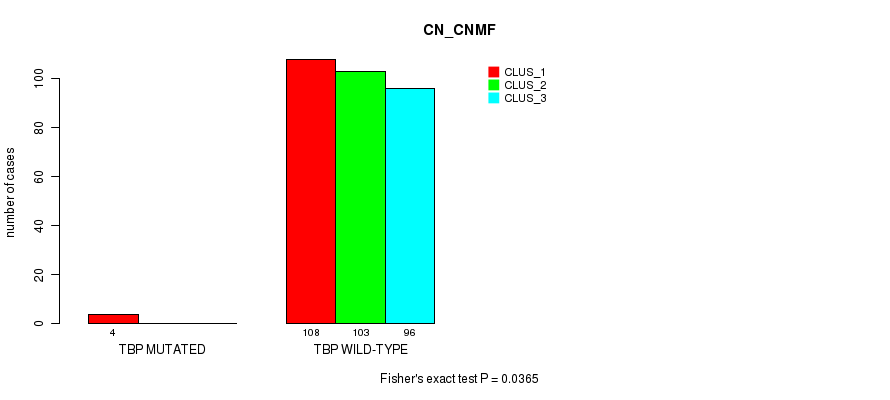
P value = 0.0365 (Fisher's exact test), Q value = 1
Table S19. Gene #2: 'TBP MUTATION STATUS' versus Molecular Subtype #5: 'CN_CNMF'
| nPatients | CLUS_1 | CLUS_2 | CLUS_3 |
|---|---|---|---|
| ALL | 112 | 103 | 96 |
| TBP MUTATED | 4 | 0 | 0 |
| TBP WILD-TYPE | 108 | 103 | 96 |
Figure S1. Get High-res Image Gene #2: 'TBP MUTATION STATUS' versus Molecular Subtype #5: 'CN_CNMF'
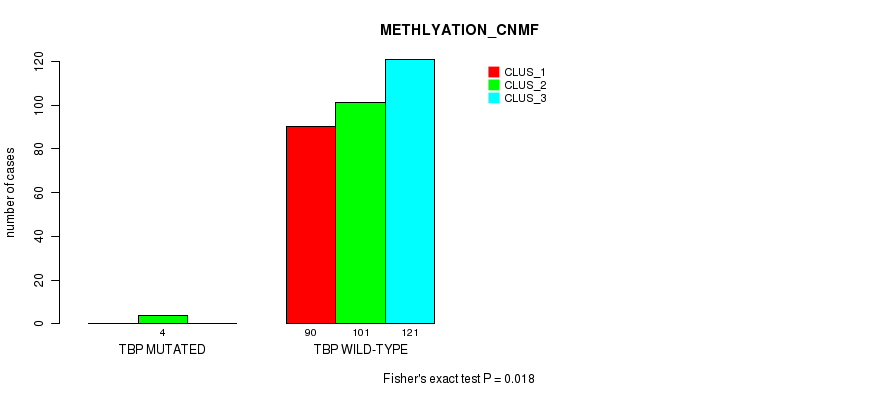
P value = 0.018 (Fisher's exact test), Q value = 0.68
Table S20. Gene #2: 'TBP MUTATION STATUS' versus Molecular Subtype #6: 'METHLYATION_CNMF'
| nPatients | CLUS_1 | CLUS_2 | CLUS_3 |
|---|---|---|---|
| ALL | 90 | 105 | 121 |
| TBP MUTATED | 0 | 4 | 0 |
| TBP WILD-TYPE | 90 | 101 | 121 |
Figure S2. Get High-res Image Gene #2: 'TBP MUTATION STATUS' versus Molecular Subtype #6: 'METHLYATION_CNMF'
P value = 0.131 (Fisher's exact test), Q value = 1
Table S21. Gene #2: 'TBP MUTATION STATUS' versus Molecular Subtype #7: 'RPPA_CNMF'
| nPatients | CLUS_1 | CLUS_2 | CLUS_3 |
|---|---|---|---|
| ALL | 76 | 96 | 38 |
| TBP MUTATED | 3 | 0 | 0 |
| TBP WILD-TYPE | 73 | 96 | 38 |
P value = 0.872 (Fisher's exact test), Q value = 1
Table S22. Gene #2: 'TBP MUTATION STATUS' versus Molecular Subtype #8: 'RPPA_CHIERARCHICAL'
| nPatients | CLUS_1 | CLUS_2 | CLUS_3 | CLUS_4 |
|---|---|---|---|---|
| ALL | 30 | 45 | 52 | 83 |
| TBP MUTATED | 0 | 0 | 1 | 2 |
| TBP WILD-TYPE | 30 | 45 | 51 | 81 |
P value = 1 (Fisher's exact test), Q value = 1
Table S23. Gene #2: 'TBP MUTATION STATUS' versus Molecular Subtype #9: 'MRNASEQ_CNMF'
| nPatients | CLUS_1 | CLUS_2 | CLUS_3 |
|---|---|---|---|
| ALL | 70 | 40 | 51 |
| TBP MUTATED | 1 | 1 | 1 |
| TBP WILD-TYPE | 69 | 39 | 50 |
P value = 1 (Fisher's exact test), Q value = 1
Table S24. Gene #2: 'TBP MUTATION STATUS' versus Molecular Subtype #10: 'MRNASEQ_CHIERARCHICAL'
| nPatients | CLUS_1 | CLUS_2 | CLUS_3 |
|---|---|---|---|
| ALL | 68 | 66 | 27 |
| TBP MUTATED | 2 | 1 | 0 |
| TBP WILD-TYPE | 66 | 65 | 27 |
P value = 0.689 (Fisher's exact test), Q value = 1
Table S25. Gene #2: 'TBP MUTATION STATUS' versus Molecular Subtype #11: 'MIRSEQ_CNMF'
| nPatients | CLUS_1 | CLUS_2 | CLUS_3 |
|---|---|---|---|
| ALL | 79 | 119 | 89 |
| TBP MUTATED | 2 | 1 | 1 |
| TBP WILD-TYPE | 77 | 118 | 88 |
P value = 1 (Fisher's exact test), Q value = 1
Table S26. Gene #2: 'TBP MUTATION STATUS' versus Molecular Subtype #12: 'MIRSEQ_CHIERARCHICAL'
| nPatients | CLUS_1 | CLUS_2 | CLUS_3 |
|---|---|---|---|
| ALL | 4 | 181 | 102 |
| TBP MUTATED | 0 | 3 | 1 |
| TBP WILD-TYPE | 4 | 178 | 101 |
P value = 1 (Fisher's exact test), Q value = 1
Table S27. Gene #2: 'TBP MUTATION STATUS' versus Molecular Subtype #13: 'MIRSEQ_MATURE_CNMF'
| nPatients | CLUS_1 | CLUS_2 | CLUS_3 |
|---|---|---|---|
| ALL | 64 | 124 | 99 |
| TBP MUTATED | 1 | 2 | 1 |
| TBP WILD-TYPE | 63 | 122 | 98 |
P value = 1 (Fisher's exact test), Q value = 1
Table S28. Gene #2: 'TBP MUTATION STATUS' versus Molecular Subtype #14: 'MIRSEQ_MATURE_CHIERARCHICAL'
| nPatients | CLUS_1 | CLUS_2 | CLUS_3 |
|---|---|---|---|
| ALL | 100 | 5 | 182 |
| TBP MUTATED | 1 | 0 | 3 |
| TBP WILD-TYPE | 99 | 5 | 179 |
P value = 0.838 (Fisher's exact test), Q value = 1
Table S29. Gene #3: 'SRC MUTATION STATUS' versus Molecular Subtype #1: 'MRNA_CNMF'
| nPatients | CLUS_1 | CLUS_2 | CLUS_3 |
|---|---|---|---|
| ALL | 119 | 115 | 82 |
| SRC MUTATED | 1 | 2 | 1 |
| SRC WILD-TYPE | 118 | 113 | 81 |
P value = 0.837 (Fisher's exact test), Q value = 1
Table S30. Gene #3: 'SRC MUTATION STATUS' versus Molecular Subtype #2: 'MRNA_CHIERARCHICAL'
| nPatients | CLUS_1 | CLUS_2 | CLUS_3 |
|---|---|---|---|
| ALL | 85 | 118 | 113 |
| SRC MUTATED | 1 | 1 | 2 |
| SRC WILD-TYPE | 84 | 117 | 111 |
P value = 0.566 (Fisher's exact test), Q value = 1
Table S31. Gene #3: 'SRC MUTATION STATUS' versus Molecular Subtype #3: 'MIR_CNMF'
| nPatients | CLUS_1 | CLUS_2 | CLUS_3 |
|---|---|---|---|
| ALL | 92 | 96 | 128 |
| SRC MUTATED | 0 | 2 | 2 |
| SRC WILD-TYPE | 92 | 94 | 126 |
P value = 0.16 (Chi-square test), Q value = 1
Table S32. Gene #3: 'SRC MUTATION STATUS' versus Molecular Subtype #4: 'MIR_CHIERARCHICAL'
| nPatients | CLUS_1 | CLUS_2 | CLUS_3 | CLUS_4 | CLUS_5 | CLUS_6 |
|---|---|---|---|---|---|---|
| ALL | 32 | 76 | 75 | 57 | 27 | 49 |
| SRC MUTATED | 1 | 3 | 0 | 0 | 0 | 0 |
| SRC WILD-TYPE | 31 | 73 | 75 | 57 | 27 | 49 |
P value = 0.161 (Fisher's exact test), Q value = 1
Table S33. Gene #3: 'SRC MUTATION STATUS' versus Molecular Subtype #5: 'CN_CNMF'
| nPatients | CLUS_1 | CLUS_2 | CLUS_3 |
|---|---|---|---|
| ALL | 112 | 103 | 96 |
| SRC MUTATED | 0 | 3 | 1 |
| SRC WILD-TYPE | 112 | 100 | 95 |
P value = 0.464 (Fisher's exact test), Q value = 1
Table S34. Gene #3: 'SRC MUTATION STATUS' versus Molecular Subtype #6: 'METHLYATION_CNMF'
| nPatients | CLUS_1 | CLUS_2 | CLUS_3 |
|---|---|---|---|
| ALL | 90 | 105 | 121 |
| SRC MUTATED | 0 | 1 | 3 |
| SRC WILD-TYPE | 90 | 104 | 118 |
P value = 0.483 (Fisher's exact test), Q value = 1
Table S35. Gene #3: 'SRC MUTATION STATUS' versus Molecular Subtype #11: 'MIRSEQ_CNMF'
| nPatients | CLUS_1 | CLUS_2 | CLUS_3 |
|---|---|---|---|
| ALL | 79 | 119 | 89 |
| SRC MUTATED | 0 | 1 | 2 |
| SRC WILD-TYPE | 79 | 118 | 87 |
P value = 0.325 (Fisher's exact test), Q value = 1
Table S36. Gene #3: 'SRC MUTATION STATUS' versus Molecular Subtype #12: 'MIRSEQ_CHIERARCHICAL'
| nPatients | CLUS_1 | CLUS_2 | CLUS_3 |
|---|---|---|---|
| ALL | 4 | 181 | 102 |
| SRC MUTATED | 0 | 1 | 2 |
| SRC WILD-TYPE | 4 | 180 | 100 |
P value = 0.605 (Fisher's exact test), Q value = 1
Table S37. Gene #3: 'SRC MUTATION STATUS' versus Molecular Subtype #13: 'MIRSEQ_MATURE_CNMF'
| nPatients | CLUS_1 | CLUS_2 | CLUS_3 |
|---|---|---|---|
| ALL | 64 | 124 | 99 |
| SRC MUTATED | 0 | 1 | 2 |
| SRC WILD-TYPE | 64 | 123 | 97 |
P value = 0.324 (Fisher's exact test), Q value = 1
Table S38. Gene #3: 'SRC MUTATION STATUS' versus Molecular Subtype #14: 'MIRSEQ_MATURE_CHIERARCHICAL'
| nPatients | CLUS_1 | CLUS_2 | CLUS_3 |
|---|---|---|---|
| ALL | 100 | 5 | 182 |
| SRC MUTATED | 2 | 0 | 1 |
| SRC WILD-TYPE | 98 | 5 | 181 |
-
Mutation data file = transformed.cor.cli.txt
-
Molecular subtypes file = OV-TP.transferedmergedcluster.txt
-
Number of patients = 316
-
Number of significantly mutated genes = 3
-
Number of Molecular subtypes = 14
-
Exclude genes that fewer than K tumors have mutations, K = 3
For binary or multi-class clinical features (nominal or ordinal), two-tailed Fisher's exact tests (Fisher 1922) were used to estimate the P values using the 'fisher.test' function in R
For multi-class clinical features (nominal or ordinal), Chi-square tests (Greenwood and Nikulin 1996) were used to estimate the P values using the 'chisq.test' function in R
For multiple hypothesis correction, Q value is the False Discovery Rate (FDR) analogue of the P value (Benjamini and Hochberg 1995), defined as the minimum FDR at which the test may be called significant. We used the 'Benjamini and Hochberg' method of 'p.adjust' function in R to convert P values into Q values.
In addition to the links below, the full results of the analysis summarized in this report can also be downloaded programmatically using firehose_get, or interactively from either the Broad GDAC website or TCGA Data Coordination Center Portal.