This report serves to describe the mutational landscape and properties of a given individual set, as well as rank genes and genesets according to mutational significance. MutSig v2.0 and MutSigCV v0.9 merged result was used to generate the results found in this report.
-
Working with individual set: PAAD-TP
-
Number of patients in set: 57
The input for this pipeline is a set of individuals with the following files associated for each:
-
An annotated .maf file describing the mutations called for the respective individual, and their properties.
-
A .wig file that contains information about the coverage of the sample.
-
MAF used for this analysis:PAAD-TP.final_analysis_set.maf
-
Significantly mutated genes (q ≤ 0.1): 99
-
Mutations seen in COSMIC: 134
-
Significantly mutated genes in COSMIC territory: 8
-
Significantly mutated genesets: 21
-
Read 57 MAFs of type "Broad"
-
Total number of mutations in input MAFs: 27745
-
After removing 95 mutations outside chr1-24: 27650
-
After removing 3296 blacklisted mutations: 24354
-
After removing 387 noncoding mutations: 23967
-
After collapsing adjacent/redundant mutations: 23883
-
Number of mutations before filtering: 23883
-
After removing 898 mutations outside gene set: 22985
-
After removing 130 mutations outside category set: 22855
-
After removing 1 "impossible" mutations in
-
gene-patient-category bins of zero coverage: 21826
Table 1. Get Full Table Table representing breakdown of mutations by type.
| type | count |
|---|---|
| Frame_Shift_Del | 795 |
| Frame_Shift_Ins | 275 |
| In_Frame_Del | 884 |
| In_Frame_Ins | 19 |
| Missense_Mutation | 13811 |
| Nonsense_Mutation | 868 |
| Nonstop_Mutation | 4 |
| Silent | 5460 |
| Splice_Site | 736 |
| Translation_Start_Site | 3 |
| Total | 22855 |
Table 2. Get Full Table A breakdown of mutation rates per category discovered for this individual set.
| category | n | N | rate | rate_per_mb | relative_rate | exp_ns_s_ratio |
|---|---|---|---|---|---|---|
| *CpG->T | 4314 | 98986159 | 0.000044 | 44 | 4.3 | 2.1 |
| *Cp(A/C/T)->T | 3444 | 788202097 | 4.4e-06 | 4.4 | 0.43 | 1.7 |
| C->(G/A) | 3341 | 887188256 | 3.8e-06 | 3.8 | 0.37 | 4.7 |
| A->mut | 2711 | 841595742 | 3.2e-06 | 3.2 | 0.32 | 3.9 |
| indel+null | 3465 | 1728783998 | 2e-06 | 2 | 0.2 | NaN |
| double_null | 119 | 1728783998 | 6.9e-08 | 0.069 | 0.0068 | NaN |
| Total | 17394 | 1728783998 | 1e-05 | 10 | 1 | 3.5 |
The x axis represents the samples. The y axis represents the exons, one row per exon, and they are sorted by average coverage across samples. For exons with exactly the same average coverage, they are sorted next by the %GC of the exon. (The secondary sort is especially useful for the zero-coverage exons at the bottom).
Figure 1.
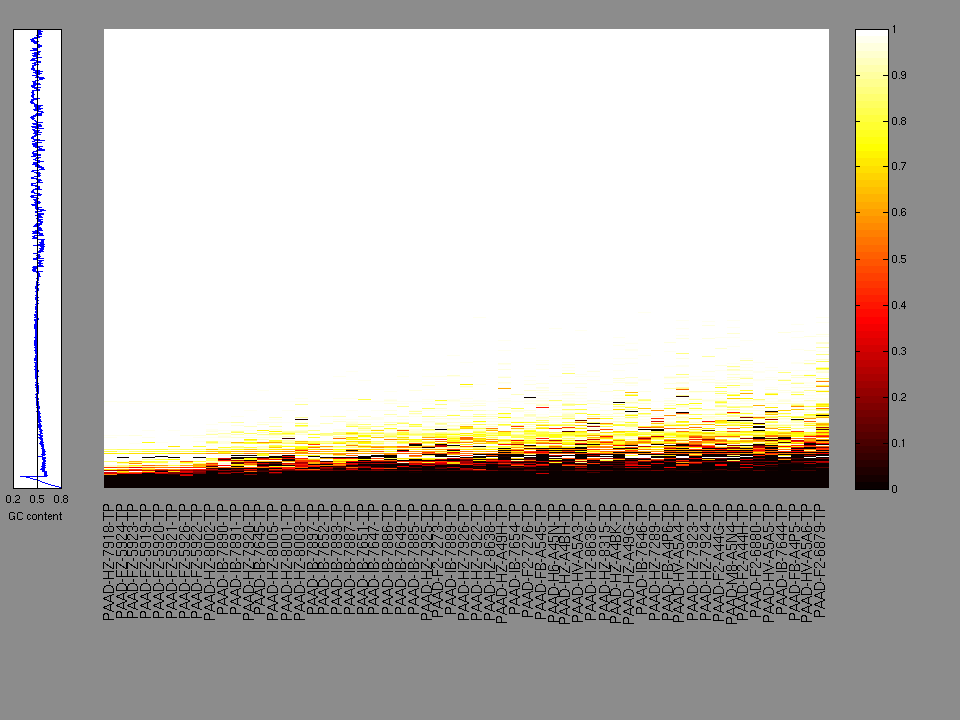
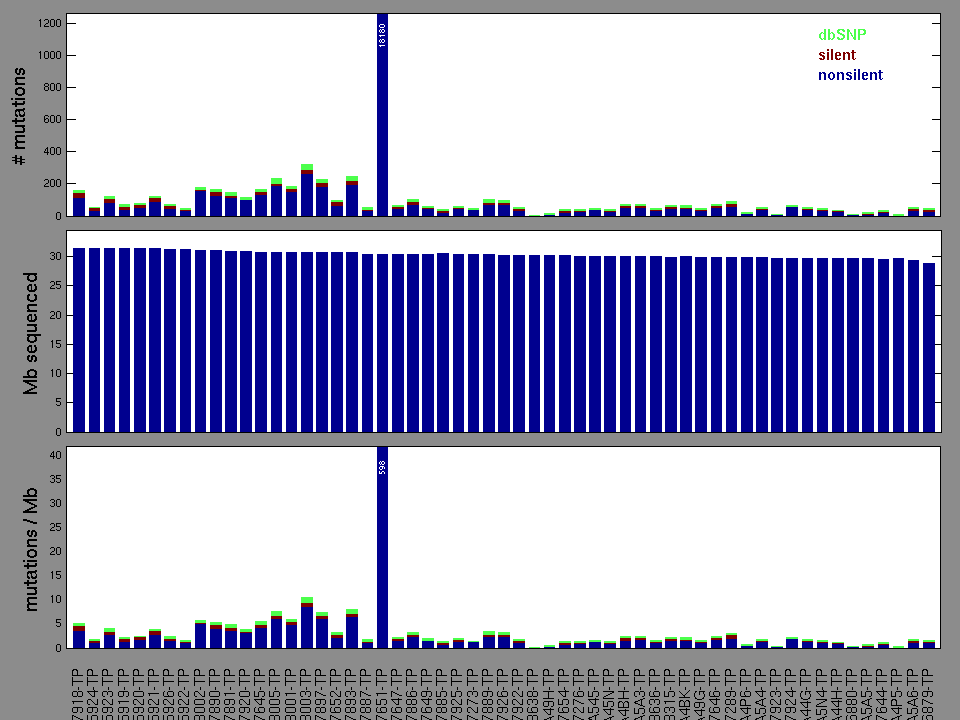
Figure 2. Patients counts and rates file used to generate this plot: PAAD-TP.patients.counts_and_rates.txt
The mutation spectrum is depicted in the lego plots below in which the 96 possible mutation types are subdivided into six large blocks, color-coded to reflect the base substitution type. Each large block is further subdivided into the 16 possible pairs of 5' and 3' neighbors, as listed in the 4x4 trinucleotide context legend. The height of each block corresponds to the mutation frequency for that kind of mutation (counts of mutations normalized by the base coverage in a given bin). The shape of the spectrum is a signature for dominant mutational mechanisms in different tumor types.
Figure 3. Get High-res Image SNV Mutation rate lego plot for entire set. Each bin is normalized by base coverage for that bin. Colors represent the six SNV types on the upper right. The three-base context for each mutation is labeled in the 4x4 legend on the lower right. The fractional breakdown of SNV counts is shown in the pie chart on the upper left. If this figure is blank, not enough information was provided in the MAF to generate it.
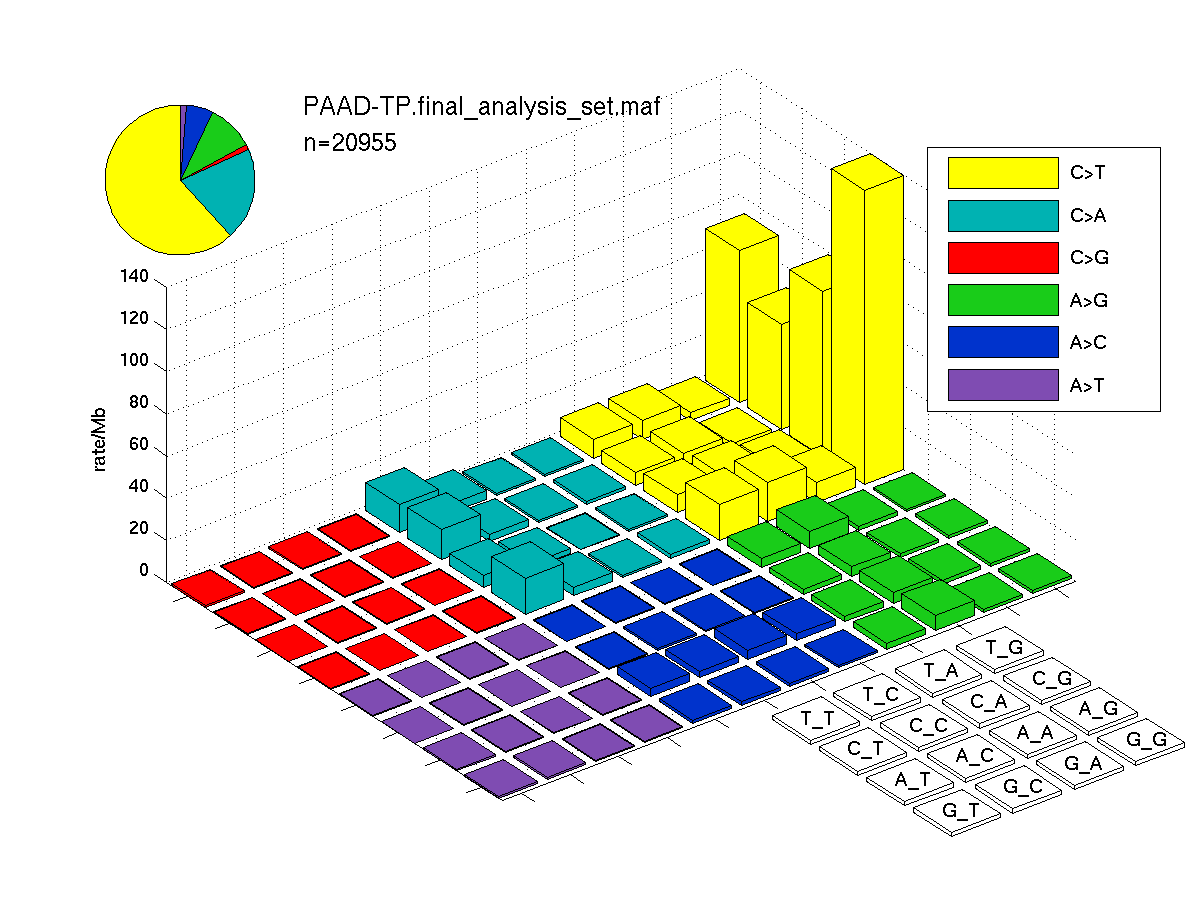
Figure 4. Get High-res Image SNV Mutation rate lego plots for 4 slices of mutation allele fraction (0<=AF<0.1, 0.1<=AF<0.25, 0.25<=AF<0.5, & 0.5<=AF) . The color code and three-base context legends are the same as the previous figure. If this figure is blank, not enough information was provided in the MAF to generate it.
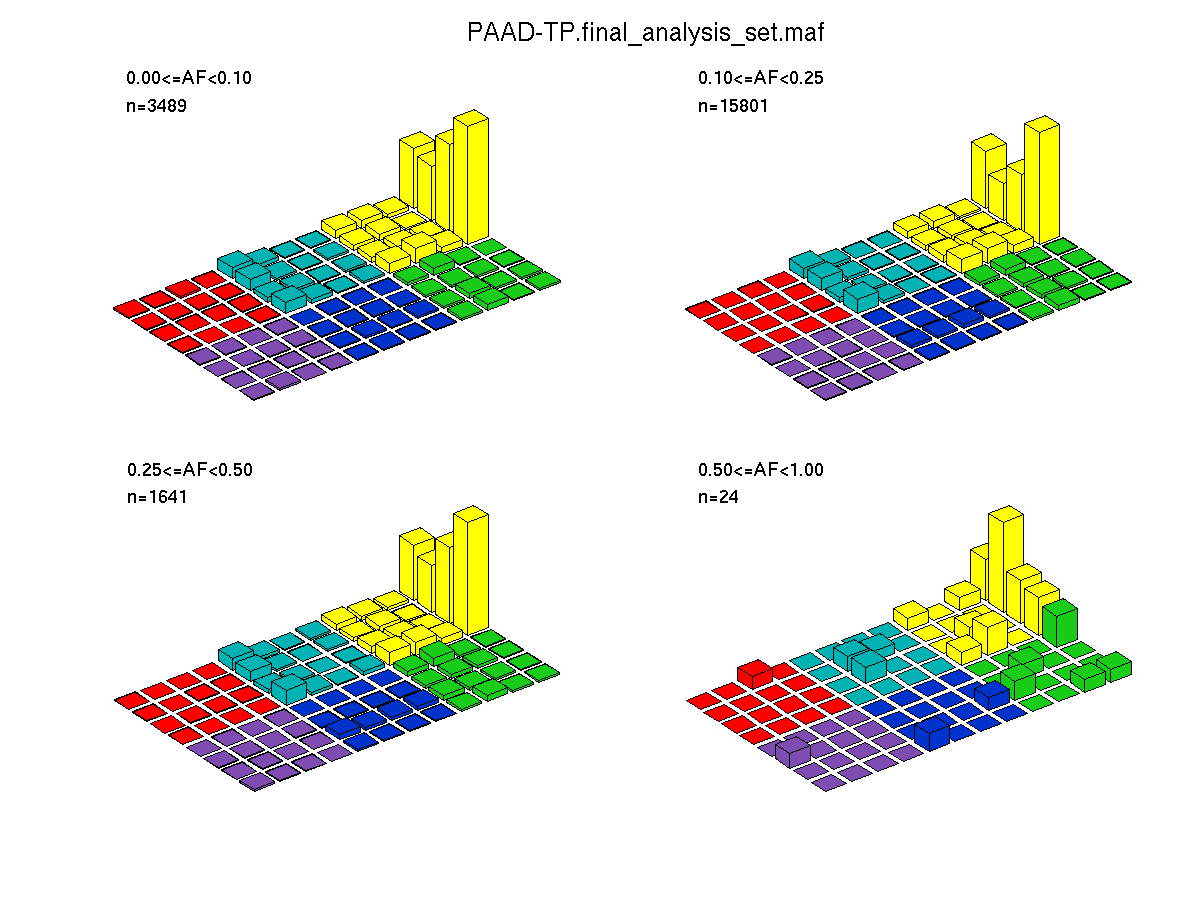
Figure 5. Get High-res Image The matrix in the center of the figure represents individual mutations in patient samples, color-coded by type of mutation, for the significantly mutated genes. The rate of synonymous and non-synonymous mutations is displayed at the top of the matrix. The barplot on the left of the matrix shows the number of mutations in each gene. The percentages represent the fraction of tumors with at least one mutation in the specified gene. The barplot to the right of the matrix displays the q-values for the most significantly mutated genes. The purple boxplots below the matrix (only displayed if required columns are present in the provided MAF) represent the distributions of allelic fractions observed in each sample. The plot at the bottom represents the base substitution distribution of individual samples, using the same categories that were used to calculate significance.
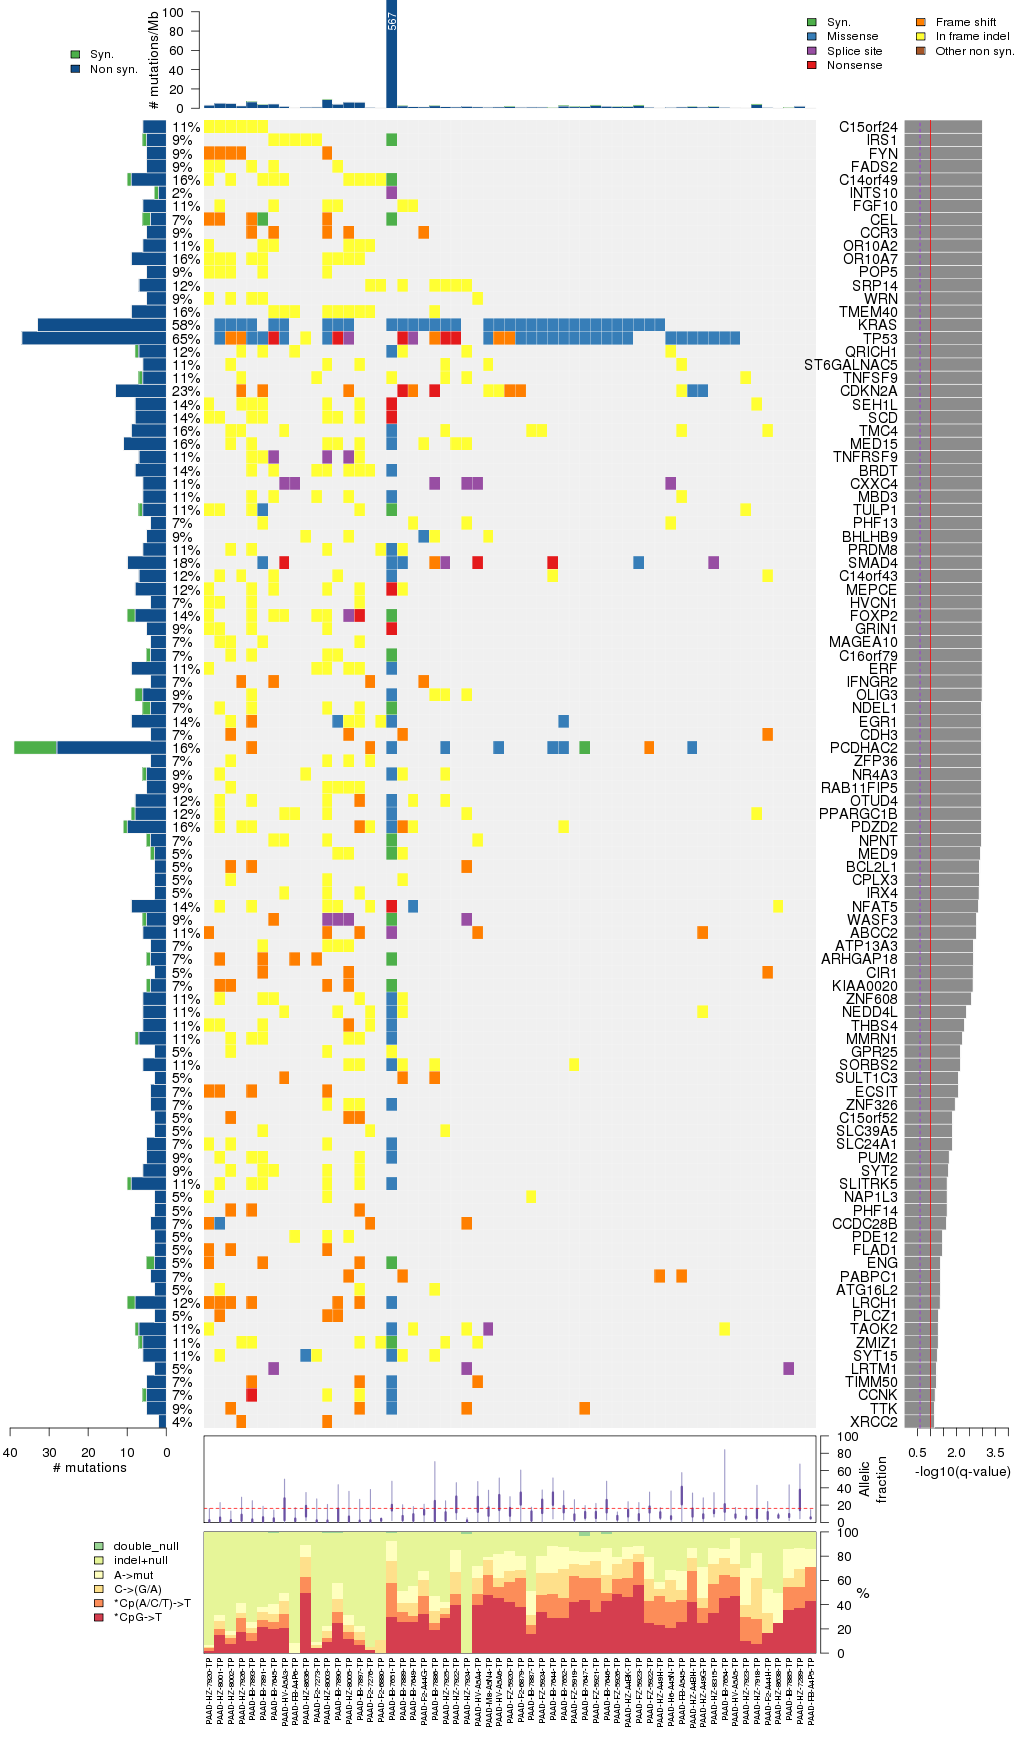
Column Descriptions:
-
N = number of sequenced bases in this gene across the individual set
-
n = number of (nonsilent) mutations in this gene across the individual set
-
npat = number of patients (individuals) with at least one nonsilent mutation
-
nsite = number of unique sites having a non-silent mutation
-
nsil = number of silent mutations in this gene across the individual set
-
n1 = number of nonsilent mutations of type: *CpG->T
-
n2 = number of nonsilent mutations of type: *Cp(A/C/T)->T
-
n3 = number of nonsilent mutations of type: C->(G/A)
-
n4 = number of nonsilent mutations of type: A->mut
-
n5 = number of nonsilent mutations of type: indel+null
-
n6 = number of nonsilent mutations of type: double_null
-
p_cons = p-value for enrichment of mutations at evolutionarily most-conserved sites in gene
-
p_joint = p-value for clustering + conservation
-
p = p-value (overall)
-
q = q-value, False Discovery Rate (Benjamini-Hochberg procedure)
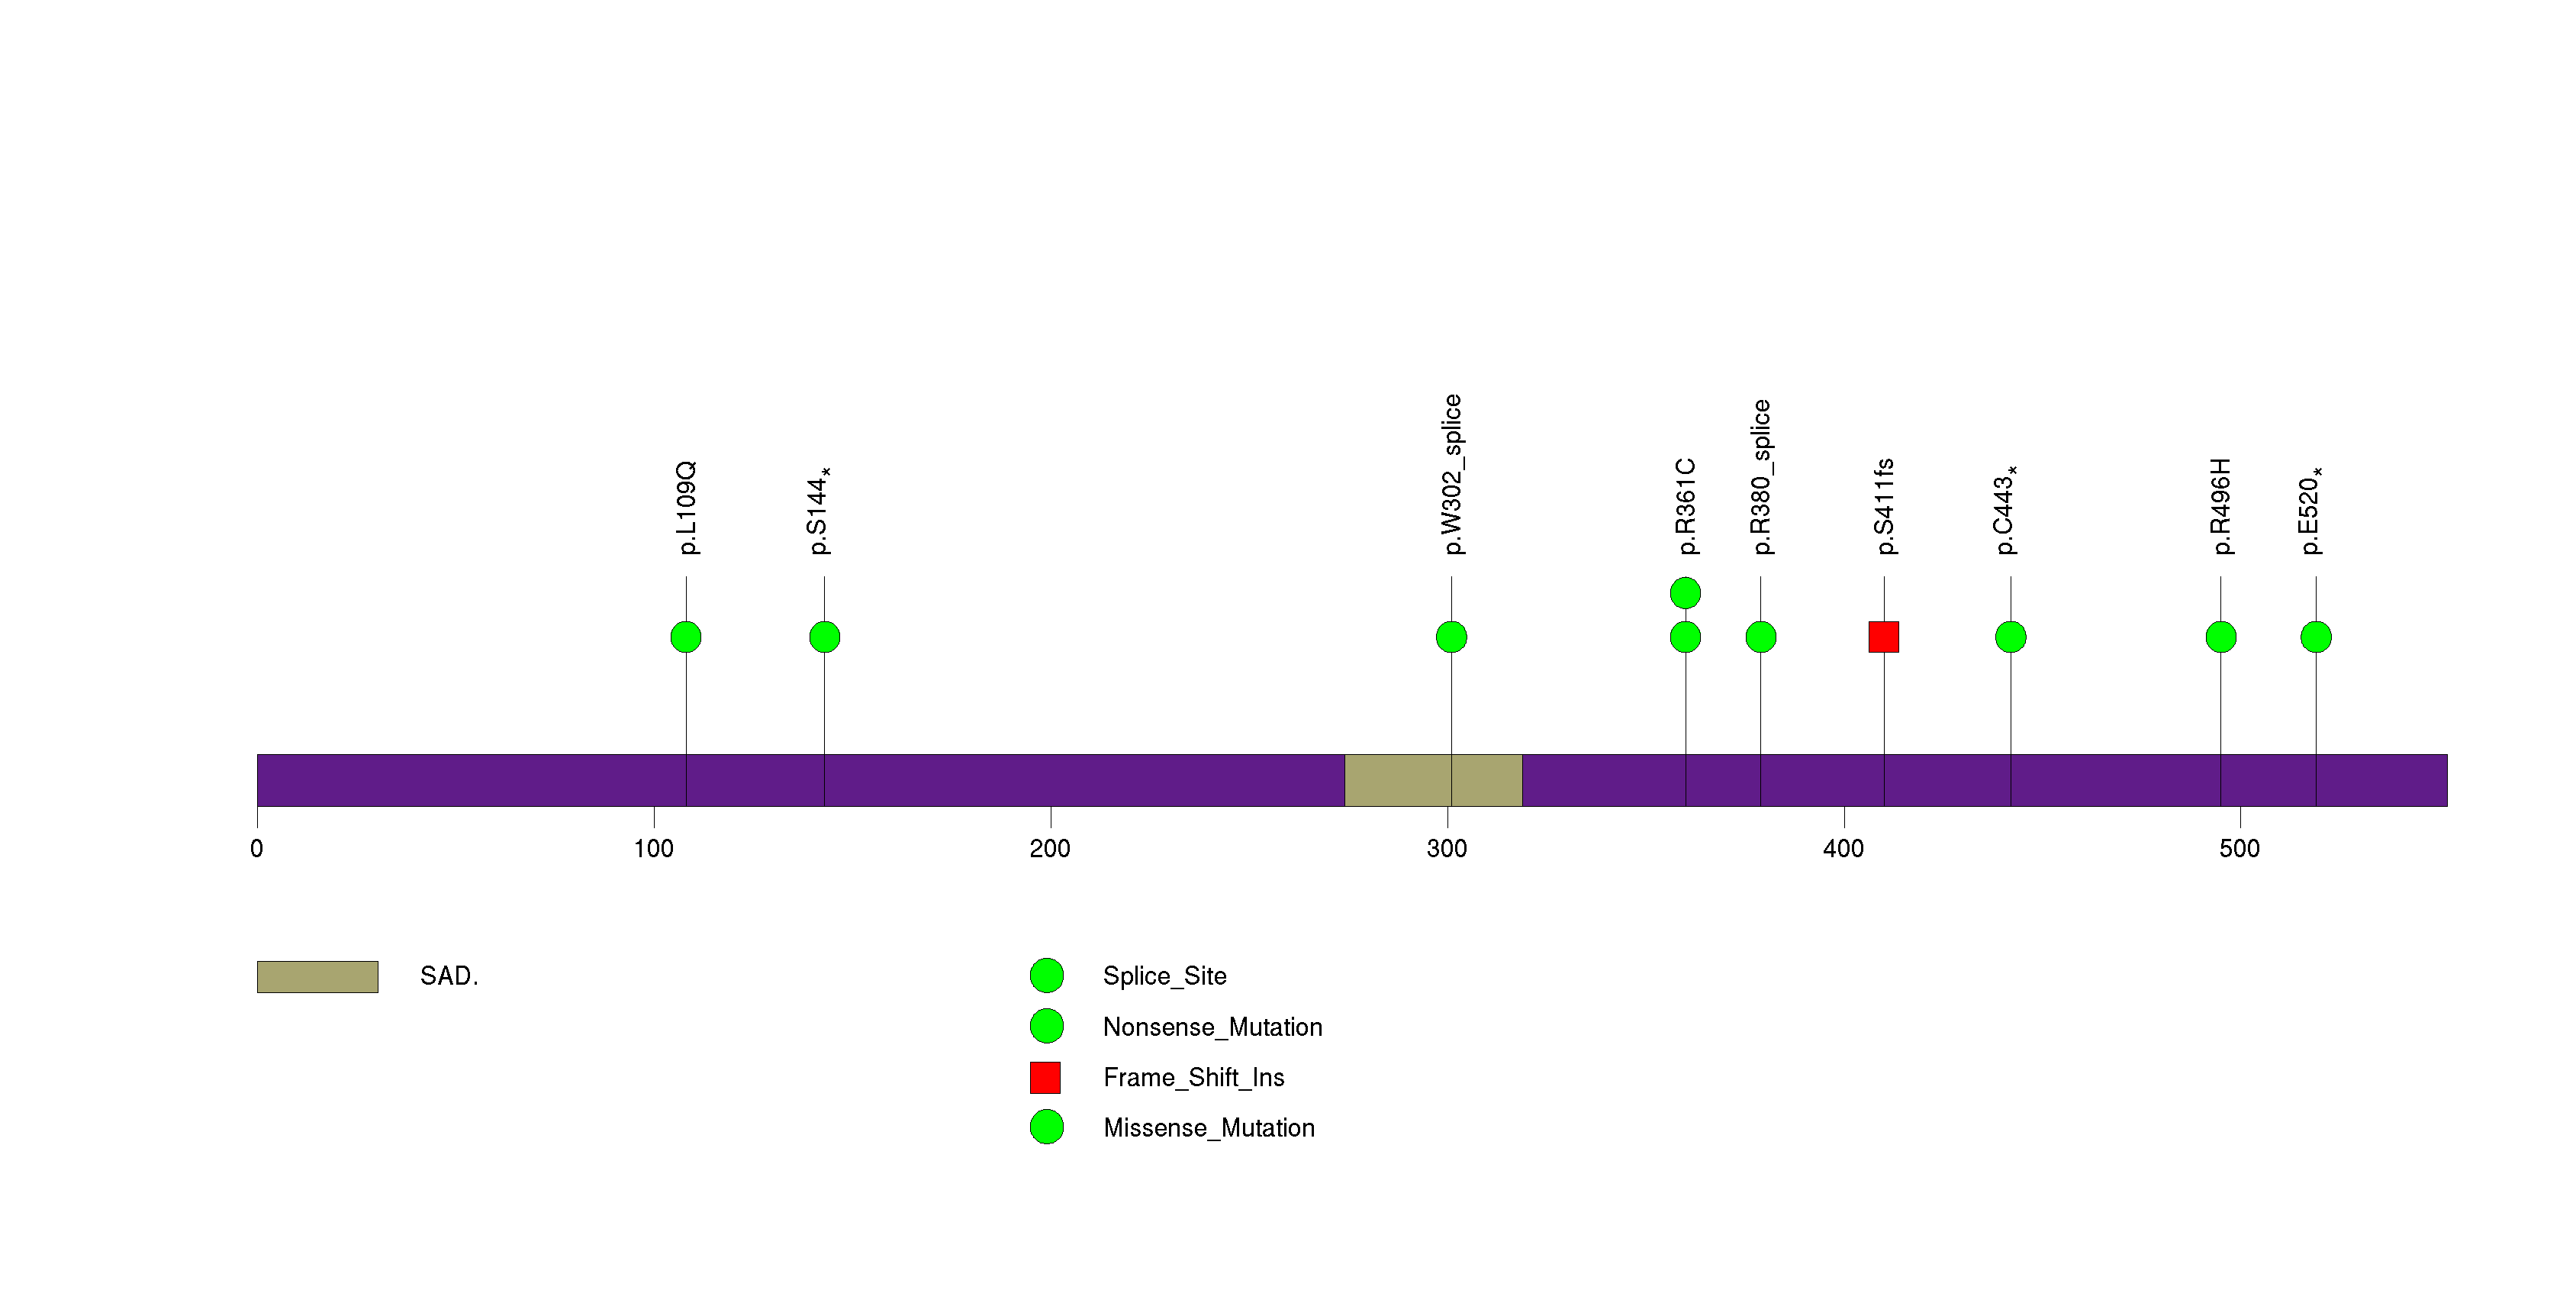
Table 3. Get Full Table A Ranked List of Significantly Mutated Genes. Number of significant genes found: 99. Number of genes displayed: 35. Click on a gene name to display its stick figure depicting the distribution of mutations and mutation types across the chosen gene (this feature may not be available for all significant genes).
| rank | gene | description | N | n | npat | nsite | nsil | n1 | n2 | n3 | n4 | n5 | n6 | p_clust | p_cons | p_joint | p_cv | p | q |
|---|---|---|---|---|---|---|---|---|---|---|---|---|---|---|---|---|---|---|---|
| 1 | C15orf24 | chromosome 15 open reading frame 24 | 42615 | 6 | 6 | 1 | 0 | 0 | 0 | 0 | 0 | 6 | 0 | 0 | 1 | 0 | 5.5e-08 | 0 | 0 |
| 2 | IRS1 | insulin receptor substrate 1 | 212717 | 5 | 5 | 1 | 1 | 0 | 0 | 0 | 0 | 5 | 0 | 0 | 0.96 | 0 | 0.011 | 0 | 0 |
| 3 | FYN | FYN oncogene related to SRC, FGR, YES | 103624 | 5 | 5 | 1 | 0 | 0 | 0 | 0 | 0 | 5 | 0 | 0 | 0.87 | 0 | 0.000019 | 0 | 0 |
| 4 | FADS2 | fatty acid desaturase 2 | 76230 | 5 | 5 | 1 | 0 | 0 | 0 | 0 | 0 | 5 | 0 | 0 | 0.013 | 0 | 0.000027 | 0 | 0 |
| 5 | C14orf49 | chromosome 14 open reading frame 49 | 162141 | 9 | 9 | 1 | 1 | 0 | 0 | 0 | 0 | 9 | 0 | 0 | 0.98 | 0 | 3.4e-11 | 0 | 0 |
| 6 | INTS10 | integrator complex subunit 10 | 124543 | 2 | 1 | 2 | 1 | 0 | 0 | 0 | 1 | 0 | 1 | 0.4 | 0 | 0 | 0.78 | 0 | 0 |
| 7 | FGF10 | fibroblast growth factor 10 | 36330 | 6 | 6 | 1 | 0 | 0 | 0 | 0 | 0 | 6 | 0 | 0 | 1 | 0 | 5.1e-07 | 0 | 0 |
| 8 | CEL | carboxyl ester lipase (bile salt-stimulated lipase) | 103583 | 4 | 4 | 1 | 2 | 0 | 0 | 0 | 0 | 4 | 0 | 1.2e-06 | 0.000042 | 0 | 0.00056 | 0 | 0 |
| 9 | CCR3 | chemokine (C-C motif) receptor 3 | 61695 | 5 | 5 | 1 | 0 | 0 | 0 | 0 | 0 | 4 | 1 | 0 | 0.75 | 0 | 3.1e-06 | 0 | 0 |
| 10 | OR10A2 | olfactory receptor, family 10, subfamily A, member 2 | 52212 | 6 | 6 | 1 | 0 | 0 | 0 | 0 | 0 | 6 | 0 | 0 | 0.0066 | 0 | 1.9e-08 | 0 | 0 |
| 11 | OR10A7 | olfactory receptor, family 10, subfamily A, member 7 | 54378 | 9 | 9 | 1 | 0 | 0 | 0 | 0 | 0 | 9 | 0 | 0 | 0.92 | 0 | 2.9e-14 | 0 | 0 |
| 12 | POP5 | processing of precursor 5, ribonuclease P/MRP subunit (S. cerevisiae) | 29146 | 5 | 5 | 1 | 0 | 0 | 0 | 0 | 0 | 5 | 0 | 0 | 0.72 | 0 | 4e-08 | 0 | 0 |
| 13 | SRP14 | signal recognition particle 14kDa (homologous Alu RNA binding protein) | 24486 | 7 | 7 | 1 | 0 | 0 | 0 | 0 | 0 | 7 | 0 | 0 | 1 | 0 | 9.4e-11 | 0 | 0 |
| 14 | WRN | Werner syndrome | 250953 | 5 | 5 | 1 | 0 | 0 | 0 | 0 | 0 | 5 | 0 | 0 | 0.64 | 0 | 0.35 | 0 | 0 |
| 15 | TMEM40 | transmembrane protein 40 | 40250 | 9 | 9 | 2 | 0 | 0 | 0 | 0 | 0 | 9 | 0 | 0 | 0.56 | 0 | 8.4e-15 | 0 | 0 |
| 16 | KRAS | v-Ki-ras2 Kirsten rat sarcoma viral oncogene homolog | 39758 | 33 | 33 | 4 | 0 | 0 | 14 | 15 | 4 | 0 | 0 | 0 | 0.0024 | 0 | 5.4e-08 | 0 | 0 |
| 17 | TP53 | tumor protein p53 | 71159 | 37 | 37 | 33 | 0 | 9 | 1 | 7 | 7 | 13 | 0 | 1.2e-06 | 0.00033 | 0 | 3.3e-15 | 0 | 0 |
| 18 | QRICH1 | glutamine-rich 1 | 134916 | 7 | 7 | 2 | 1 | 1 | 0 | 0 | 0 | 6 | 0 | 3.6e-06 | 0.012 | 0 | 0.000021 | 0 | 0 |
| 19 | ST6GALNAC5 | ST6 (alpha-N-acetyl-neuraminyl-2,3-beta-galactosyl-1,3)-N-acetylgalactosaminide alpha-2,6-sialyltransferase 5 | 54579 | 6 | 6 | 1 | 0 | 0 | 0 | 0 | 0 | 6 | 0 | 0 | 0.14 | 0 | 2.4e-08 | 0 | 0 |
| 20 | TNFSF9 | tumor necrosis factor (ligand) superfamily, member 9 | 34191 | 6 | 6 | 1 | 1 | 0 | 0 | 0 | 0 | 6 | 0 | 0 | 0.61 | 0 | 7.2e-10 | 0 | 0 |
| 21 | CDKN2A | cyclin-dependent kinase inhibitor 2A (melanoma, p16, inhibits CDK4) | 56371 | 13 | 13 | 11 | 0 | 0 | 1 | 1 | 0 | 11 | 0 | 0.0056 | 0.0041 | 0.0014 | 2.8e-13 | 1.5e-14 | 1.3e-11 |
| 22 | SEH1L | SEH1-like (S. cerevisiae) | 74814 | 8 | 8 | 2 | 0 | 0 | 0 | 0 | 0 | 8 | 0 | 8.2e-06 | 0.98 | 0.000048 | 9.1e-11 | 1.5e-13 | 1.2e-10 |
| 23 | SCD | stearoyl-CoA desaturase (delta-9-desaturase) | 62889 | 8 | 8 | 2 | 0 | 0 | 0 | 0 | 0 | 8 | 0 | 8.8e-06 | 0.94 | 0.000057 | 1.5e-10 | 2.9e-13 | 2.3e-10 |
| 24 | TMC4 | transmembrane channel-like 4 | 112036 | 9 | 9 | 2 | 0 | 0 | 0 | 0 | 1 | 8 | 0 | 1.6e-06 | 0.24 | 6.6e-06 | 5.9e-09 | 1.2e-12 | 9.3e-10 |
| 25 | MED15 | mediator complex subunit 15 | 137354 | 11 | 9 | 5 | 0 | 0 | 0 | 1 | 1 | 9 | 0 | 0.000031 | 0.77 | 0.0001 | 6e-10 | 2e-12 | 1.4e-09 |
| 26 | TNFRSF9 | tumor necrosis factor receptor superfamily, member 9 | 45333 | 7 | 6 | 4 | 0 | 0 | 0 | 0 | 0 | 7 | 0 | 0.021 | 0.0011 | 0.00075 | 2.1e-09 | 4.5e-11 | 3.2e-08 |
| 27 | BRDT | bromodomain, testis-specific | 165362 | 8 | 8 | 2 | 0 | 0 | 0 | 1 | 0 | 7 | 0 | 1e-05 | 0.25 | 0.000043 | 1.5e-07 | 1.7e-10 | 1.2e-07 |
| 28 | CXXC4 | CXXC finger 4 | 34485 | 6 | 6 | 1 | 0 | 0 | 0 | 0 | 0 | 6 | 0 | NaN | NaN | NaN | 3.4e-10 | 3.4e-10 | 2.2e-07 |
| 29 | MBD3 | methyl-CpG binding domain protein 3 | 50273 | 6 | 6 | 2 | 0 | 0 | 1 | 0 | 0 | 5 | 0 | 2.2e-06 | 0.99 | 9.6e-06 | 2e-06 | 4.9e-10 | 3.1e-07 |
| 30 | TULP1 | tubby like protein 1 | 84798 | 6 | 6 | 2 | 1 | 1 | 0 | 0 | 0 | 5 | 0 | 0.000085 | 0.97 | 0.0002 | 2e-07 | 9.9e-10 | 6e-07 |
| 31 | PHF13 | PHD finger protein 13 | 52336 | 4 | 4 | 1 | 0 | 0 | 0 | 0 | 0 | 4 | 0 | 8e-07 | 0.98 | 6e-06 | 8.2e-06 | 1.2e-09 | 7.1e-07 |
| 32 | BHLHB9 | basic helix-loop-helix domain containing, class B, 9 | 93837 | 5 | 5 | 2 | 0 | 1 | 0 | 0 | 0 | 4 | 0 | 1.4e-06 | 0.38 | 8e-06 | 0.000012 | 2.4e-09 | 1.4e-06 |
| 33 | PRDM8 | PR domain containing 8 | 73928 | 6 | 6 | 2 | 0 | 0 | 0 | 1 | 0 | 5 | 0 | 0.000051 | 1 | 0.00016 | 1e-06 | 4e-09 | 2.2e-06 |
| 34 | SMAD4 | SMAD family member 4 | 96994 | 10 | 10 | 9 | 0 | 3 | 0 | 0 | 1 | 6 | 0 | 0.3 | 0.36 | 0.48 | 1.9e-09 | 2e-08 | 0.000011 |
| 35 | C14orf43 | chromosome 14 open reading frame 43 | 179212 | 7 | 7 | 2 | 0 | 0 | 0 | 1 | 0 | 6 | 0 | 2.4e-06 | 0.57 | 0.000021 | 0.000047 | 2.1e-08 | 0.000011 |
Figure S1. This figure depicts the distribution of mutations and mutation types across the C15orf24 significant gene.
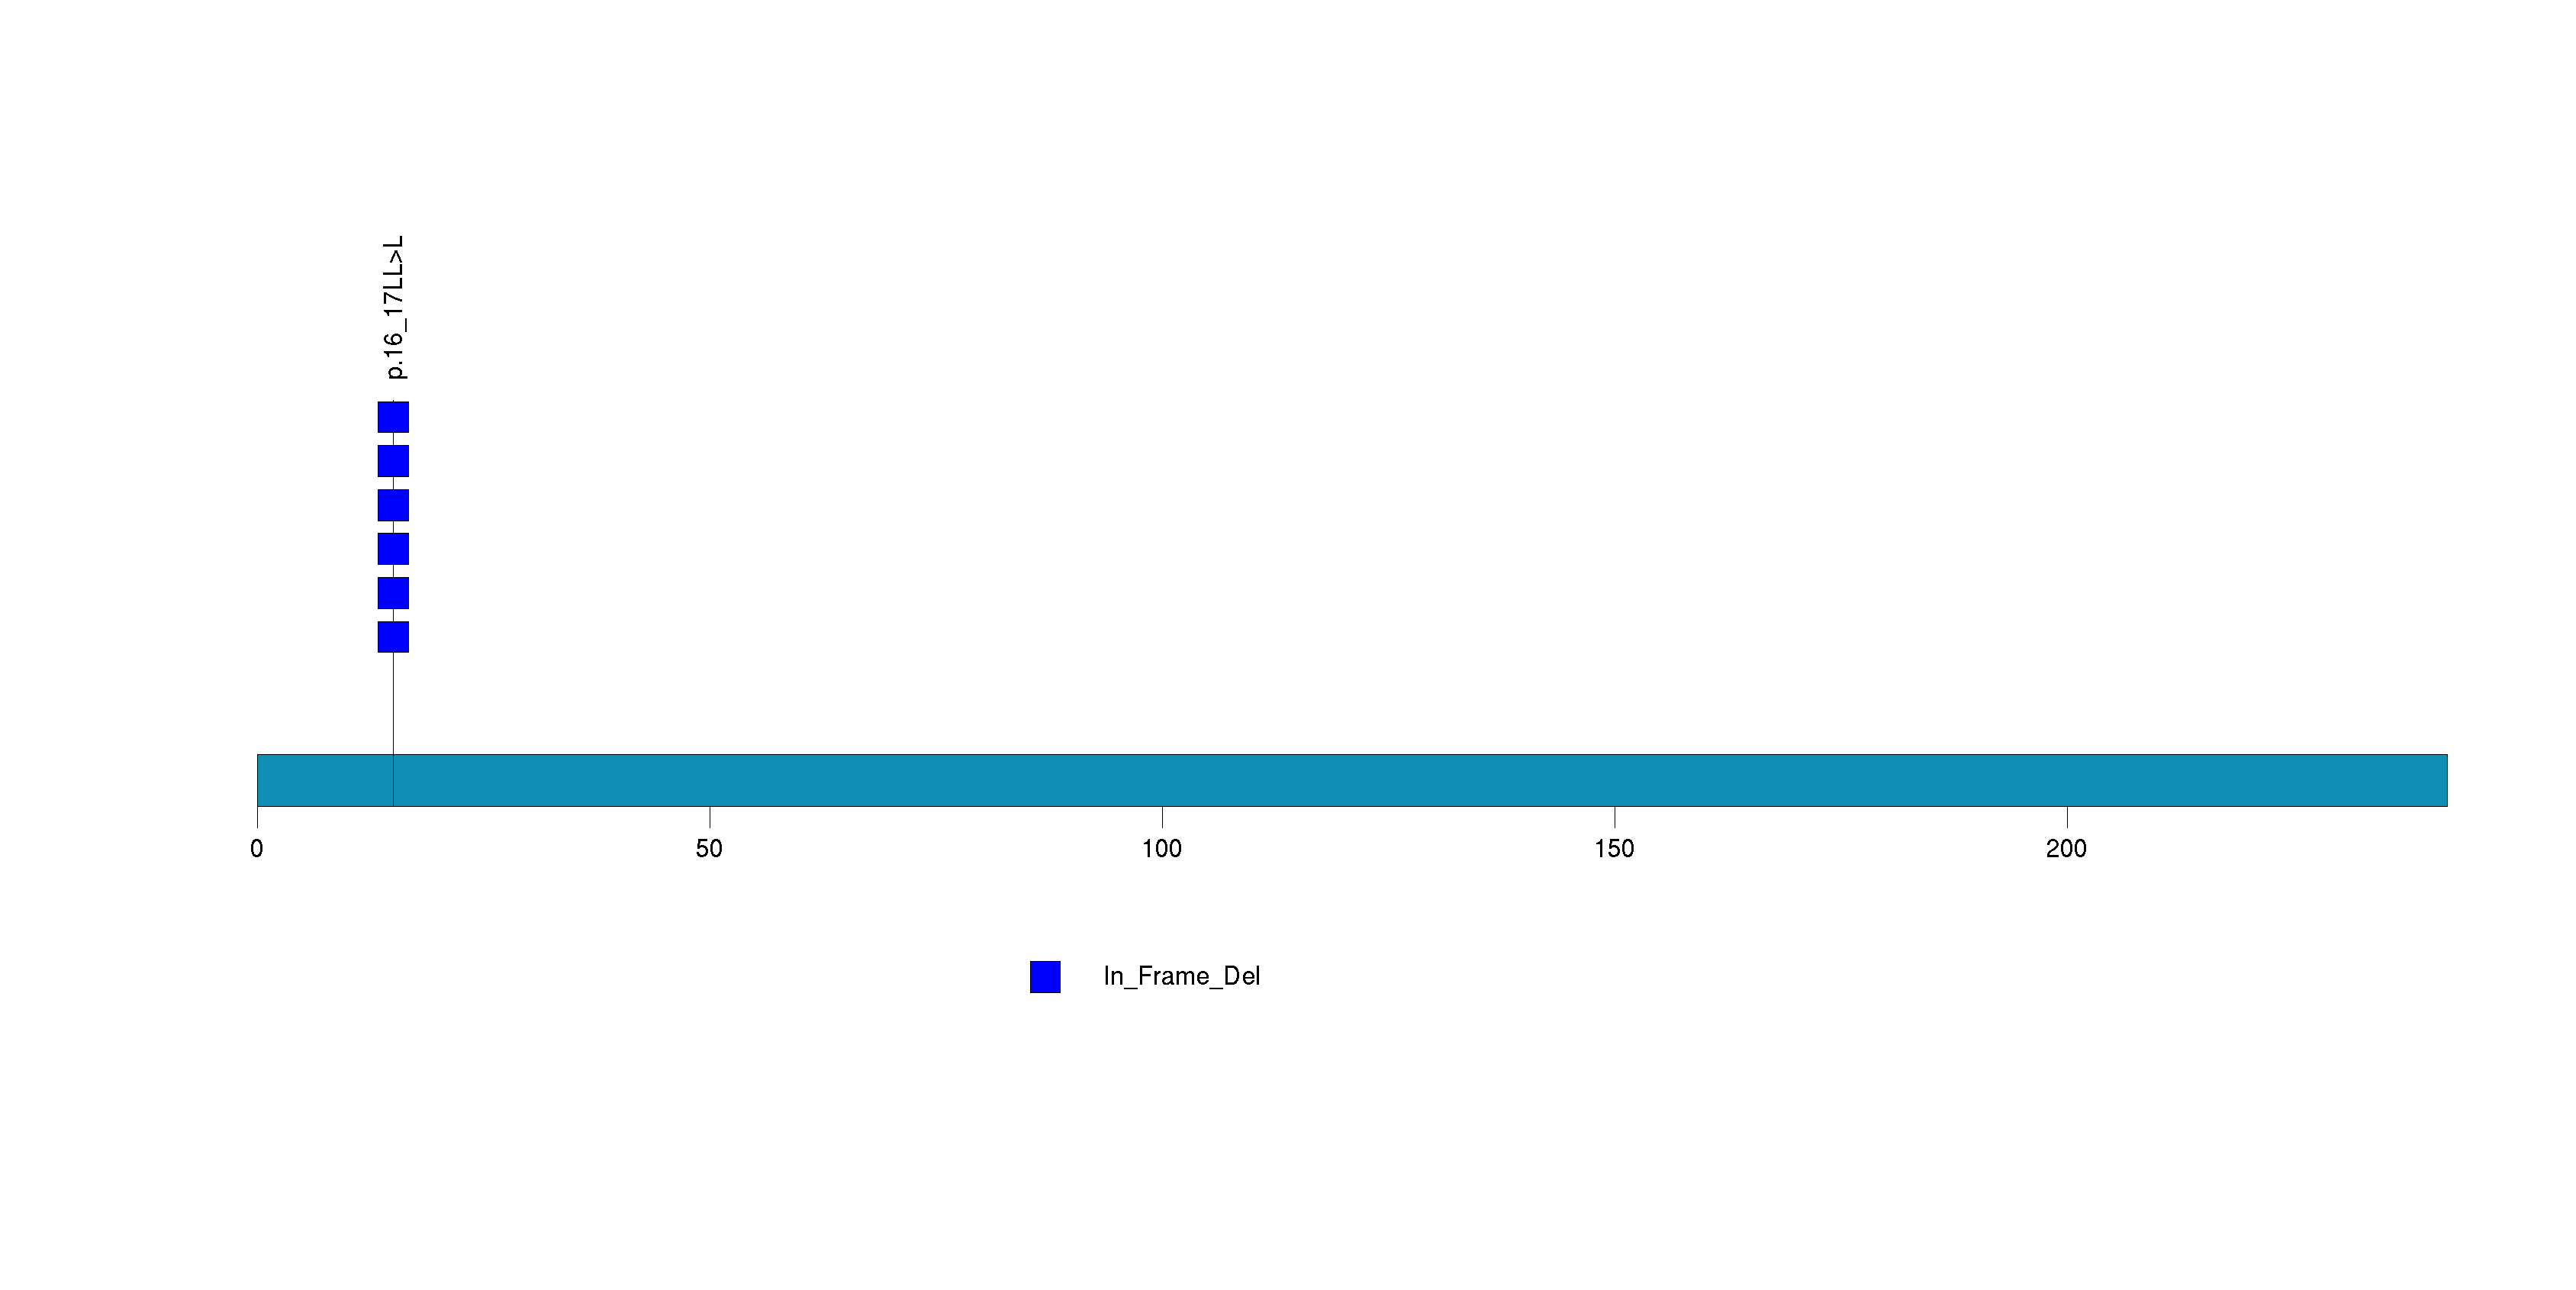
Figure S2. This figure depicts the distribution of mutations and mutation types across the IRS1 significant gene.
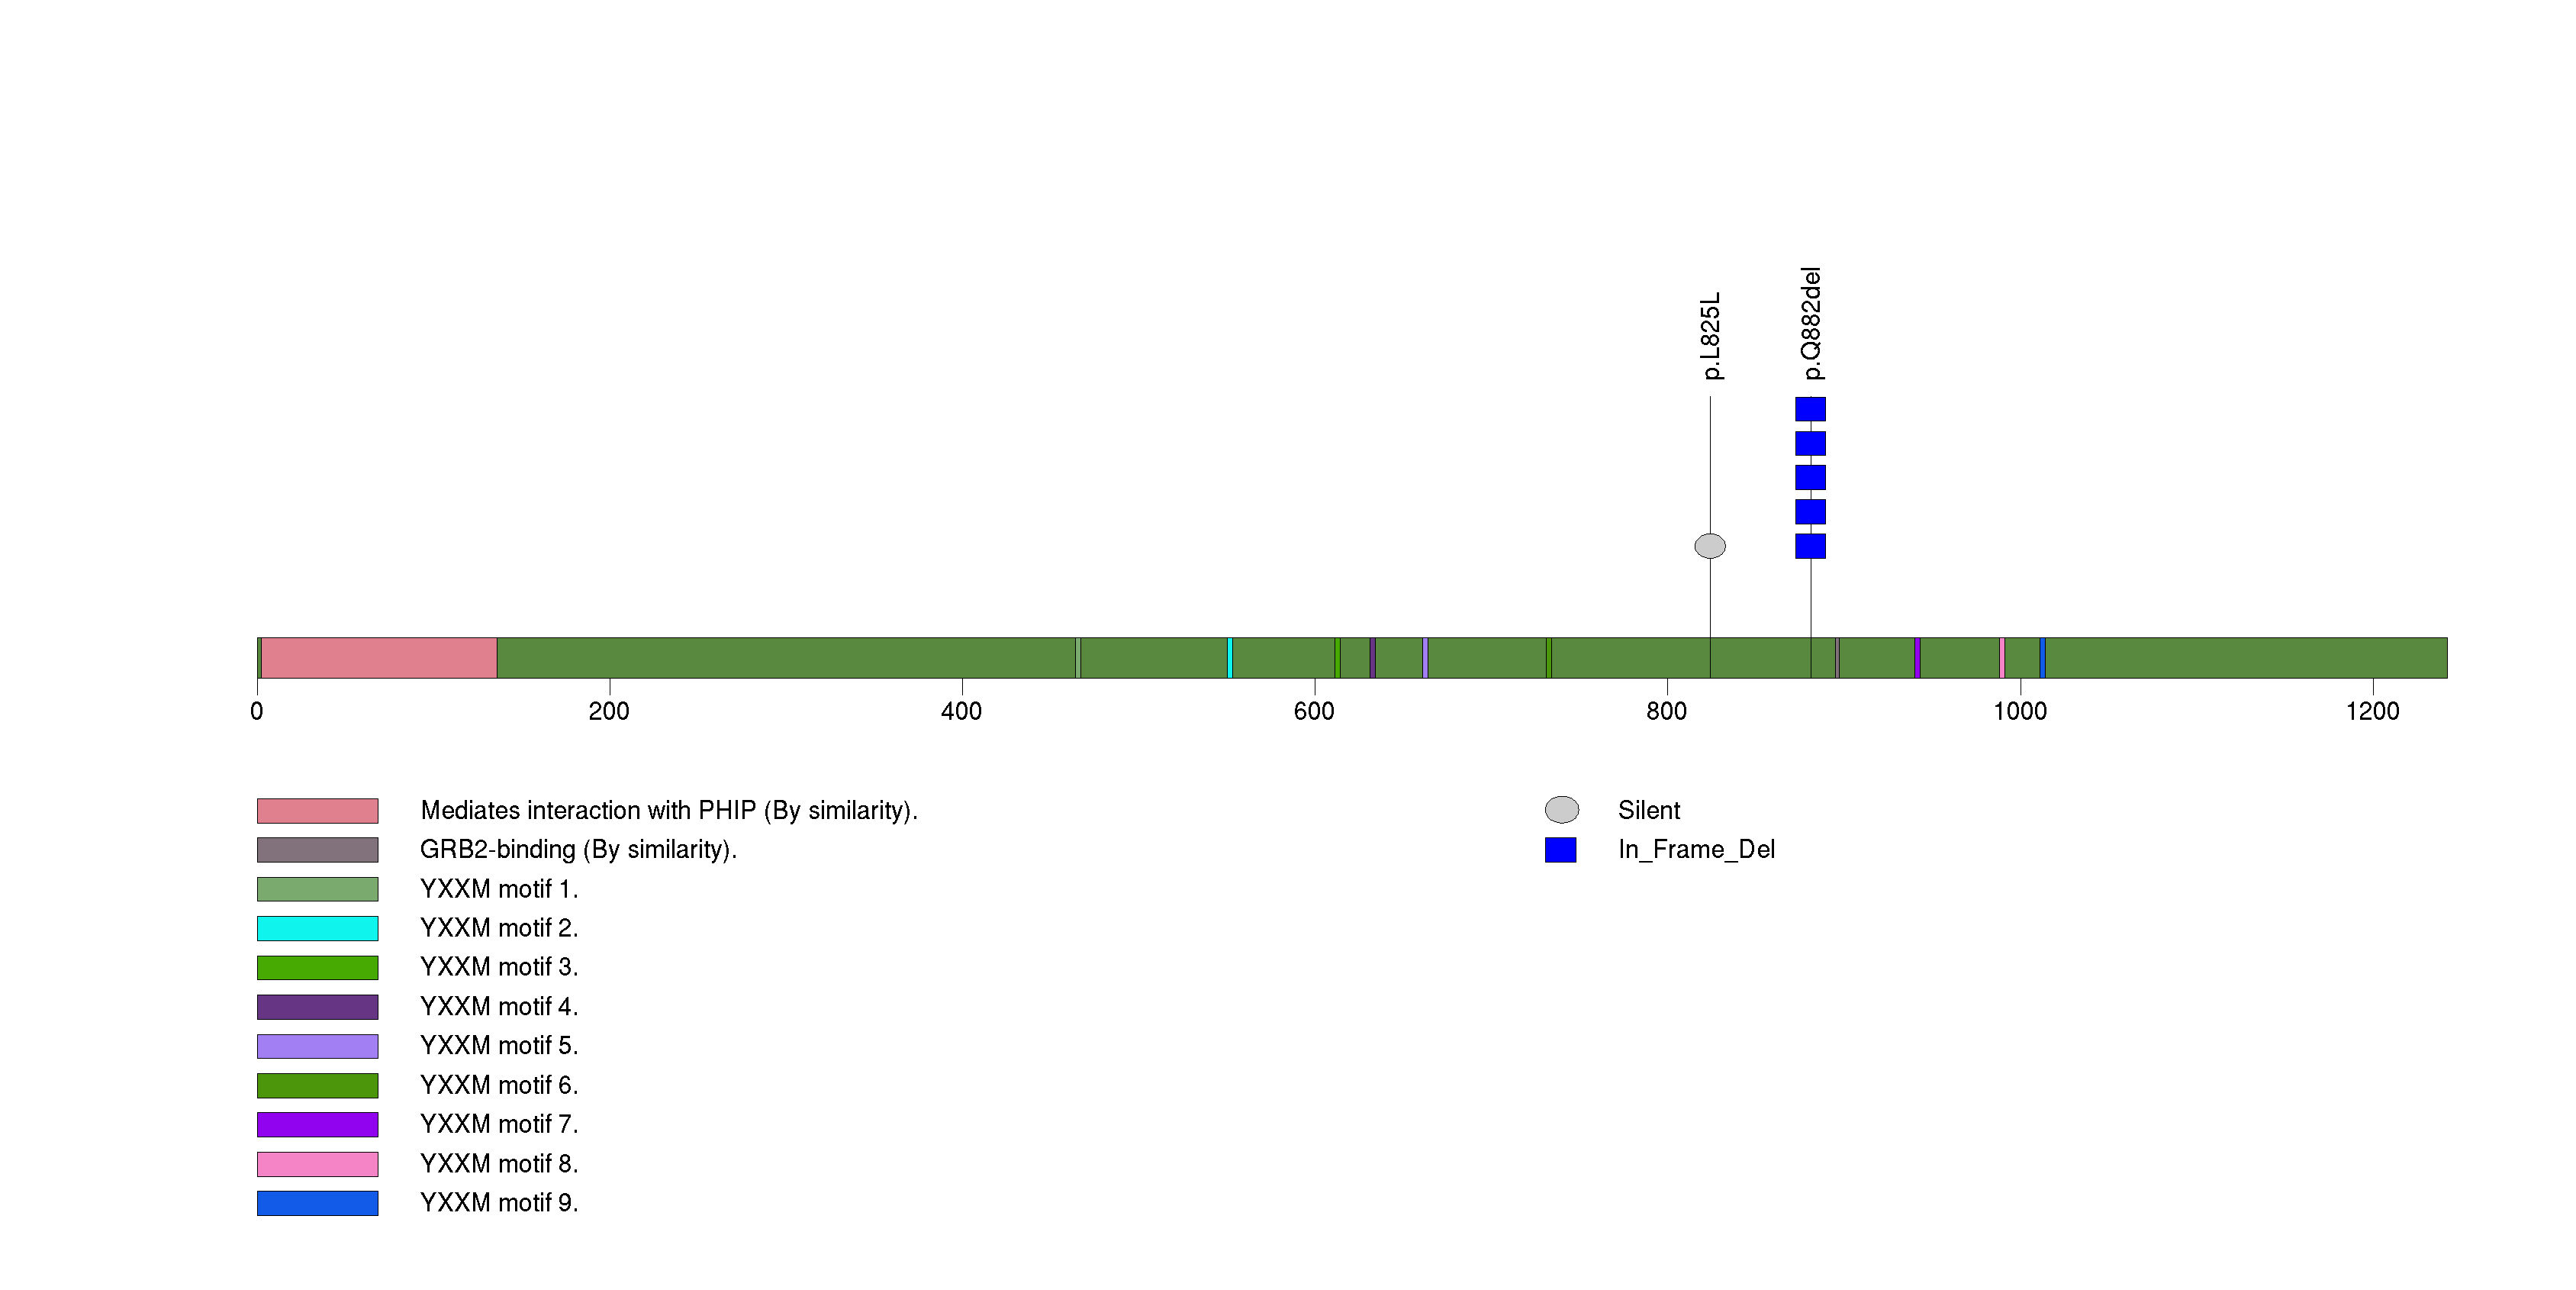
Figure S3. This figure depicts the distribution of mutations and mutation types across the FYN significant gene.
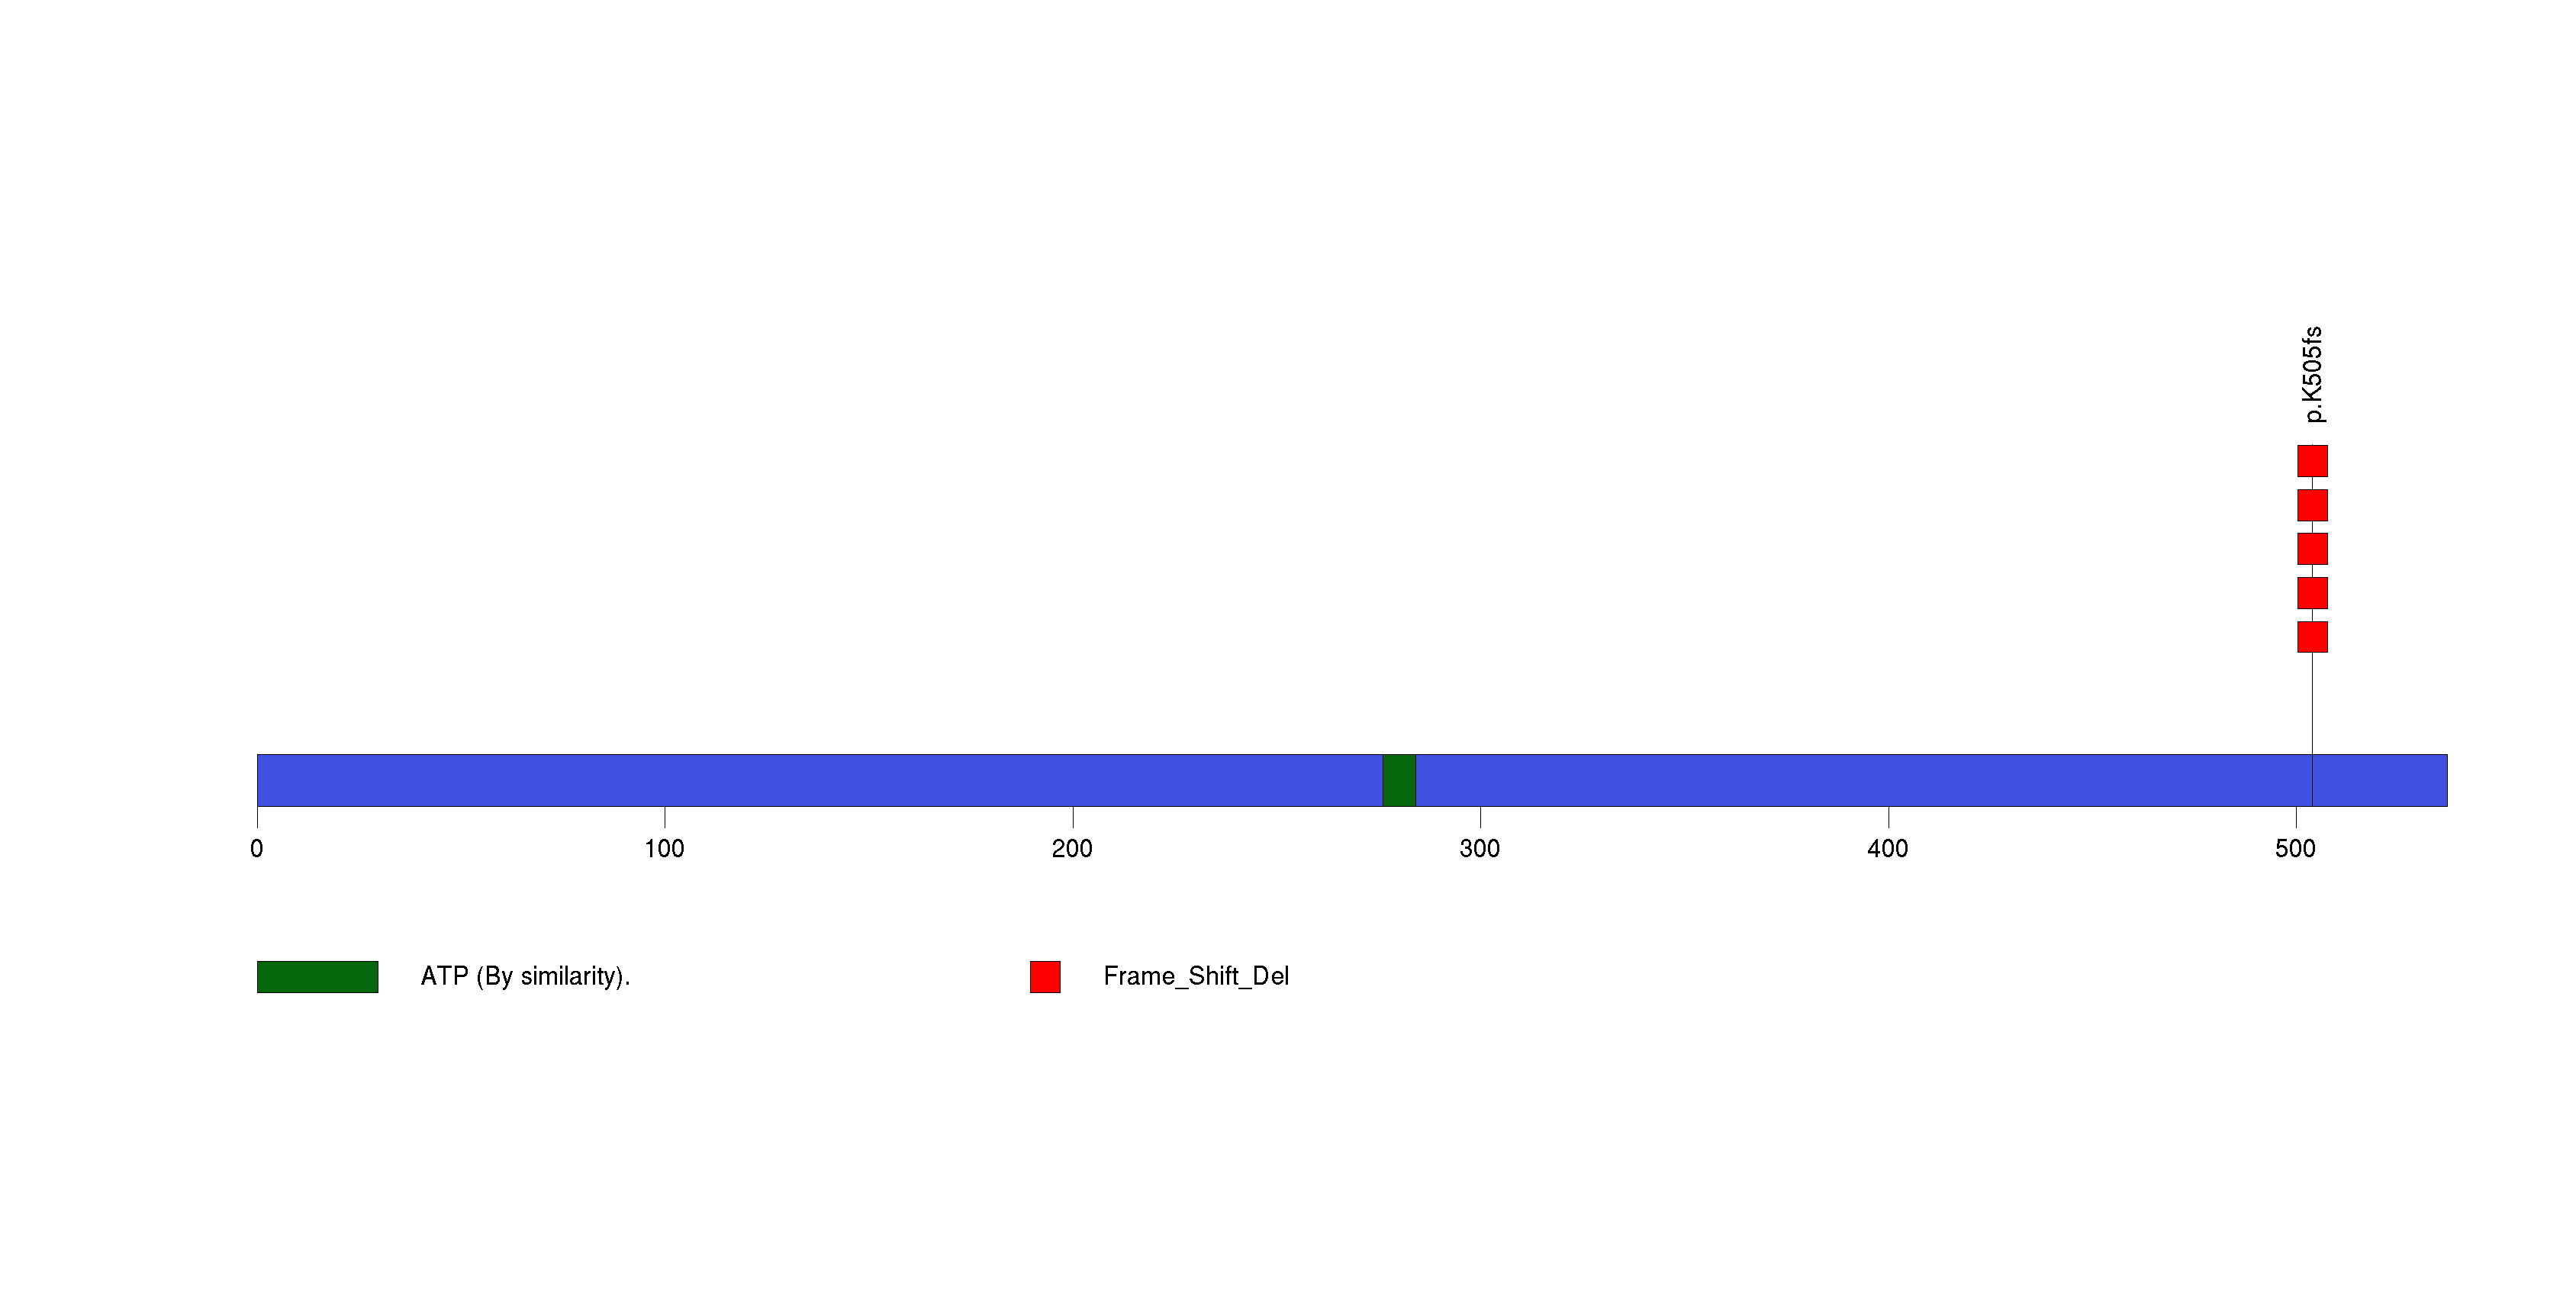
Figure S4. This figure depicts the distribution of mutations and mutation types across the FADS2 significant gene.
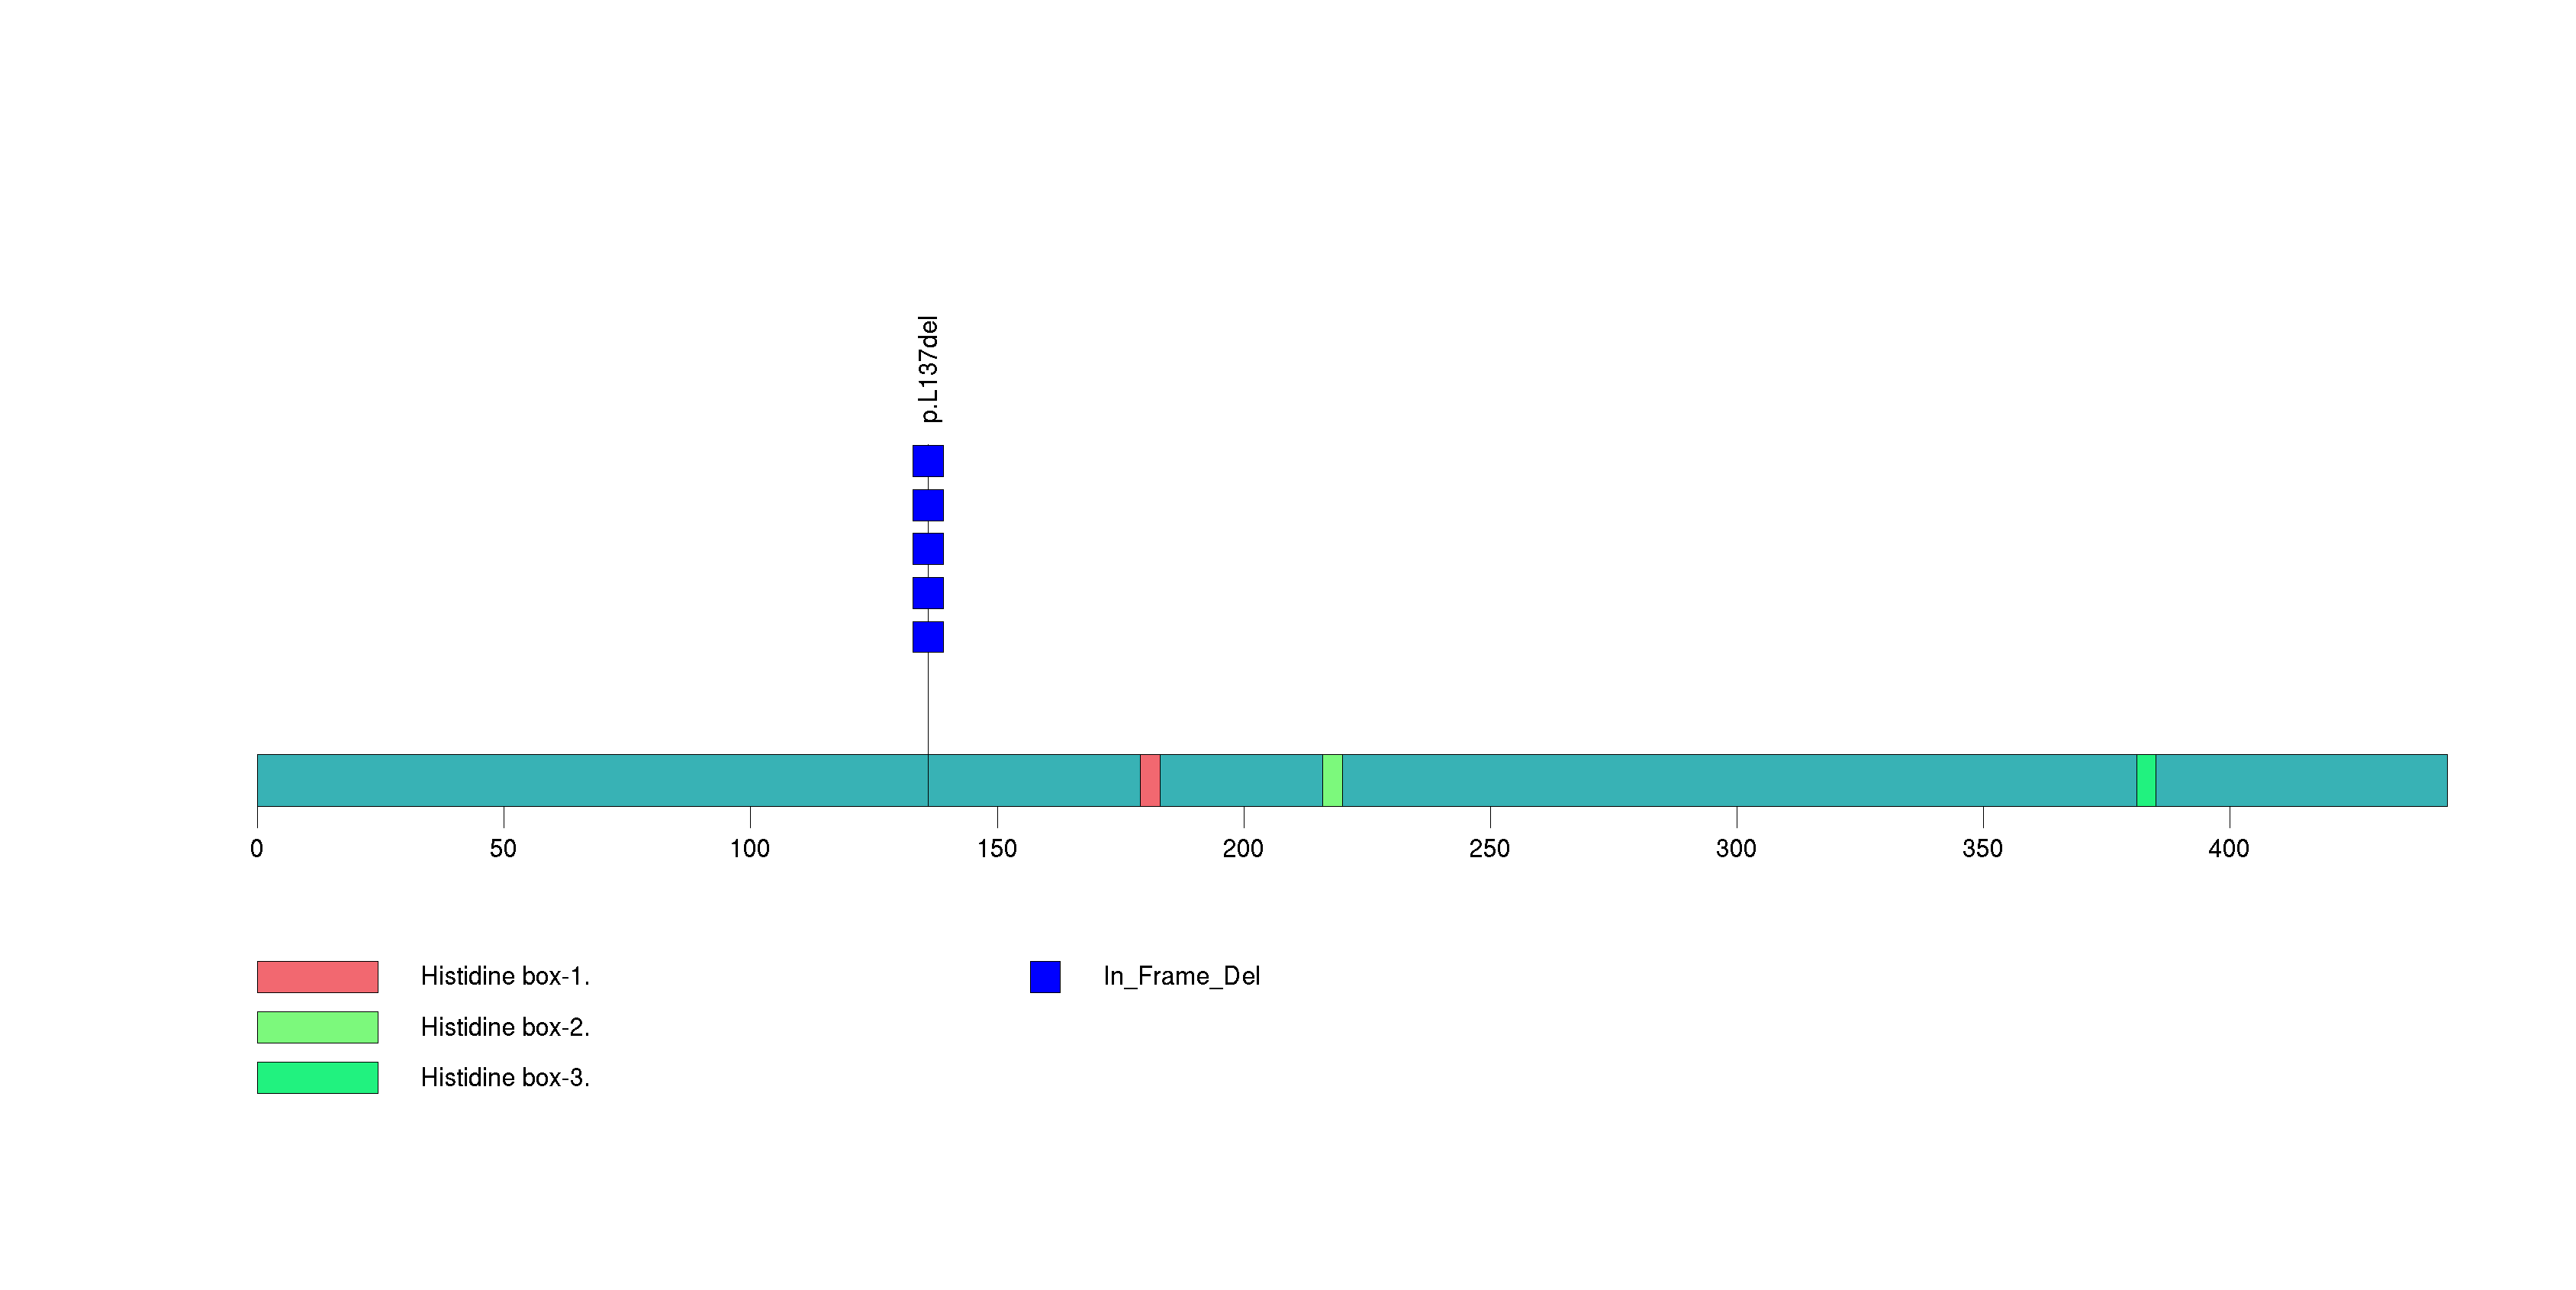
Figure S5. This figure depicts the distribution of mutations and mutation types across the C14orf49 significant gene.
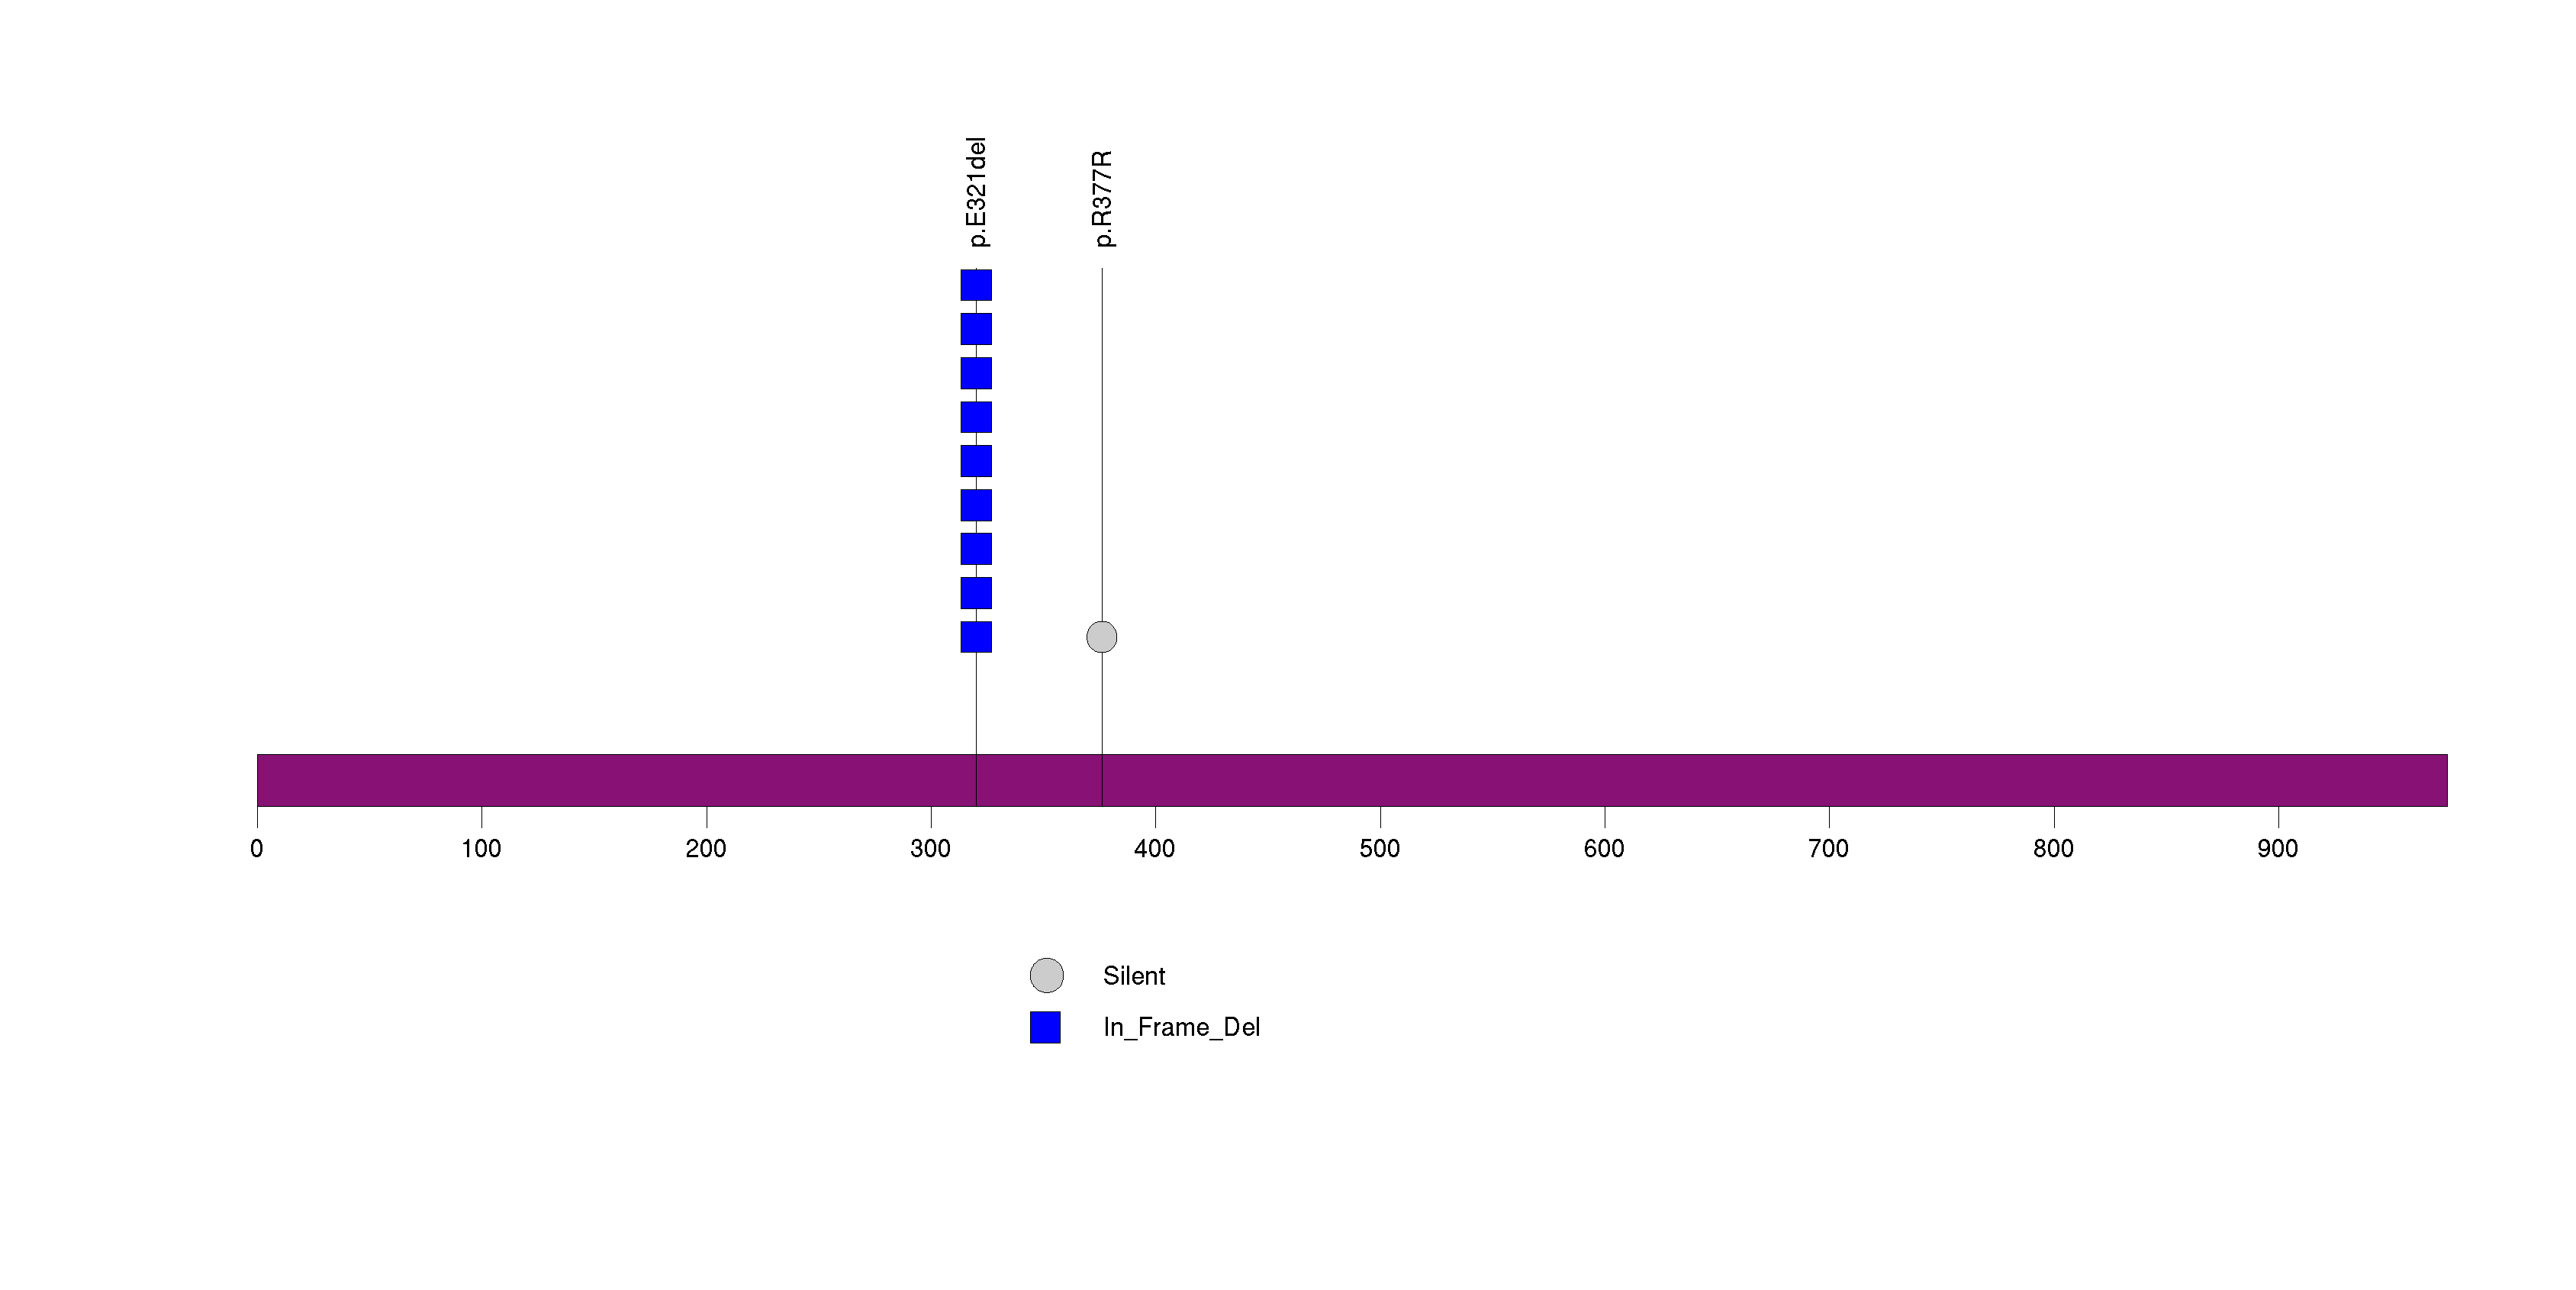
Figure S6. This figure depicts the distribution of mutations and mutation types across the INTS10 significant gene.
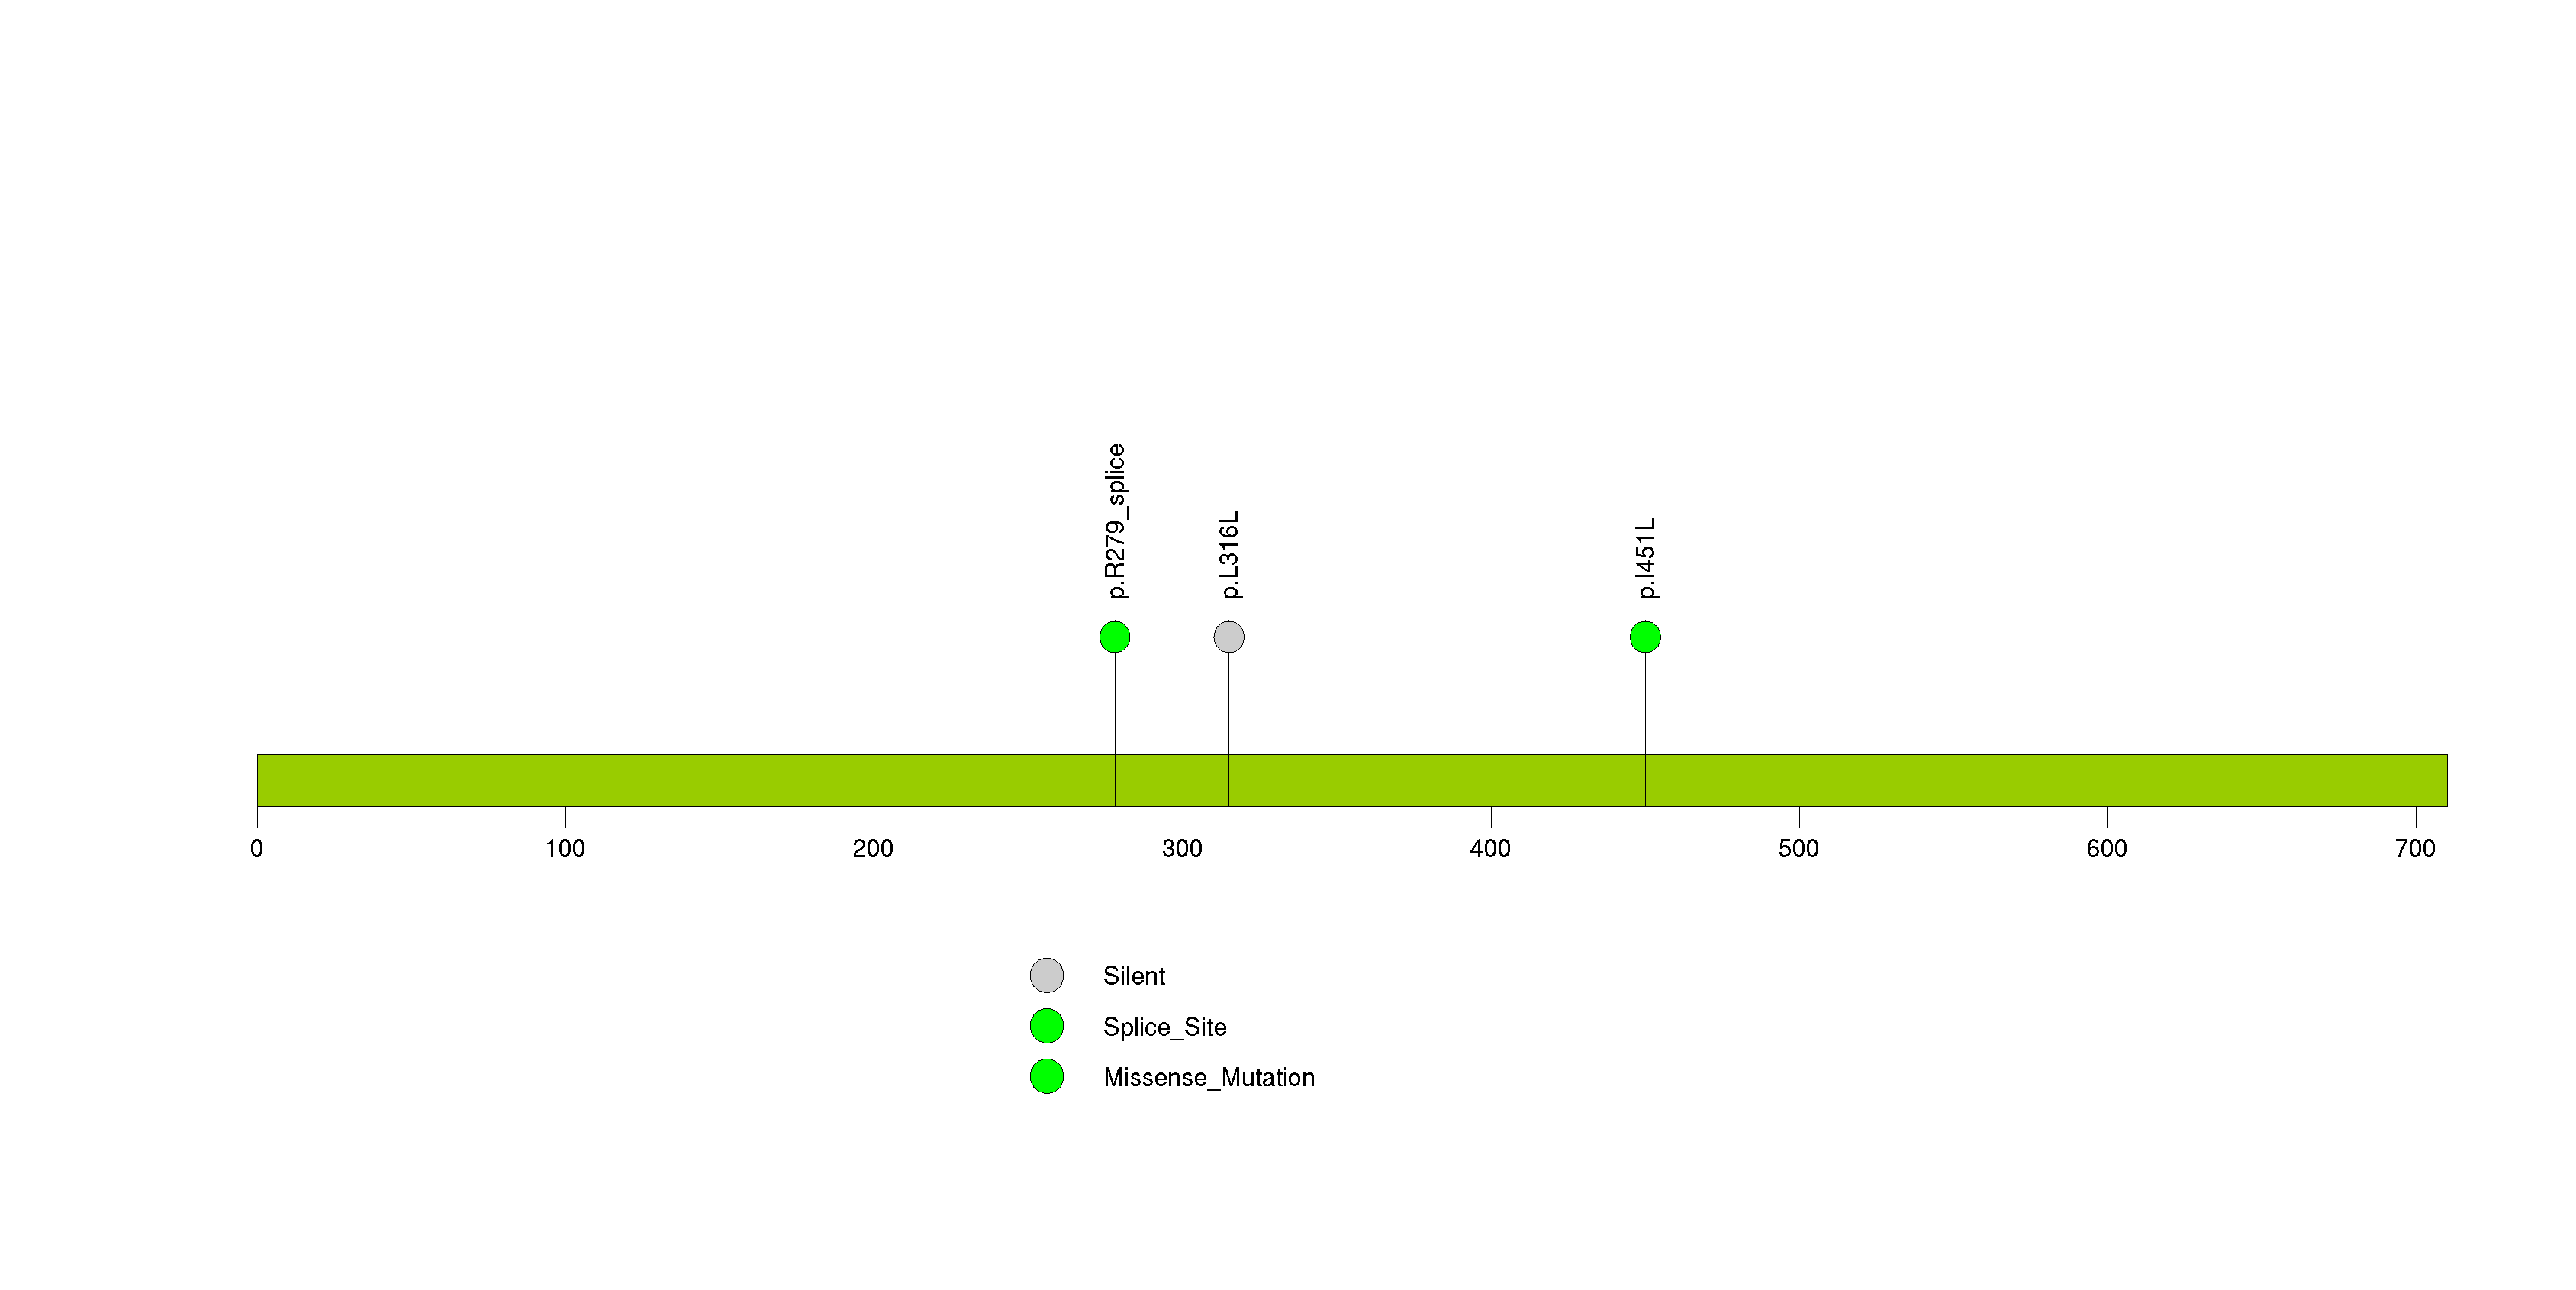
Figure S7. This figure depicts the distribution of mutations and mutation types across the FGF10 significant gene.
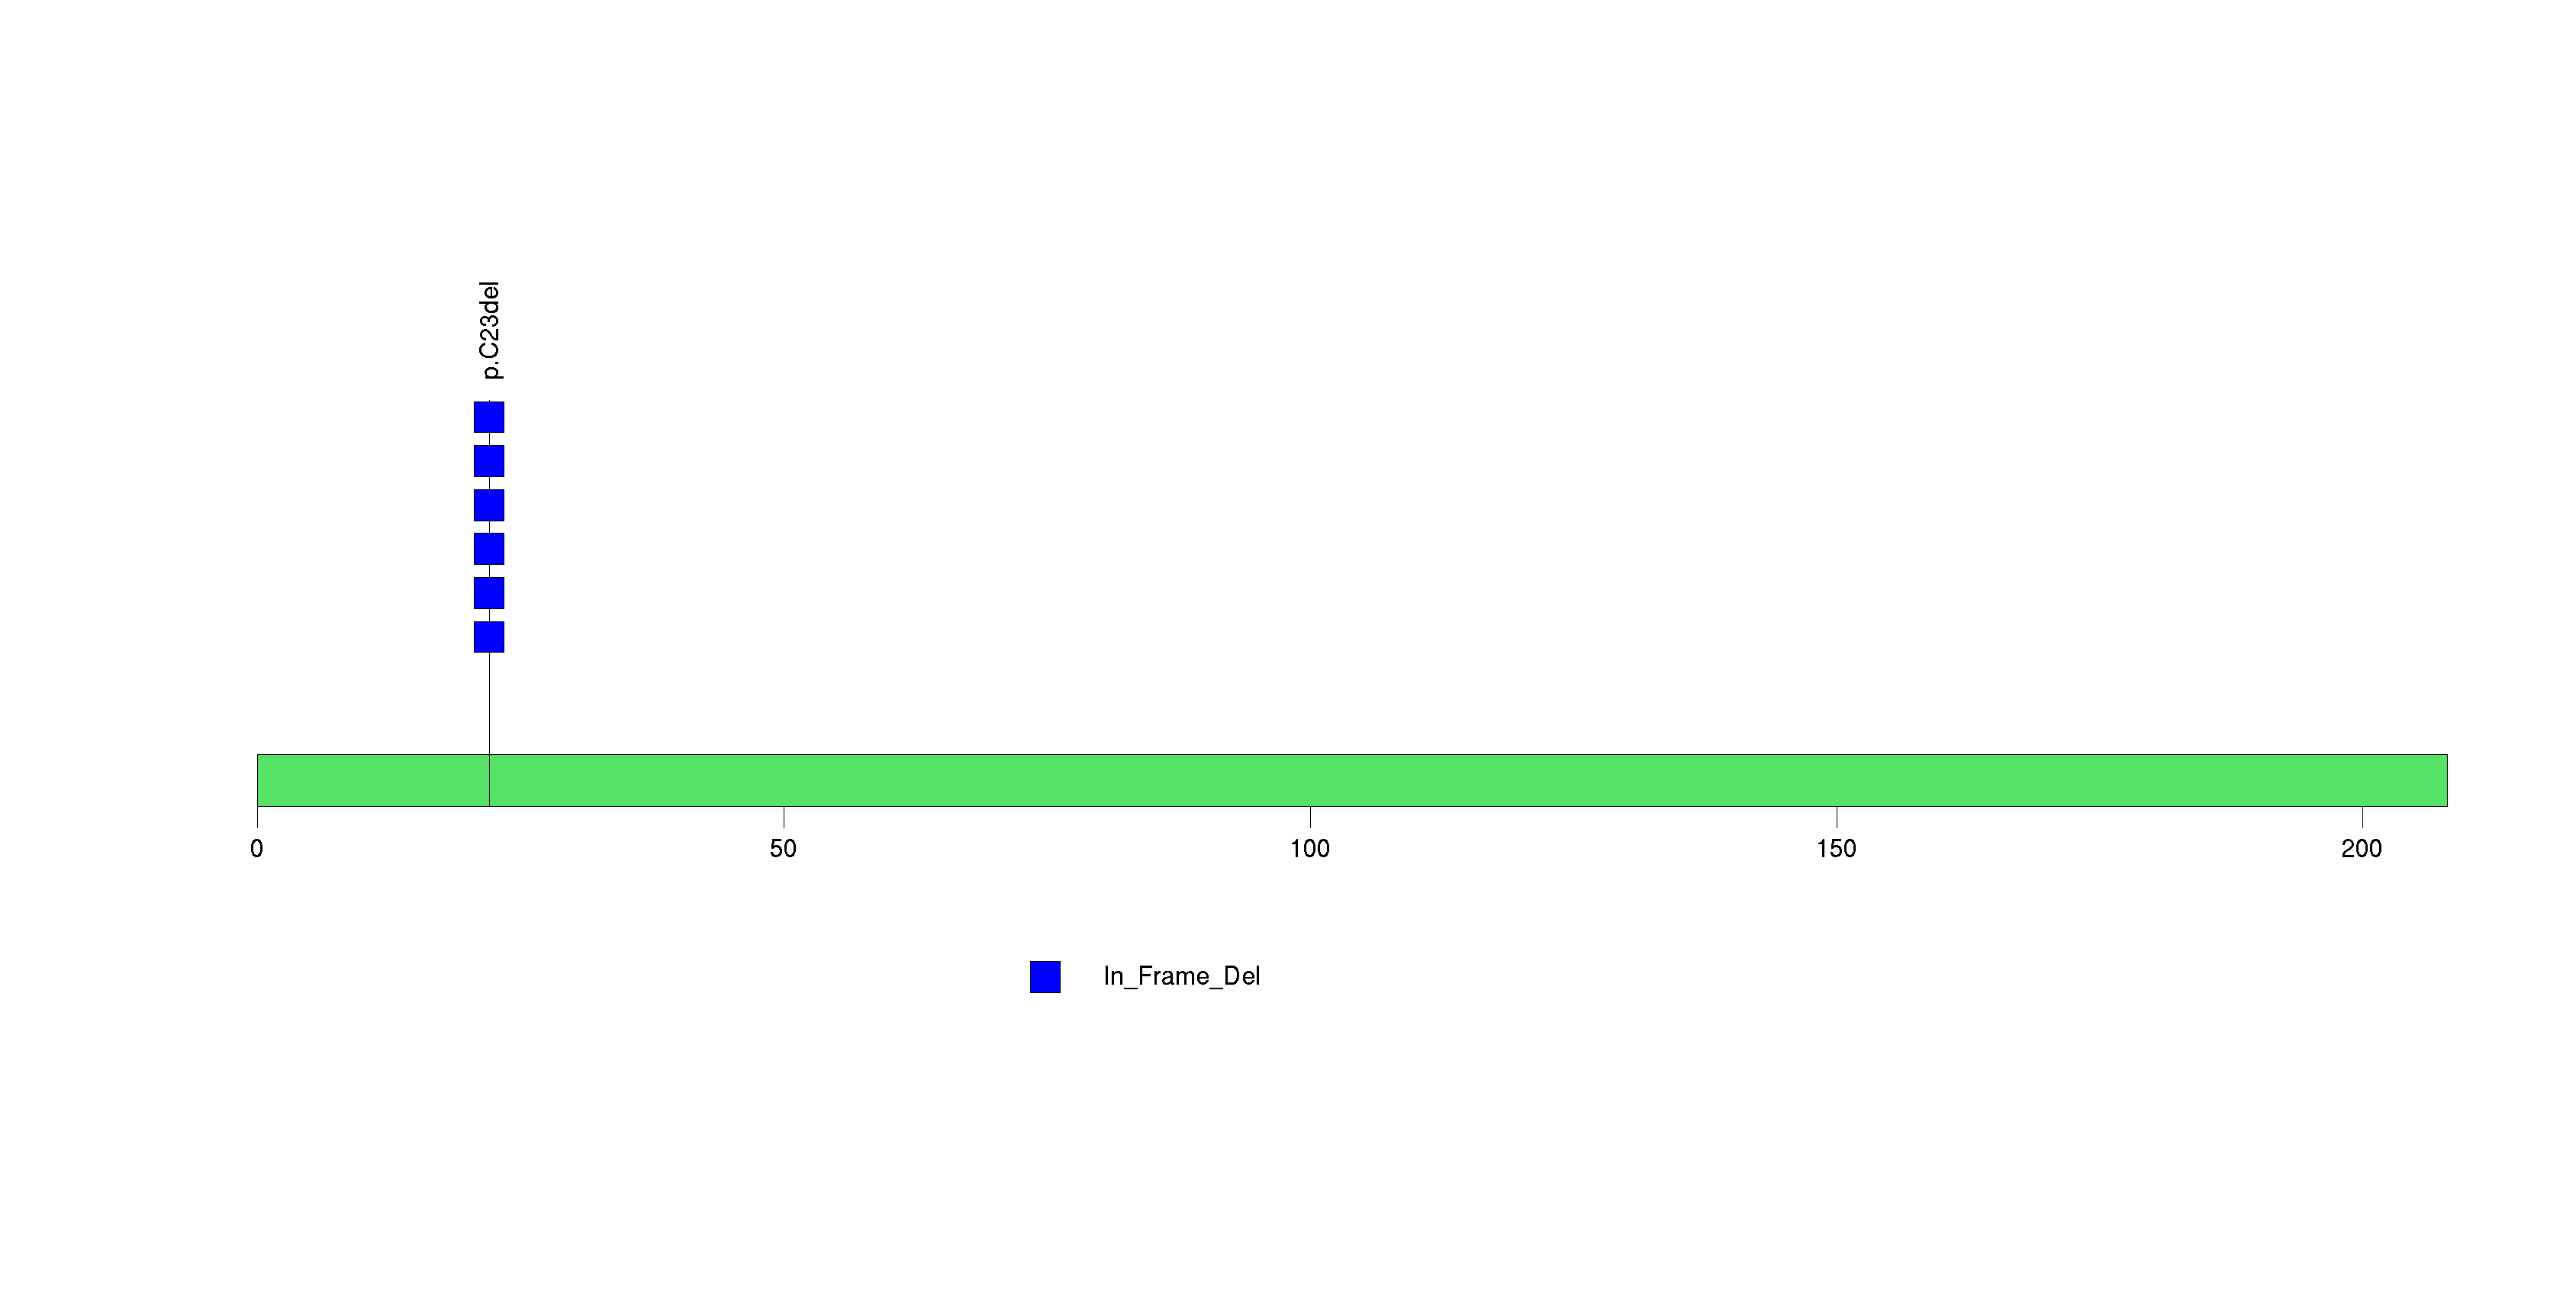
Figure S8. This figure depicts the distribution of mutations and mutation types across the CEL significant gene.
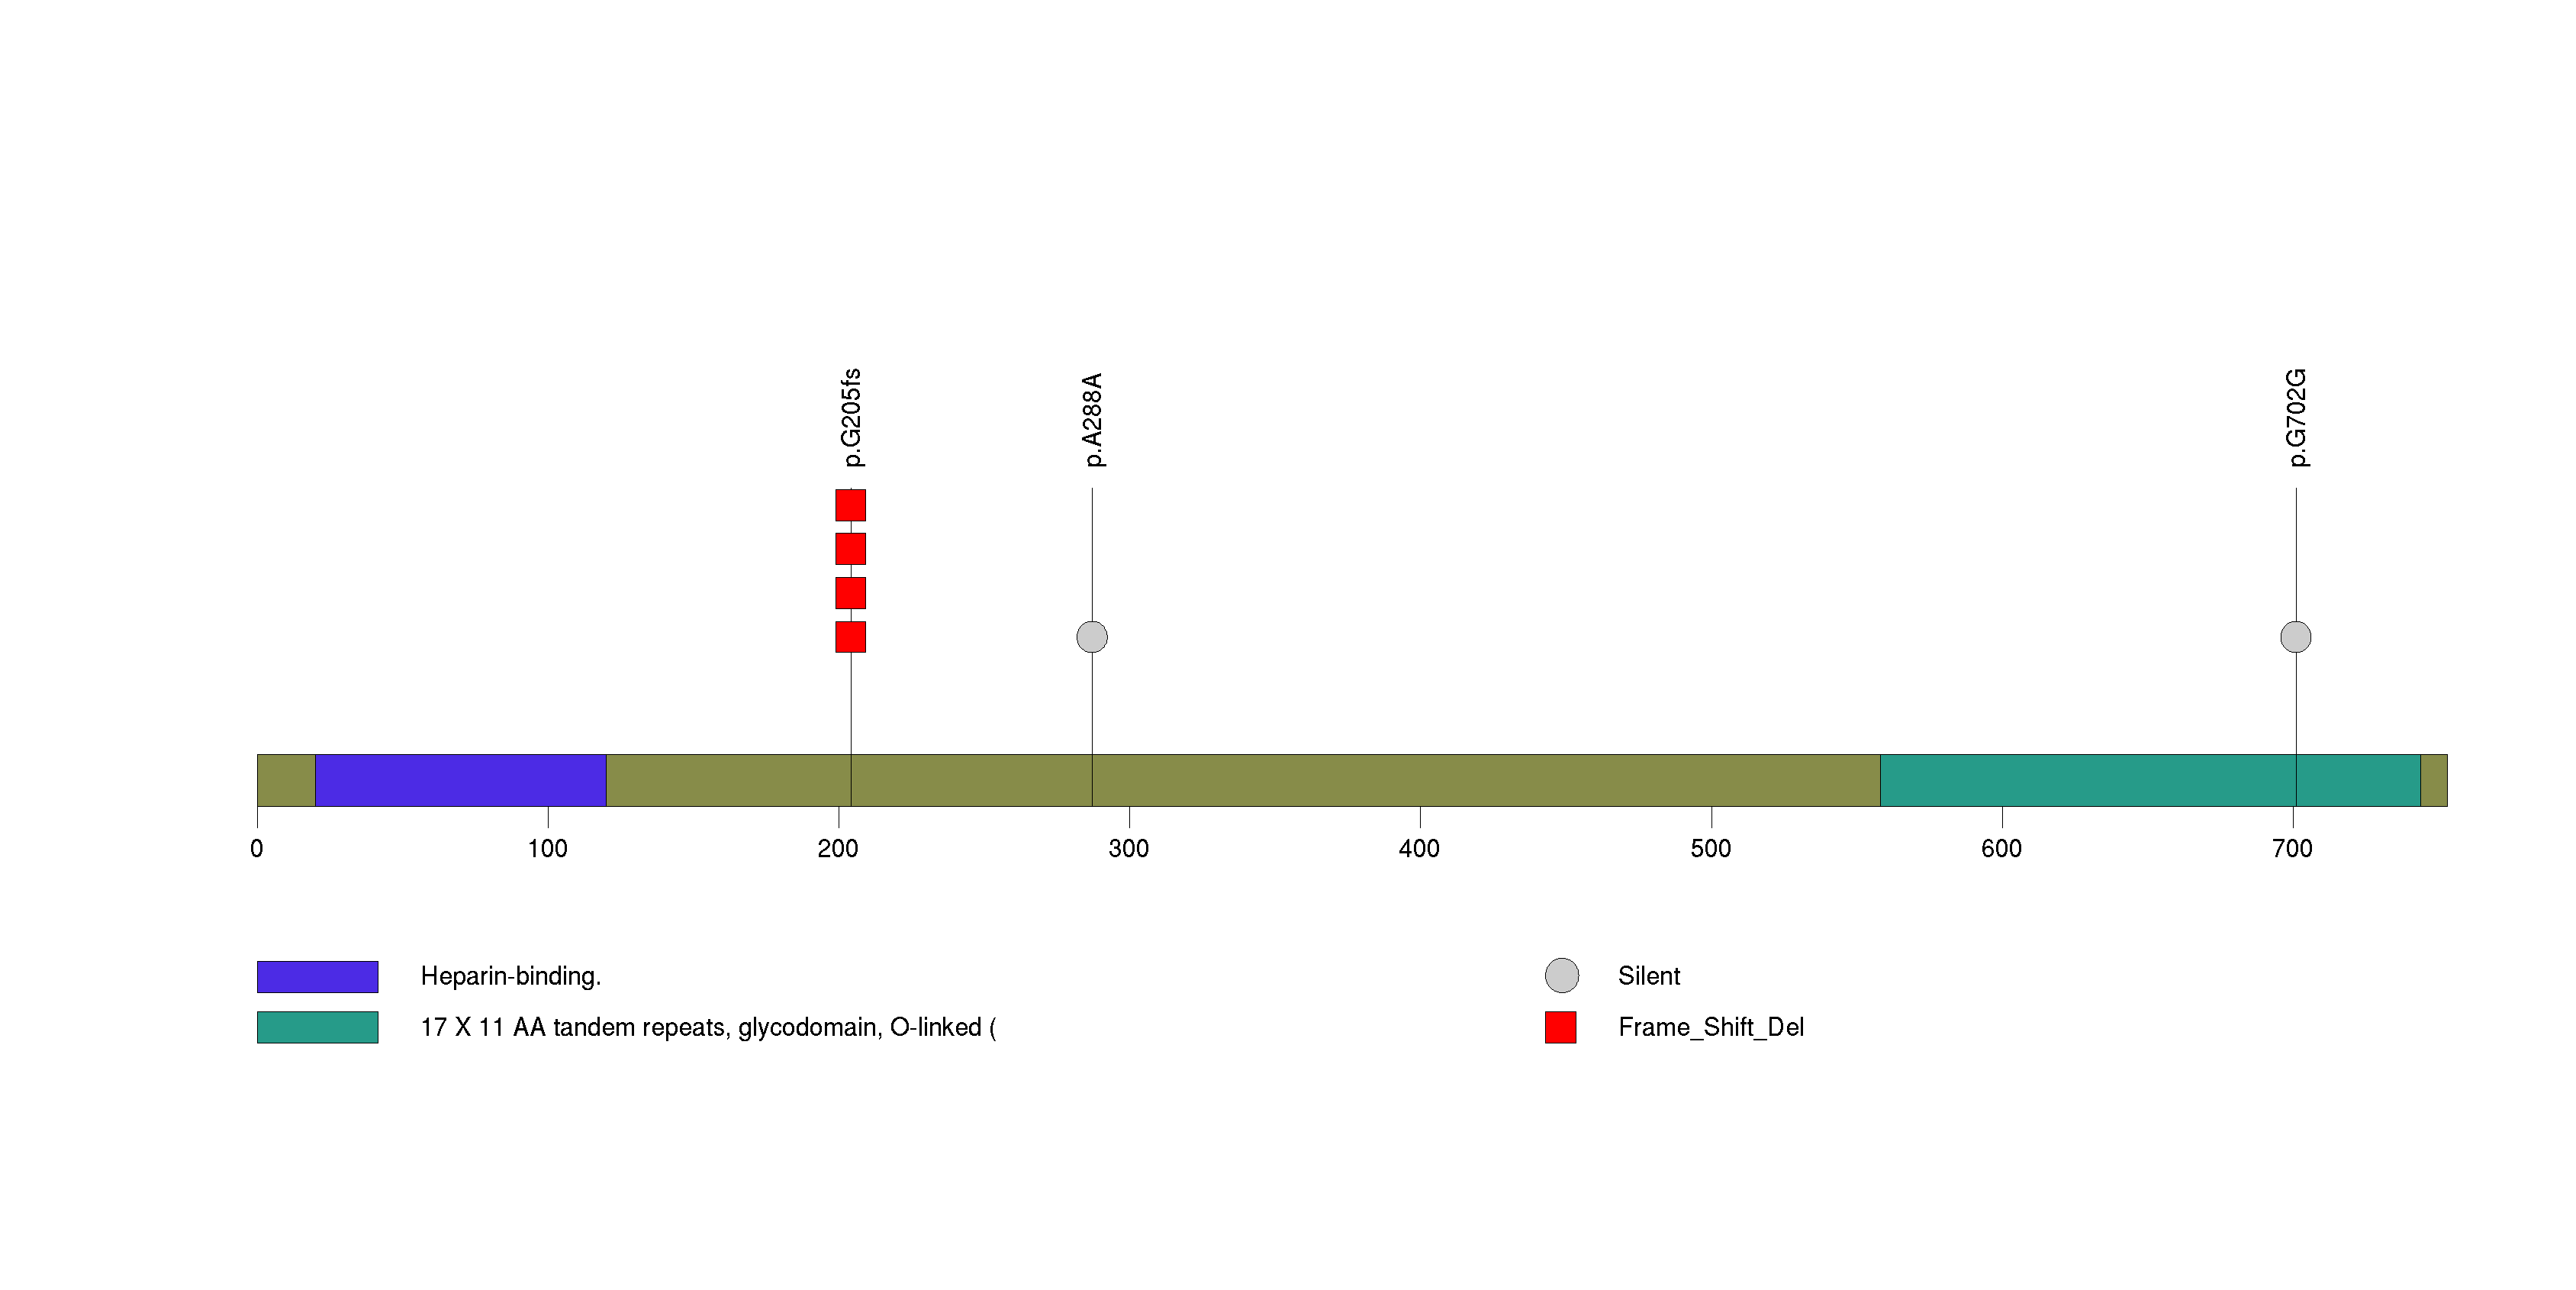
Figure S9. This figure depicts the distribution of mutations and mutation types across the CCR3 significant gene.
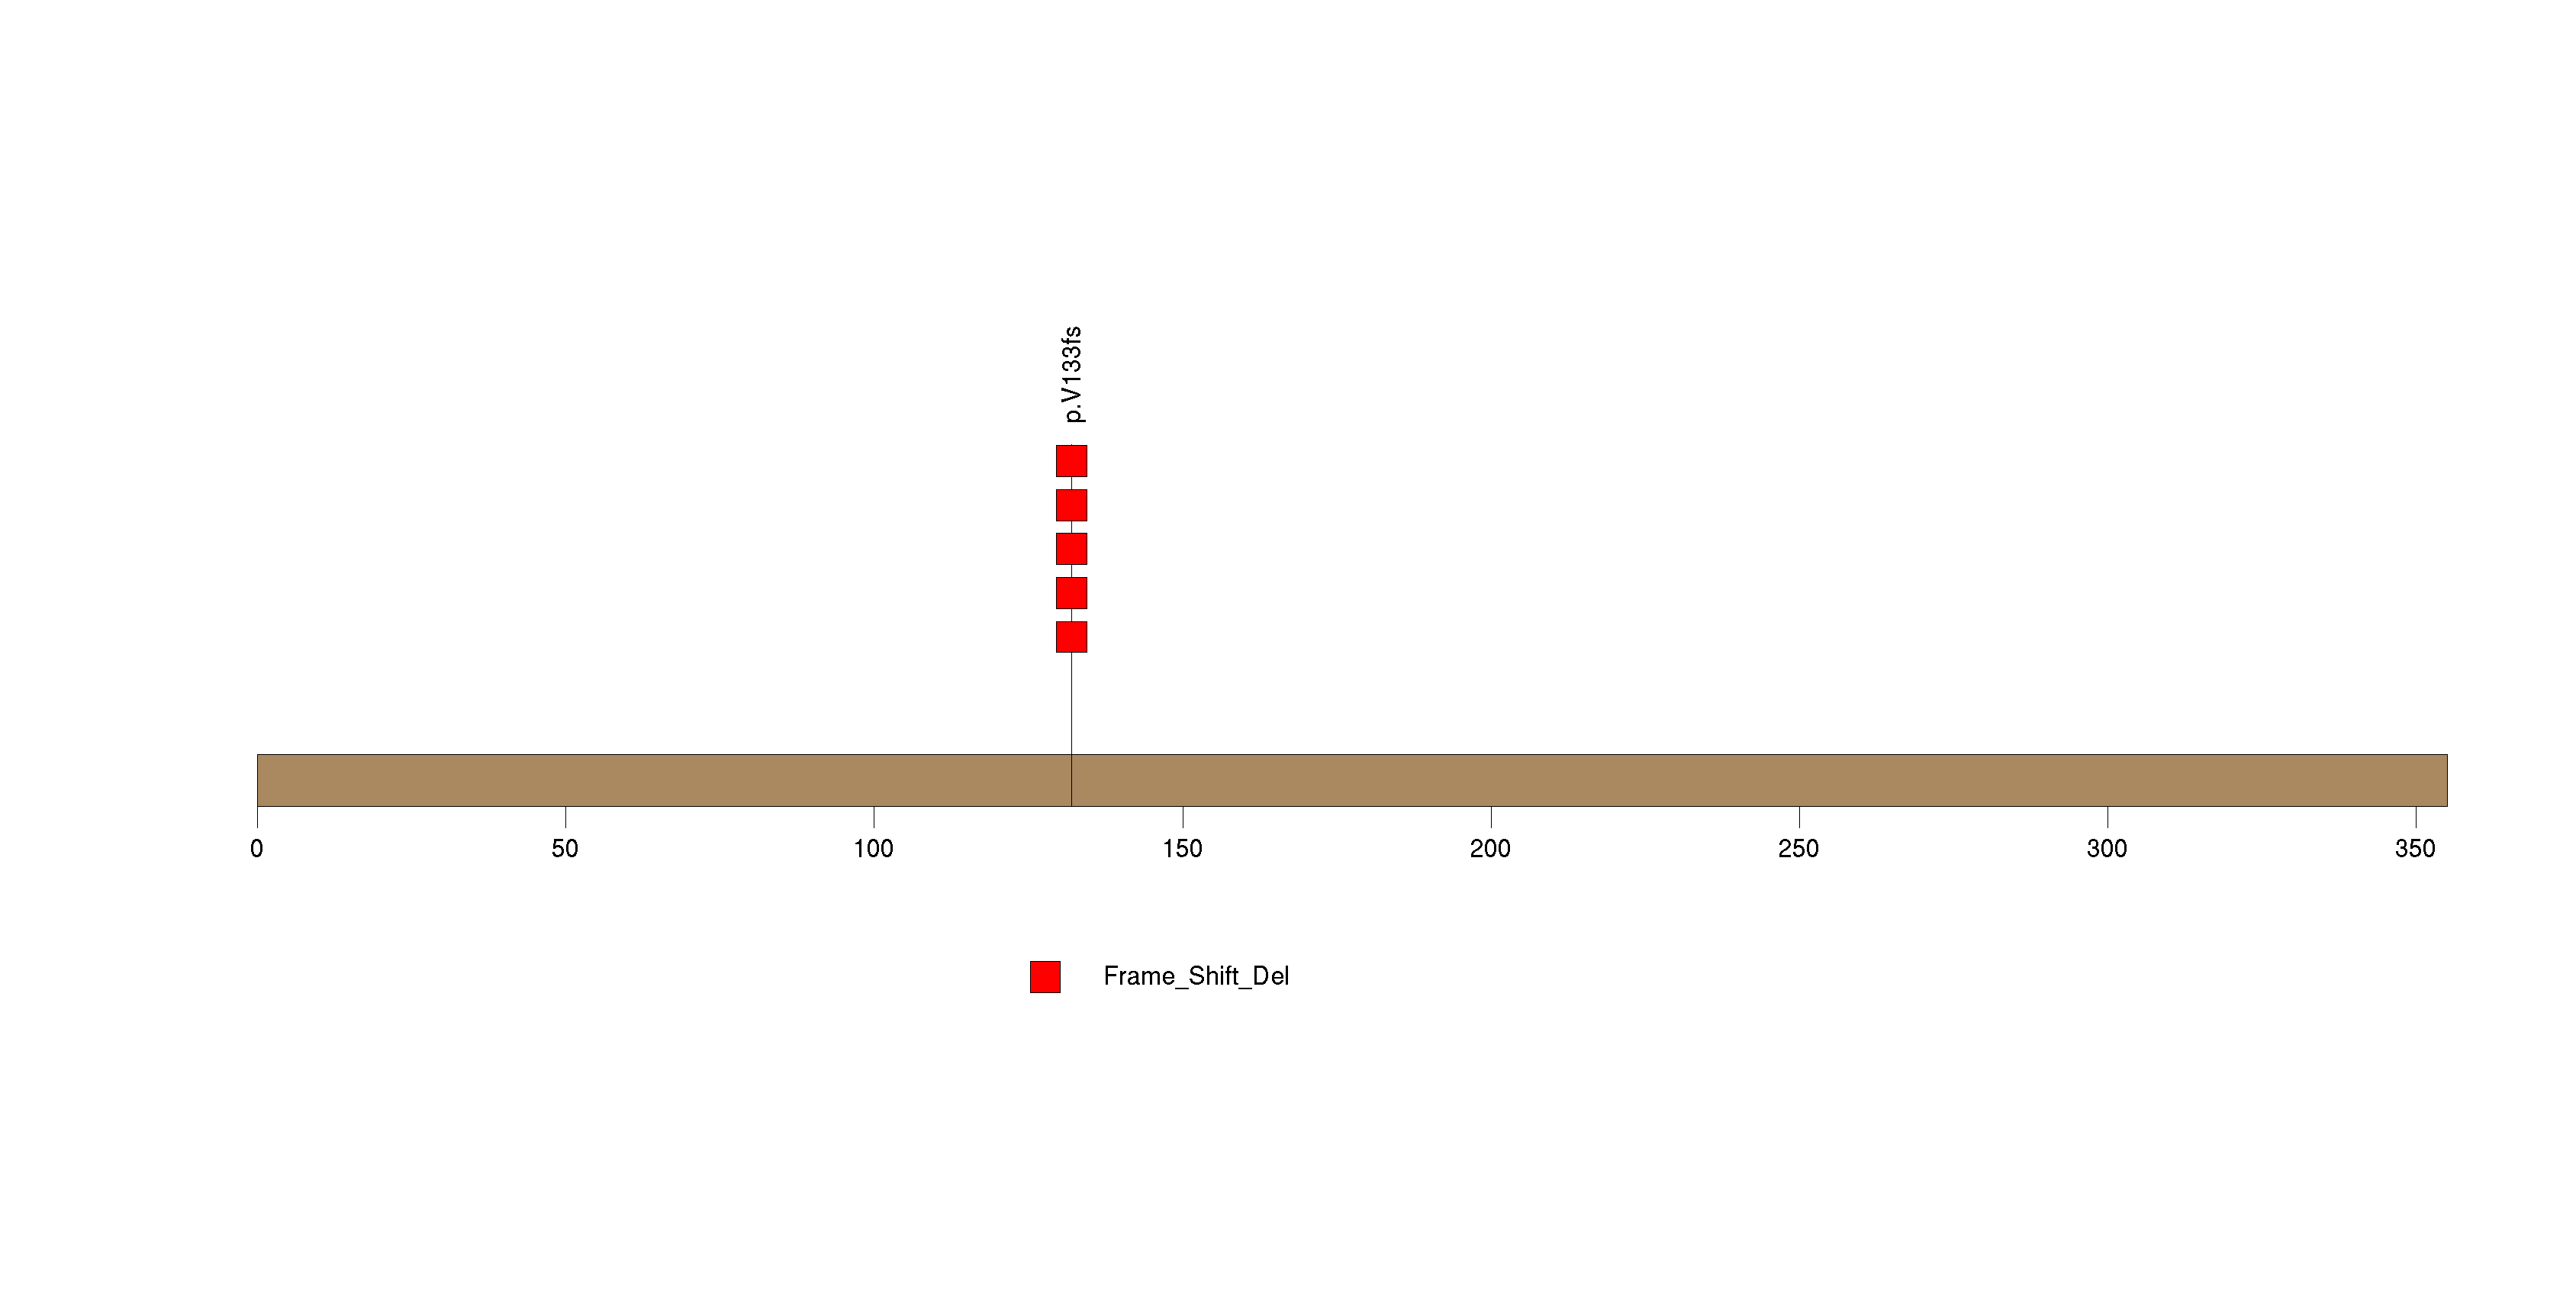
Figure S10. This figure depicts the distribution of mutations and mutation types across the OR10A2 significant gene.
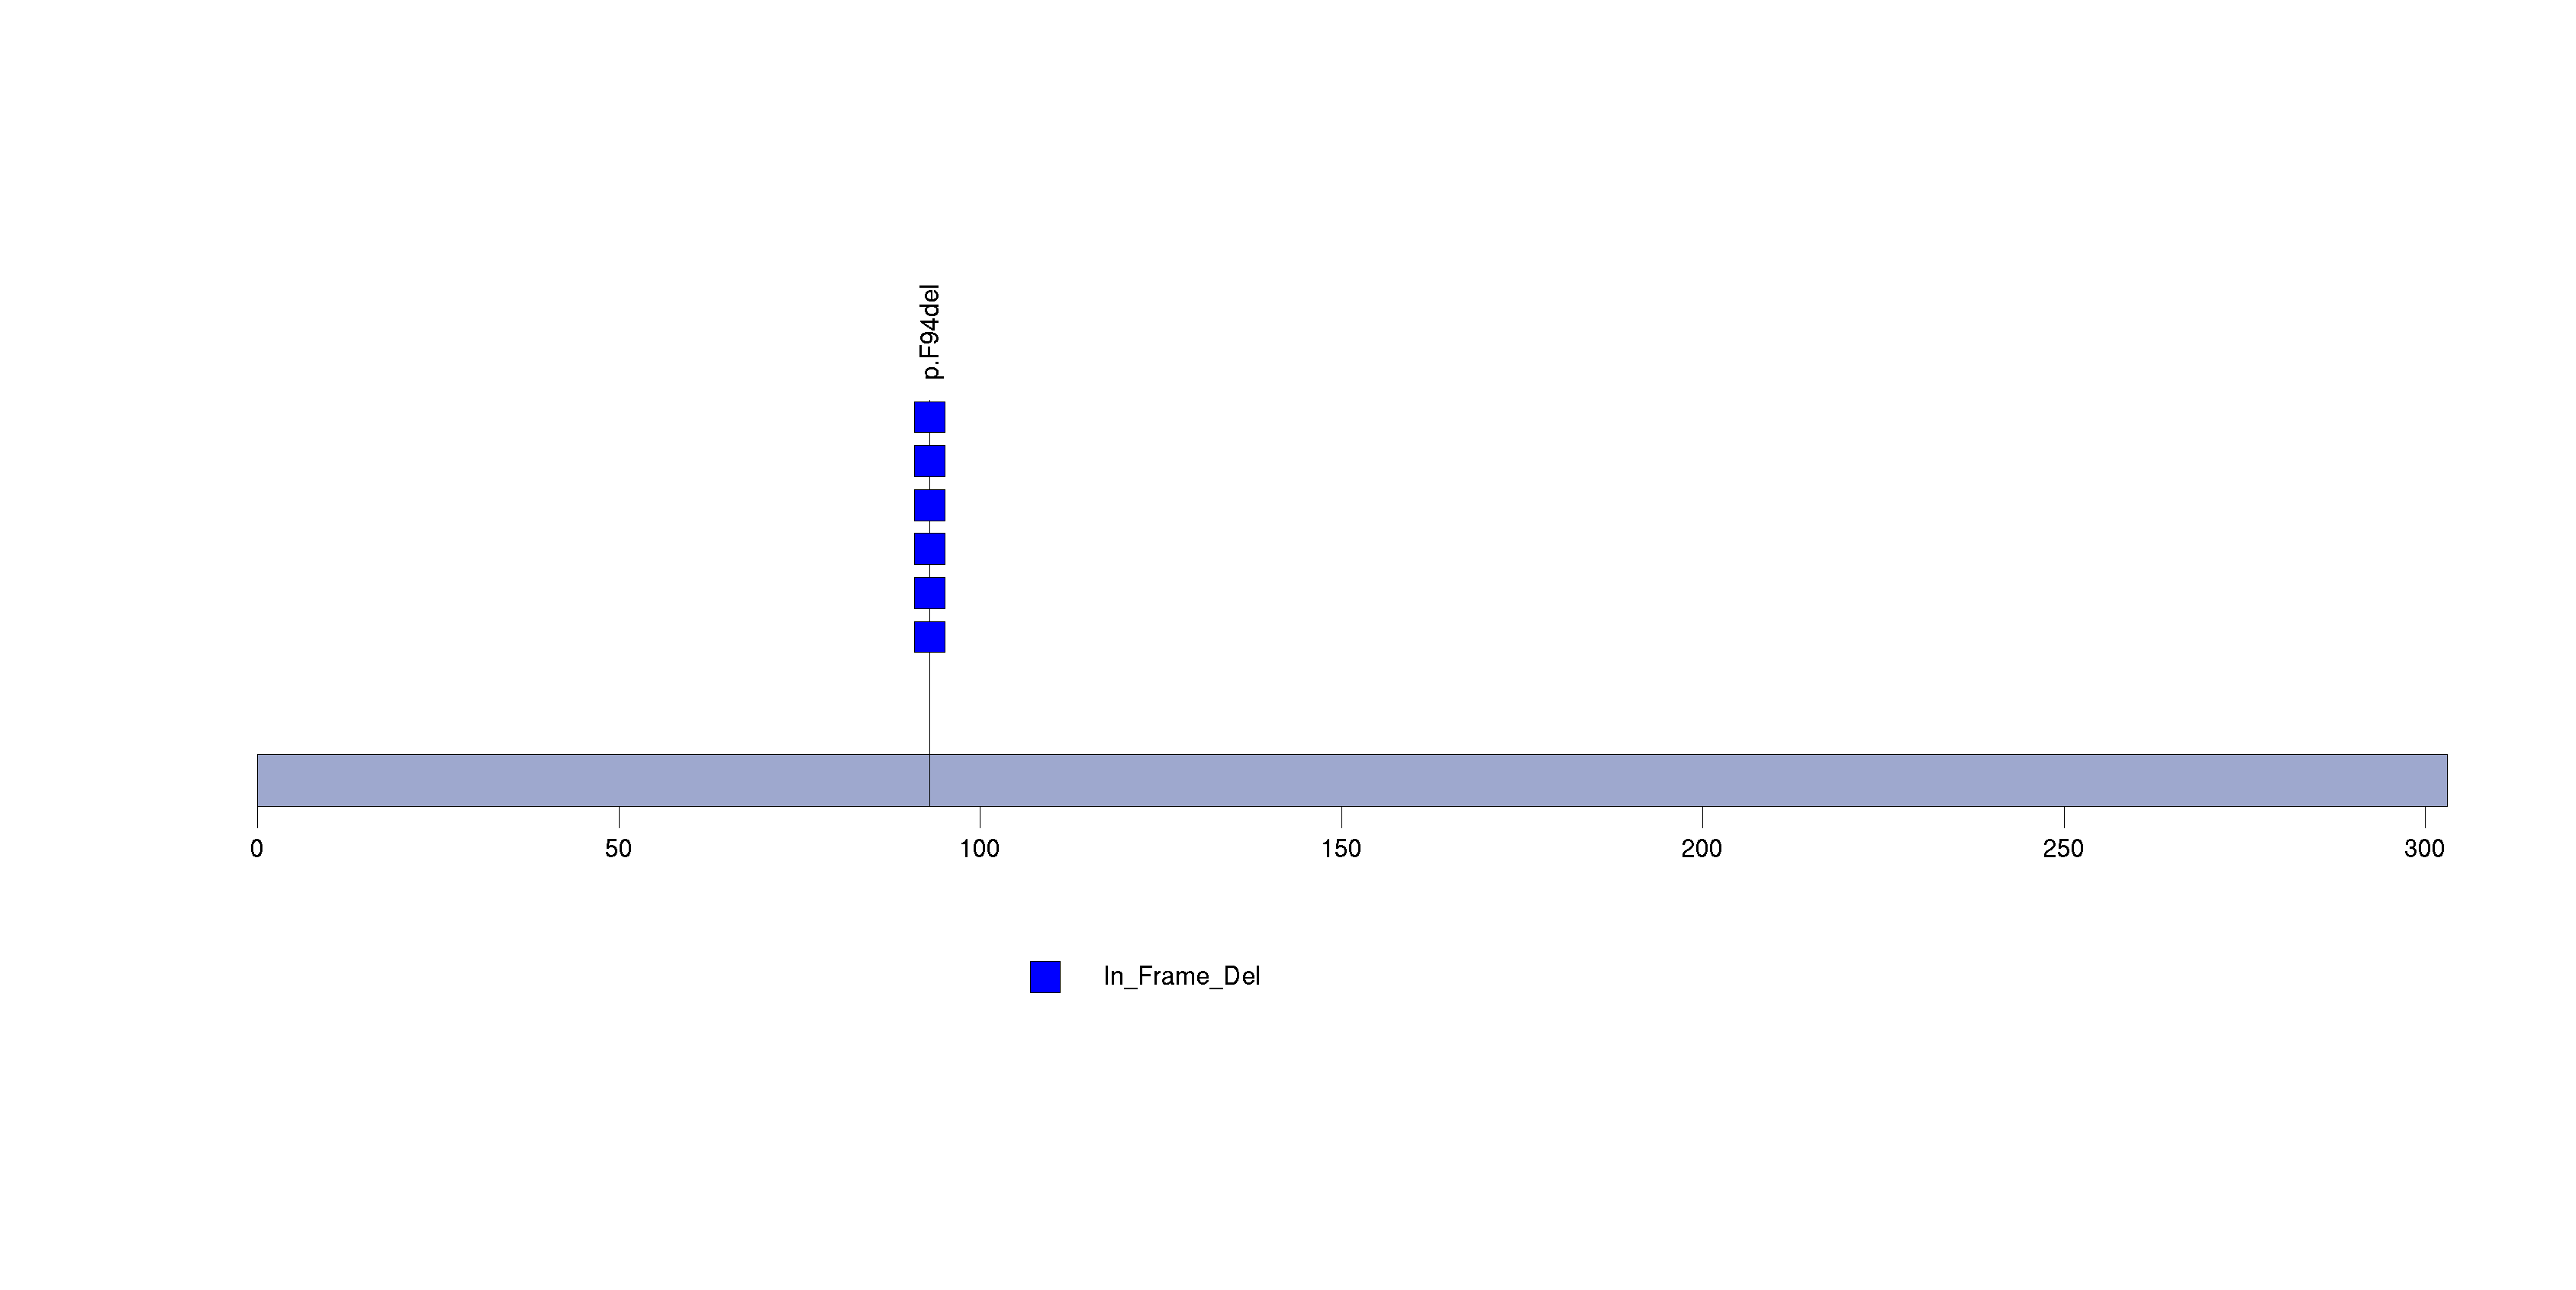
Figure S11. This figure depicts the distribution of mutations and mutation types across the OR10A7 significant gene.
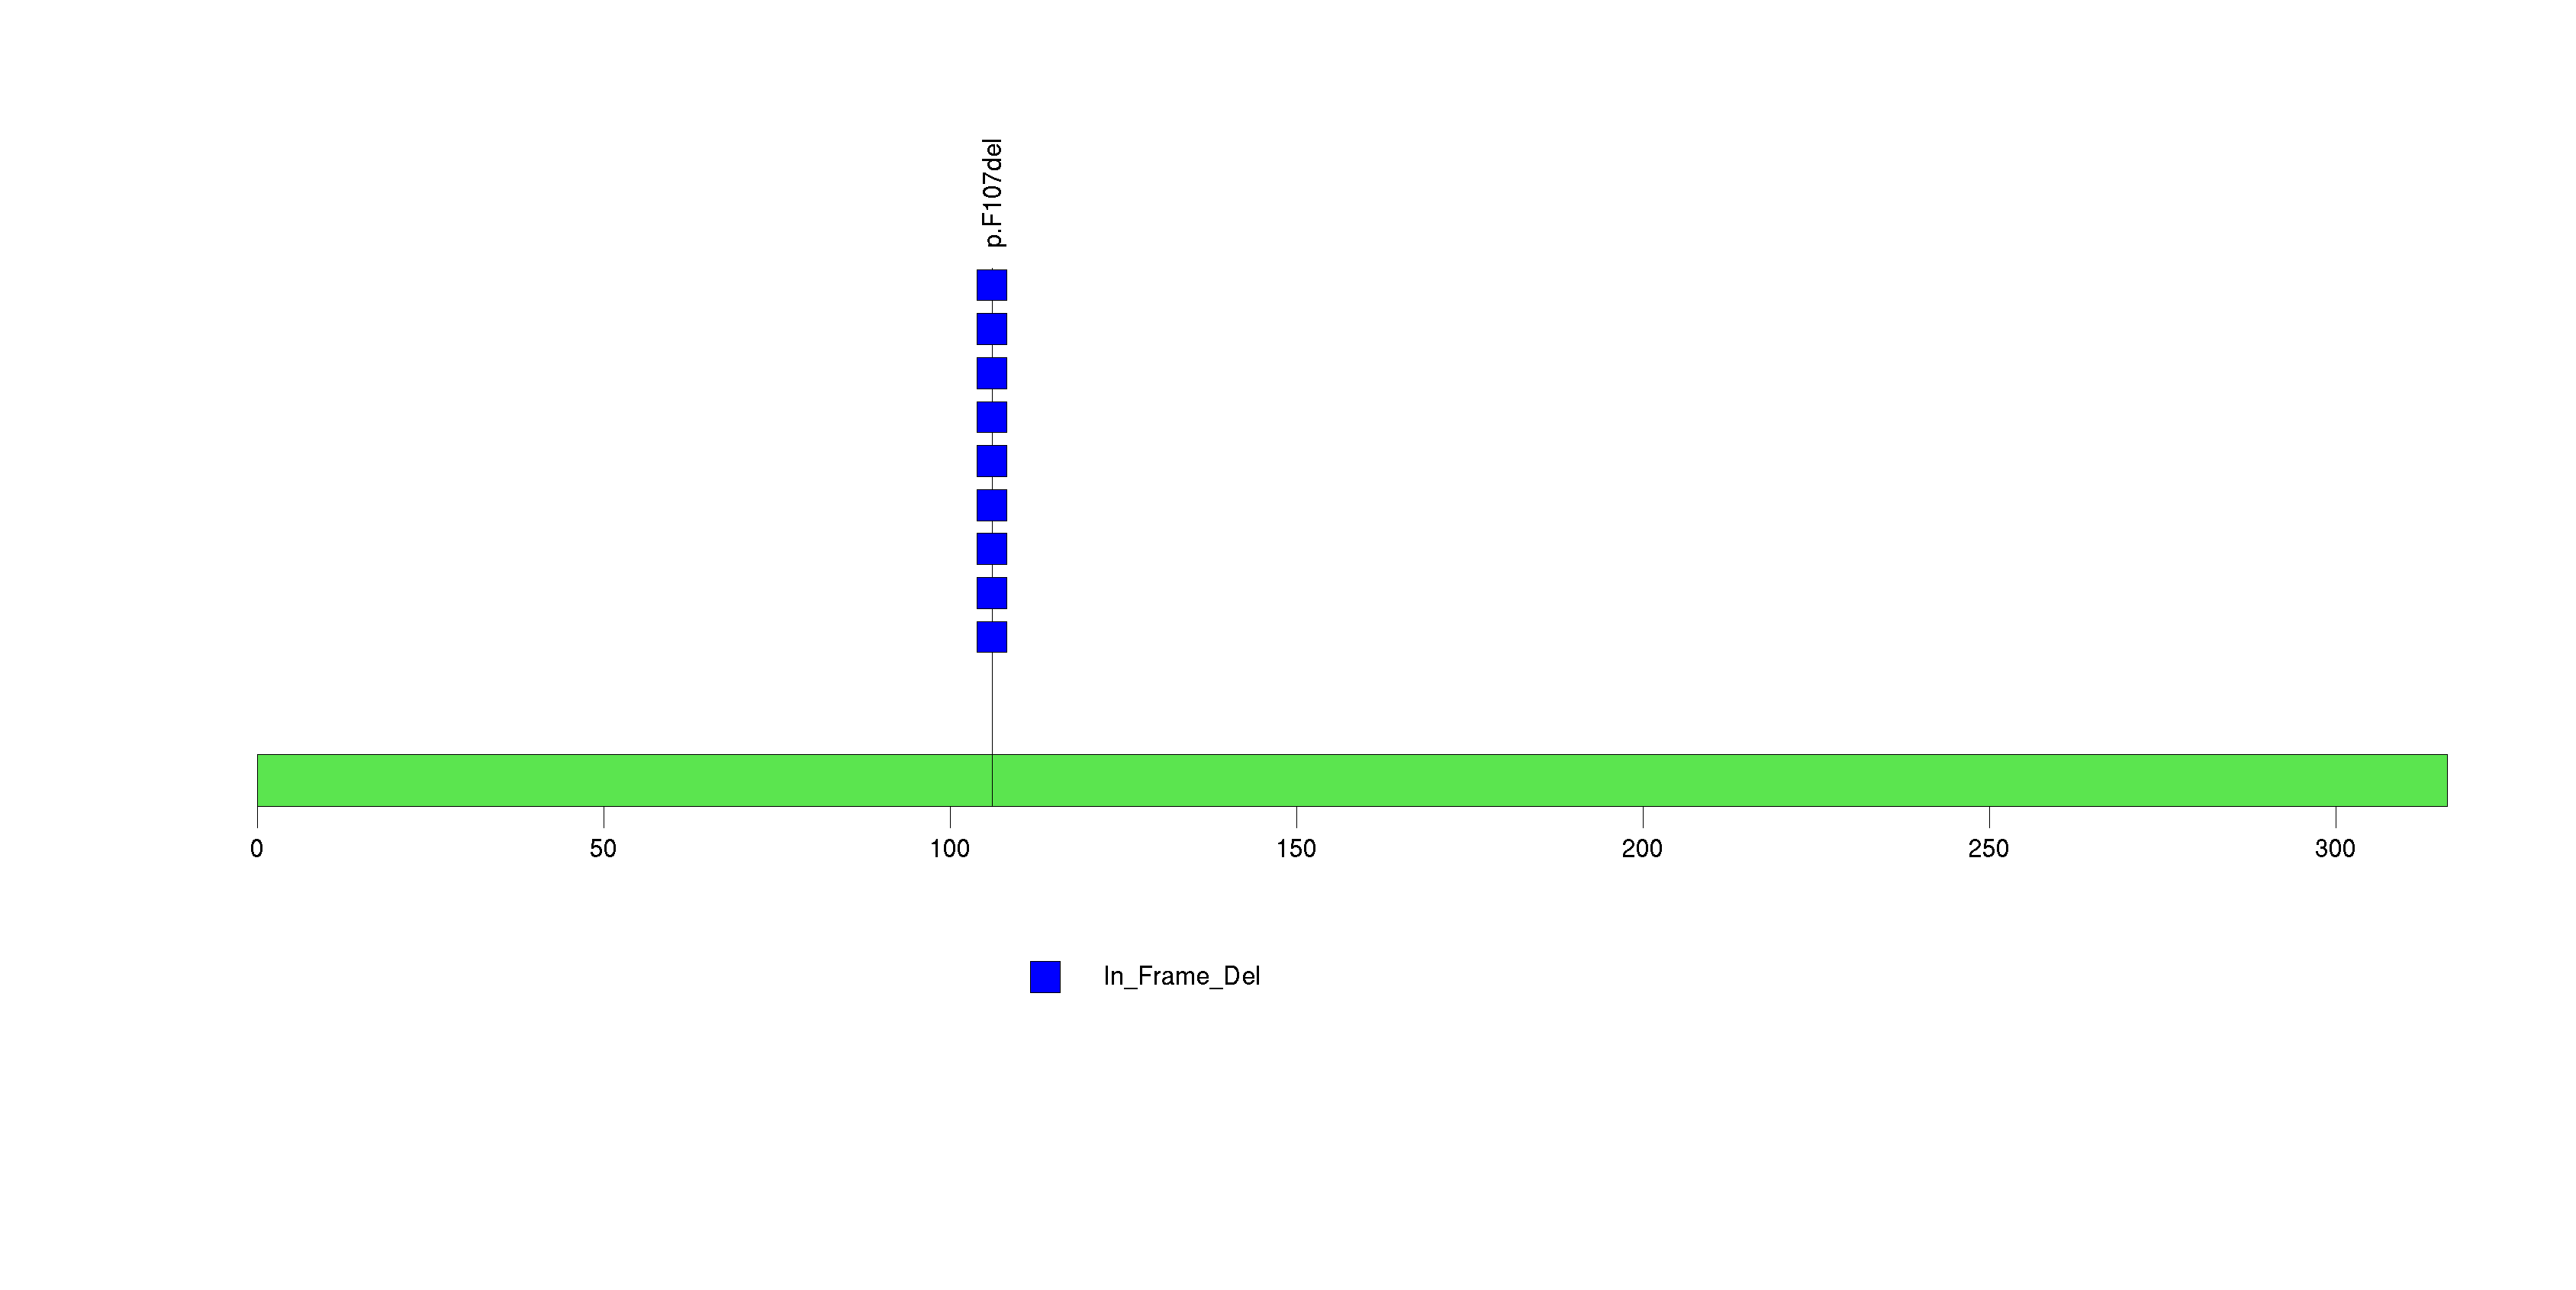
Figure S12. This figure depicts the distribution of mutations and mutation types across the POP5 significant gene.
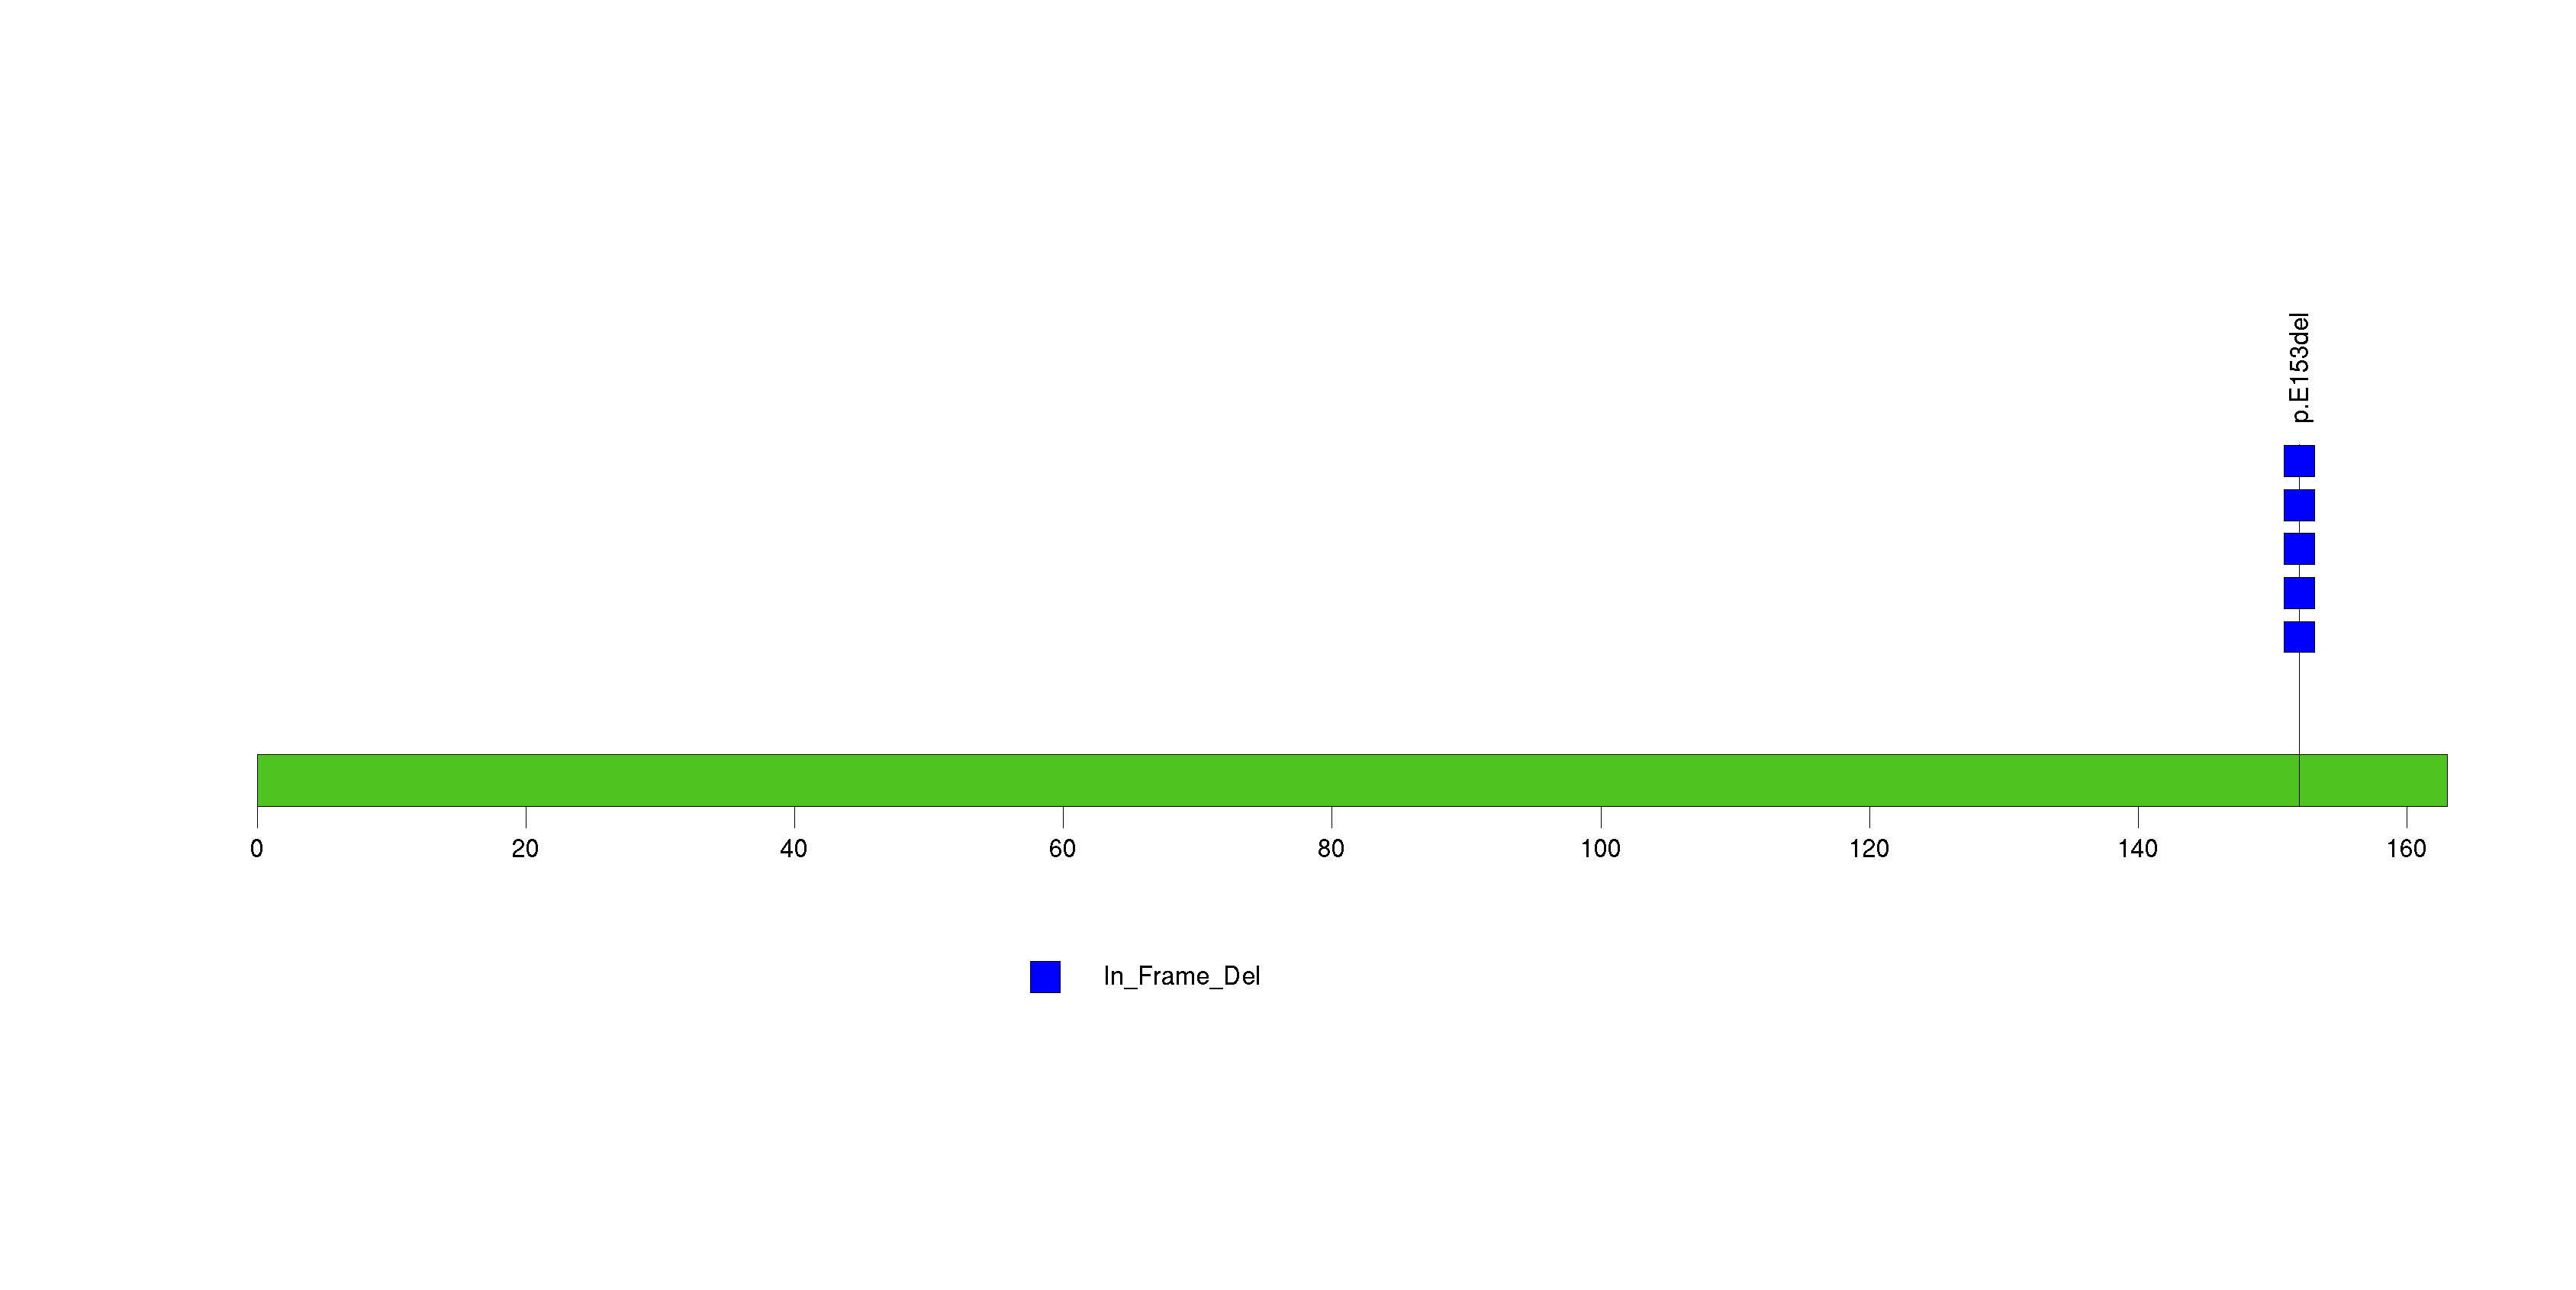
Figure S13. This figure depicts the distribution of mutations and mutation types across the SRP14 significant gene.
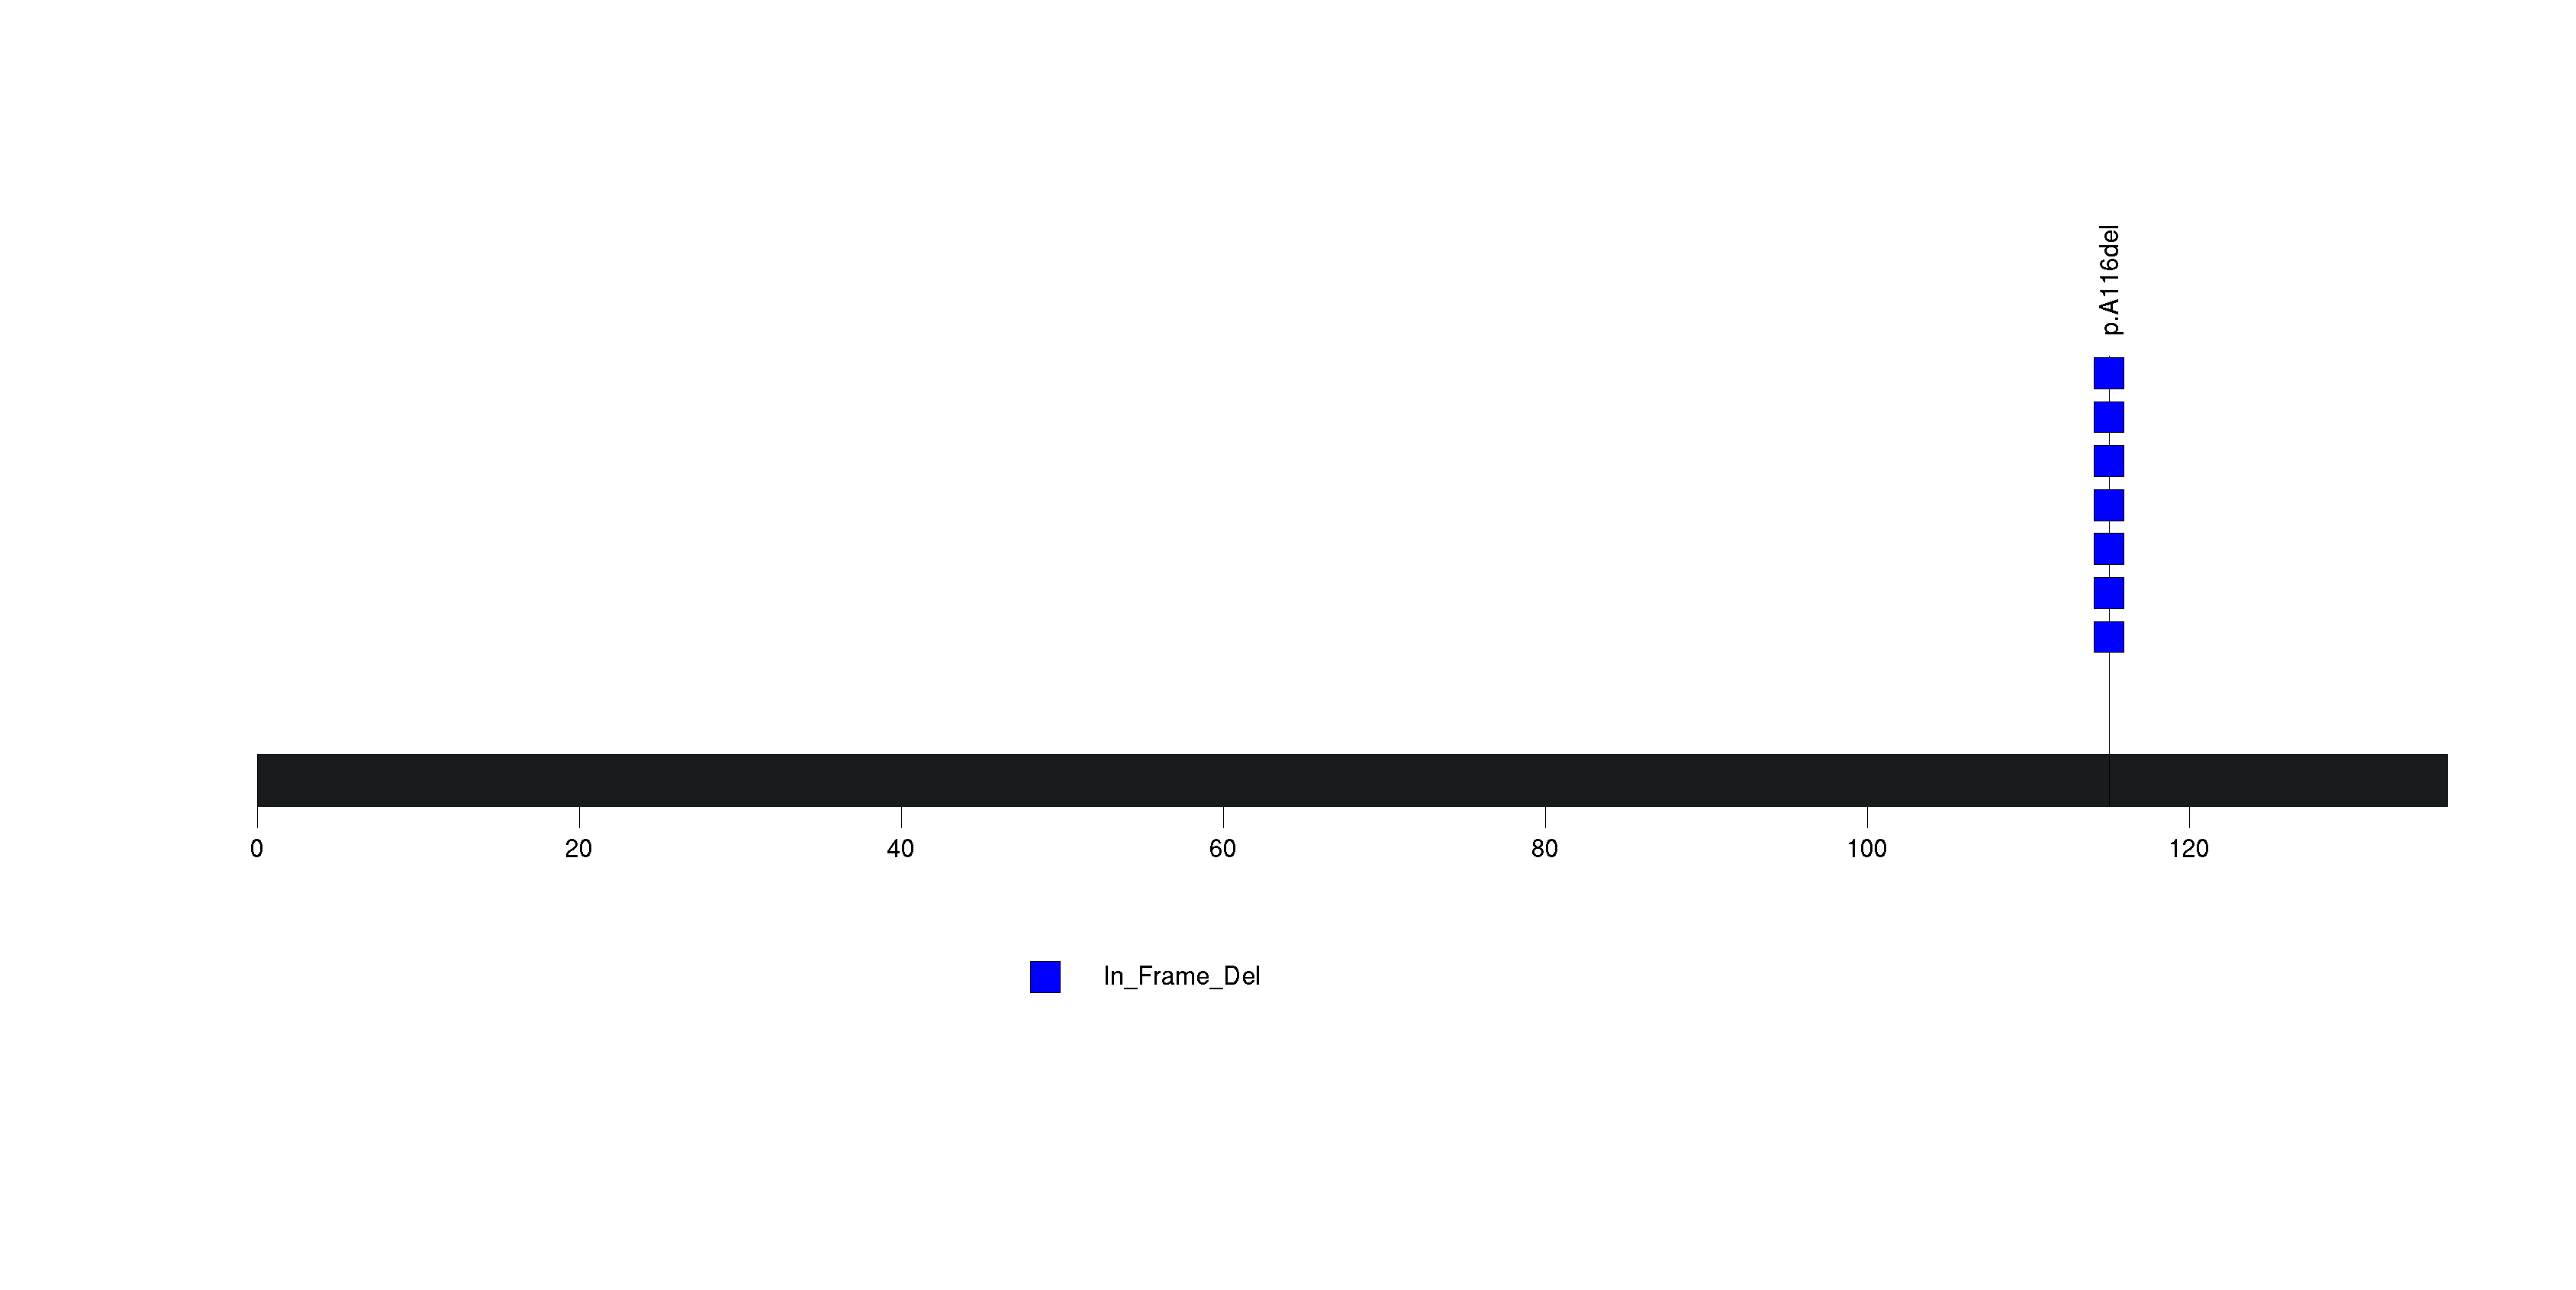
Figure S14. This figure depicts the distribution of mutations and mutation types across the WRN significant gene.
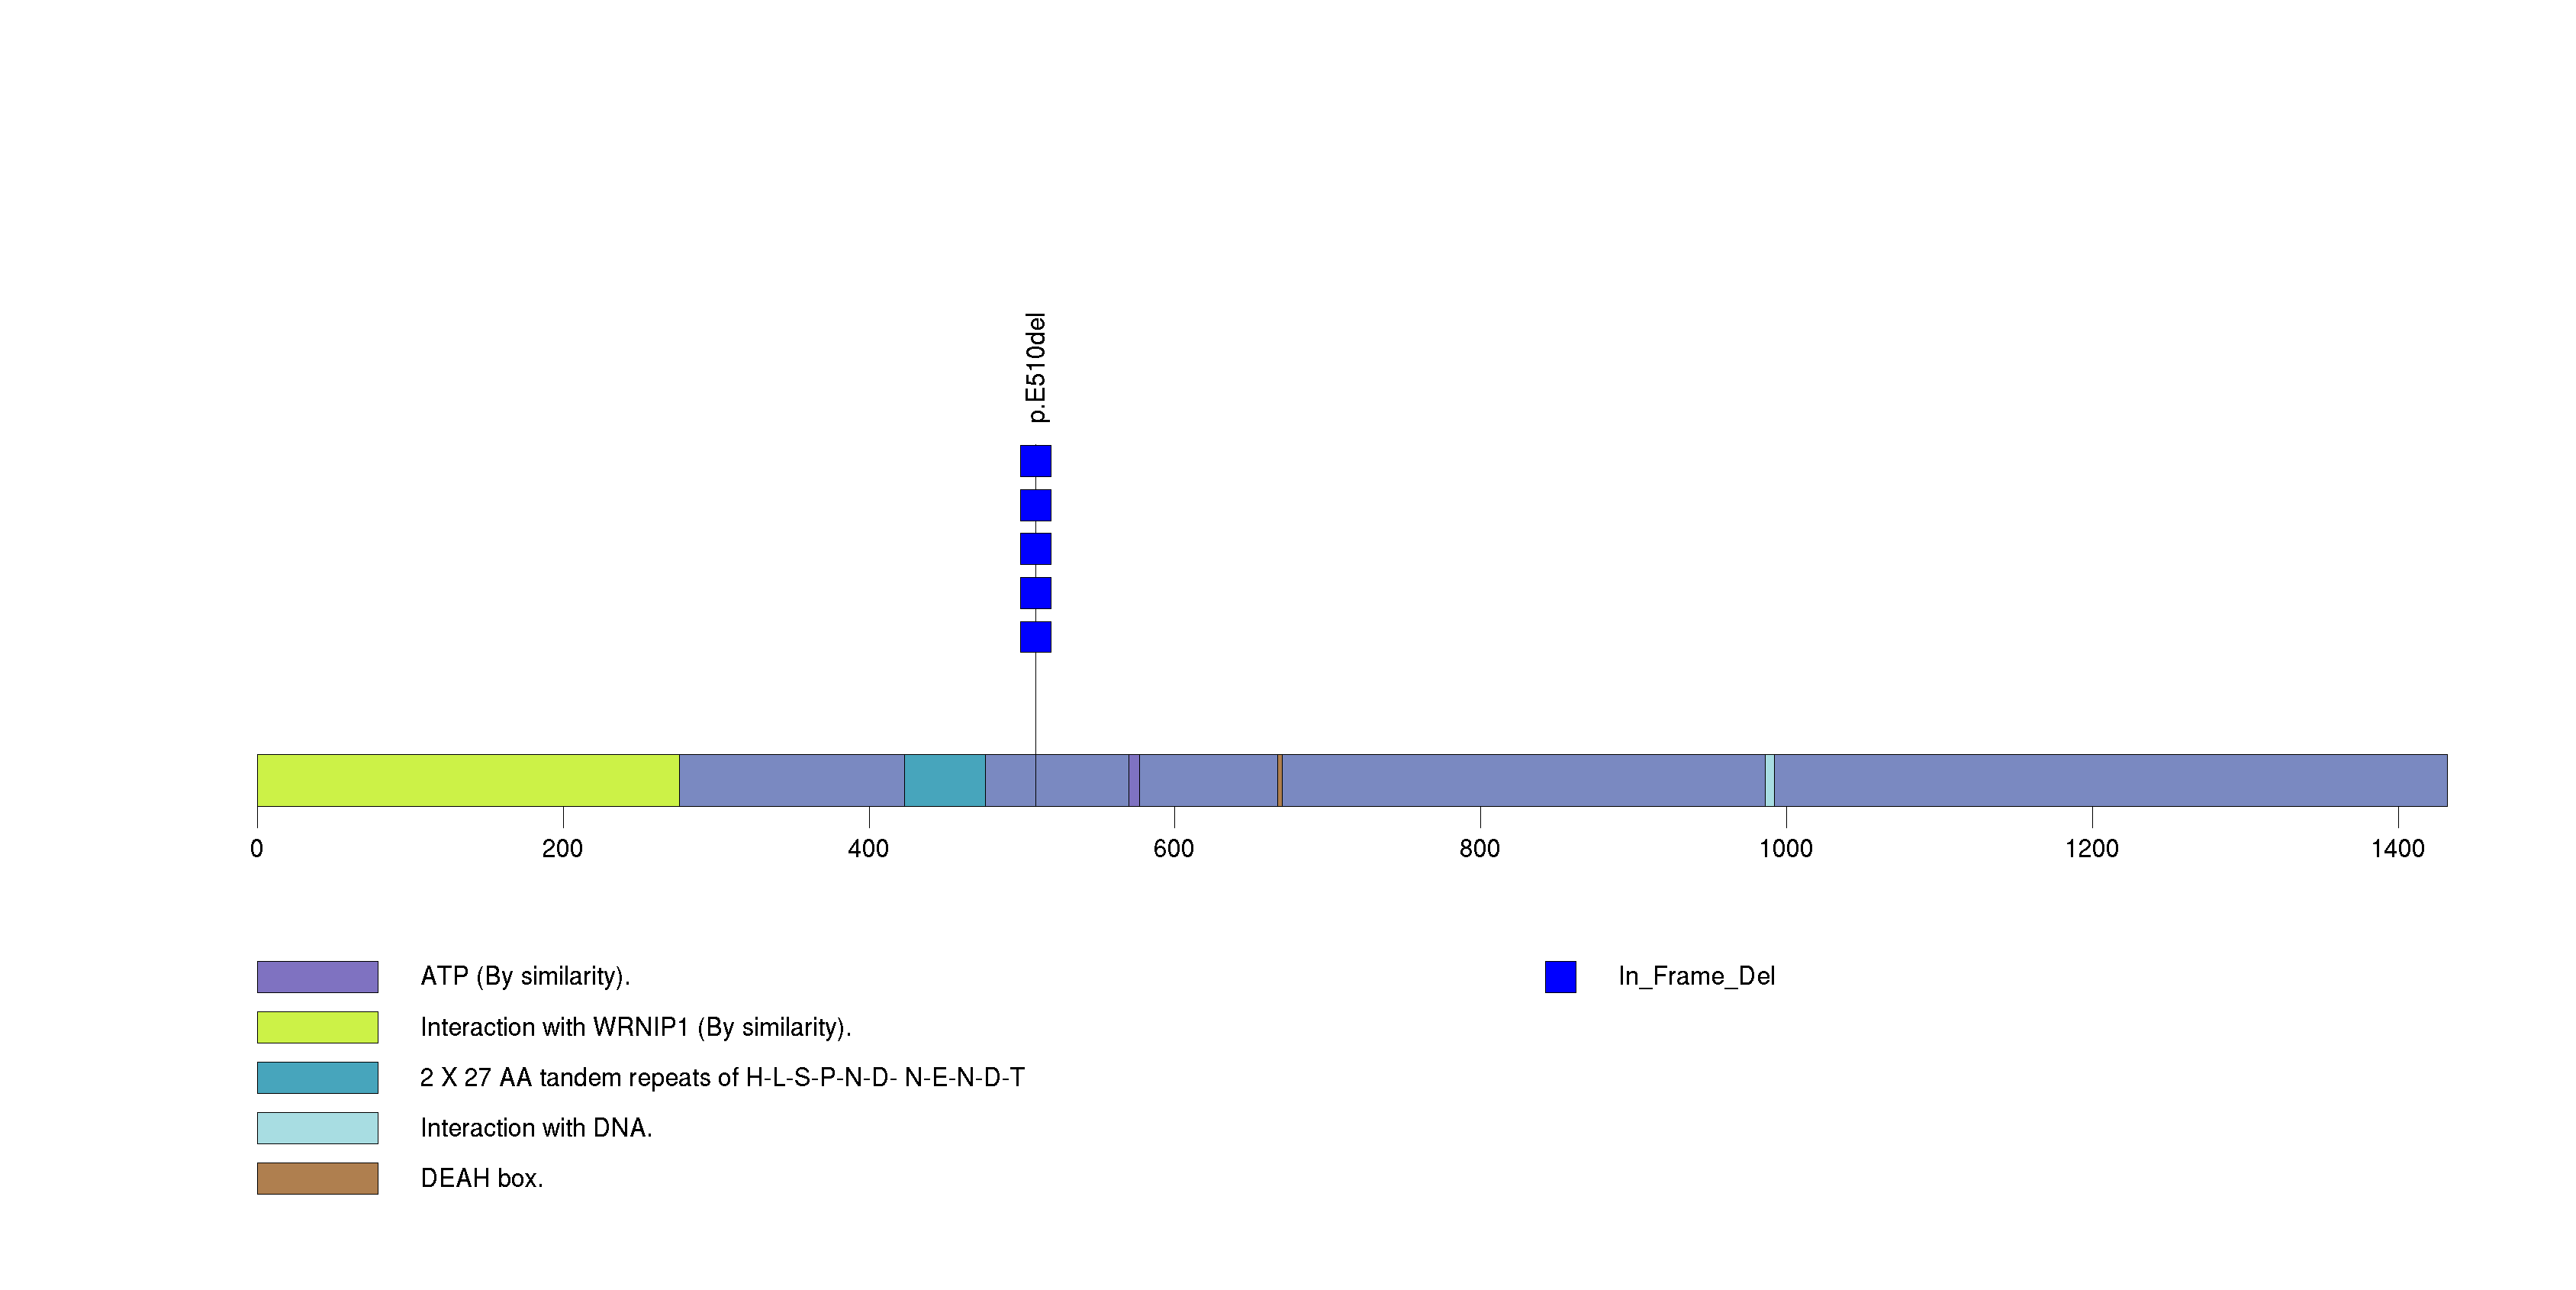
Figure S15. This figure depicts the distribution of mutations and mutation types across the TMEM40 significant gene.
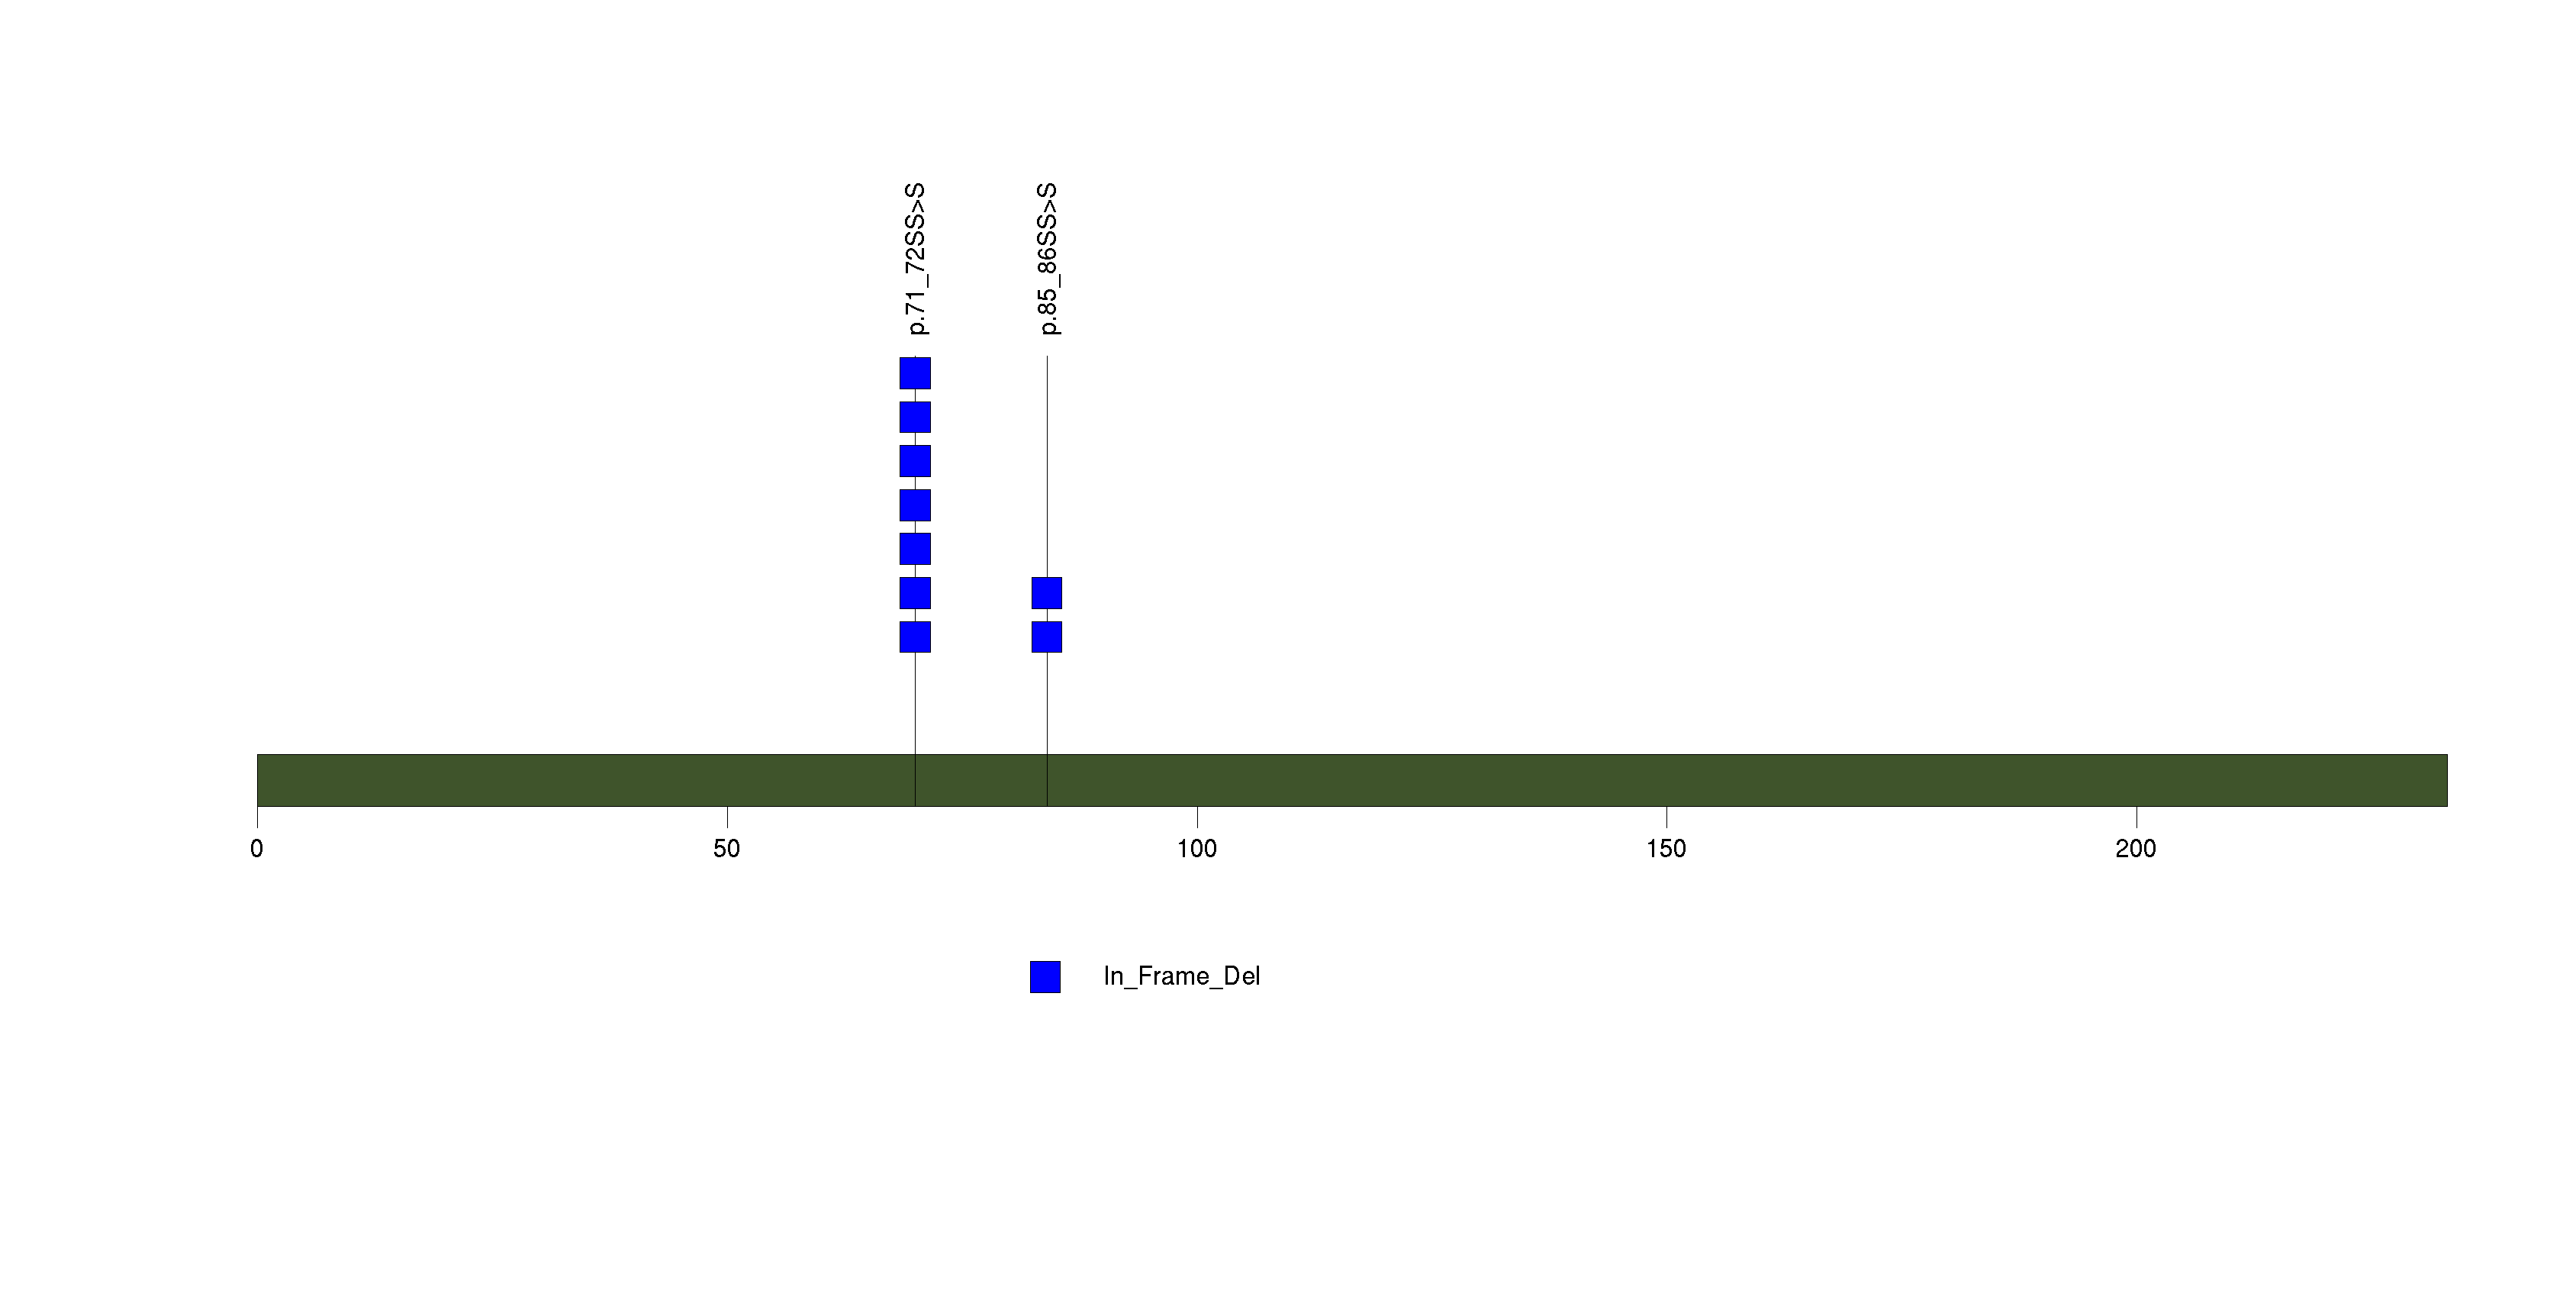
Figure S16. This figure depicts the distribution of mutations and mutation types across the KRAS significant gene.
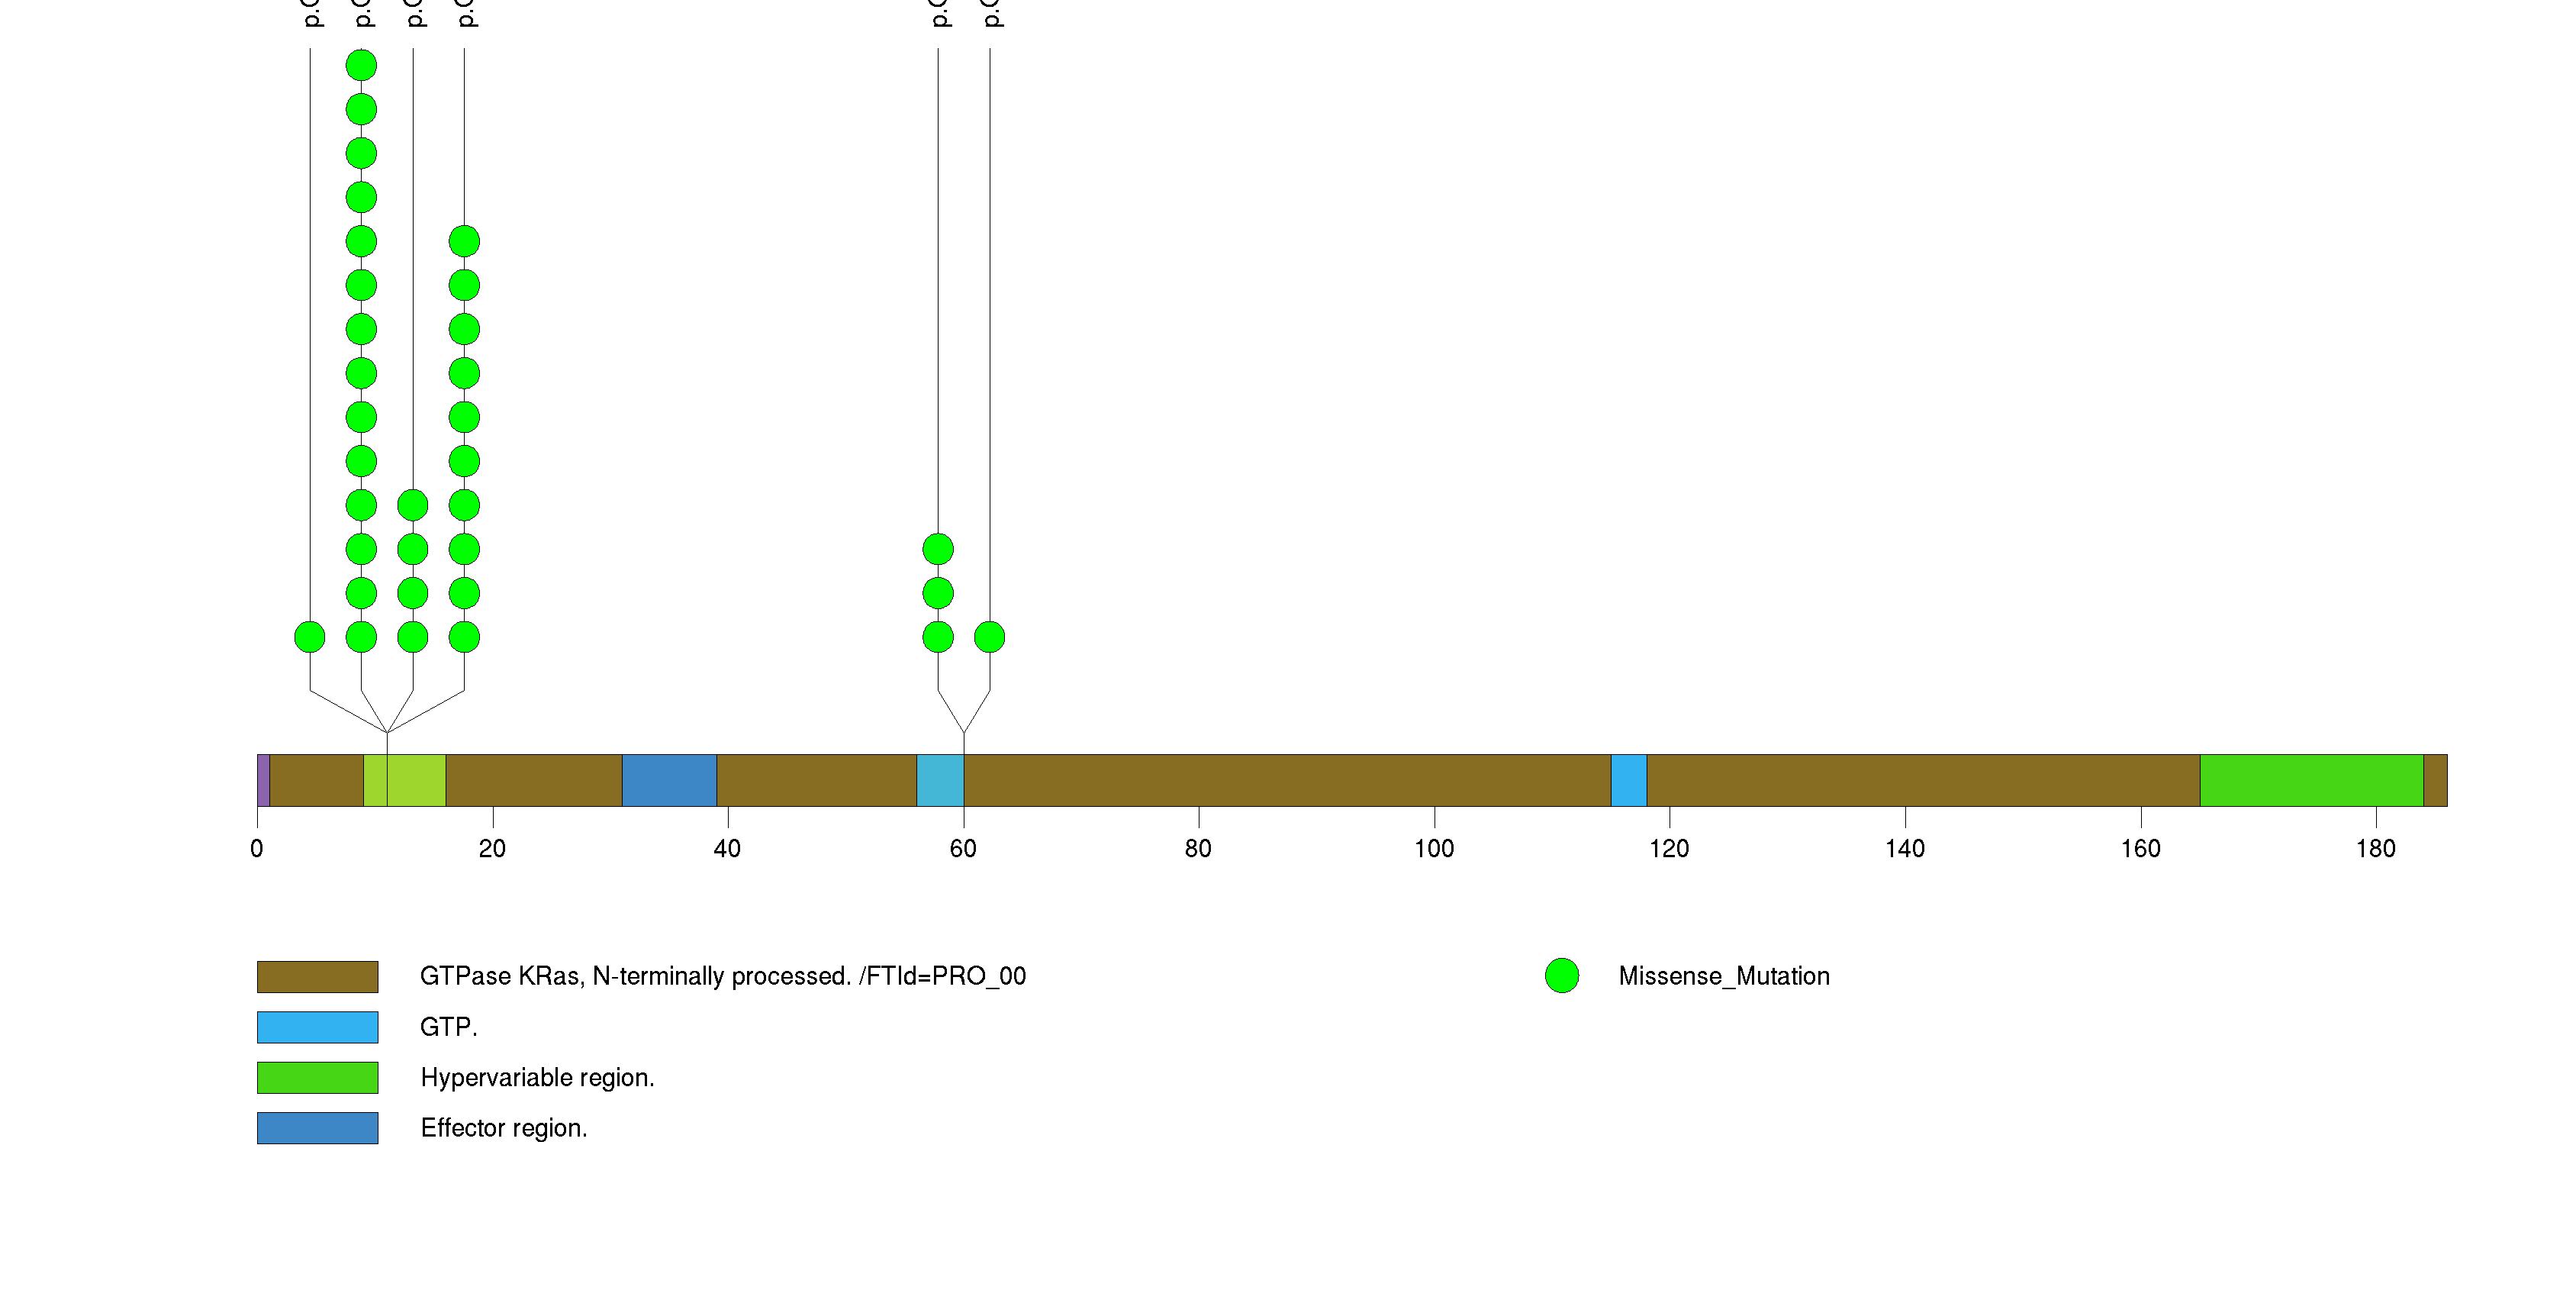
Figure S17. This figure depicts the distribution of mutations and mutation types across the TP53 significant gene.
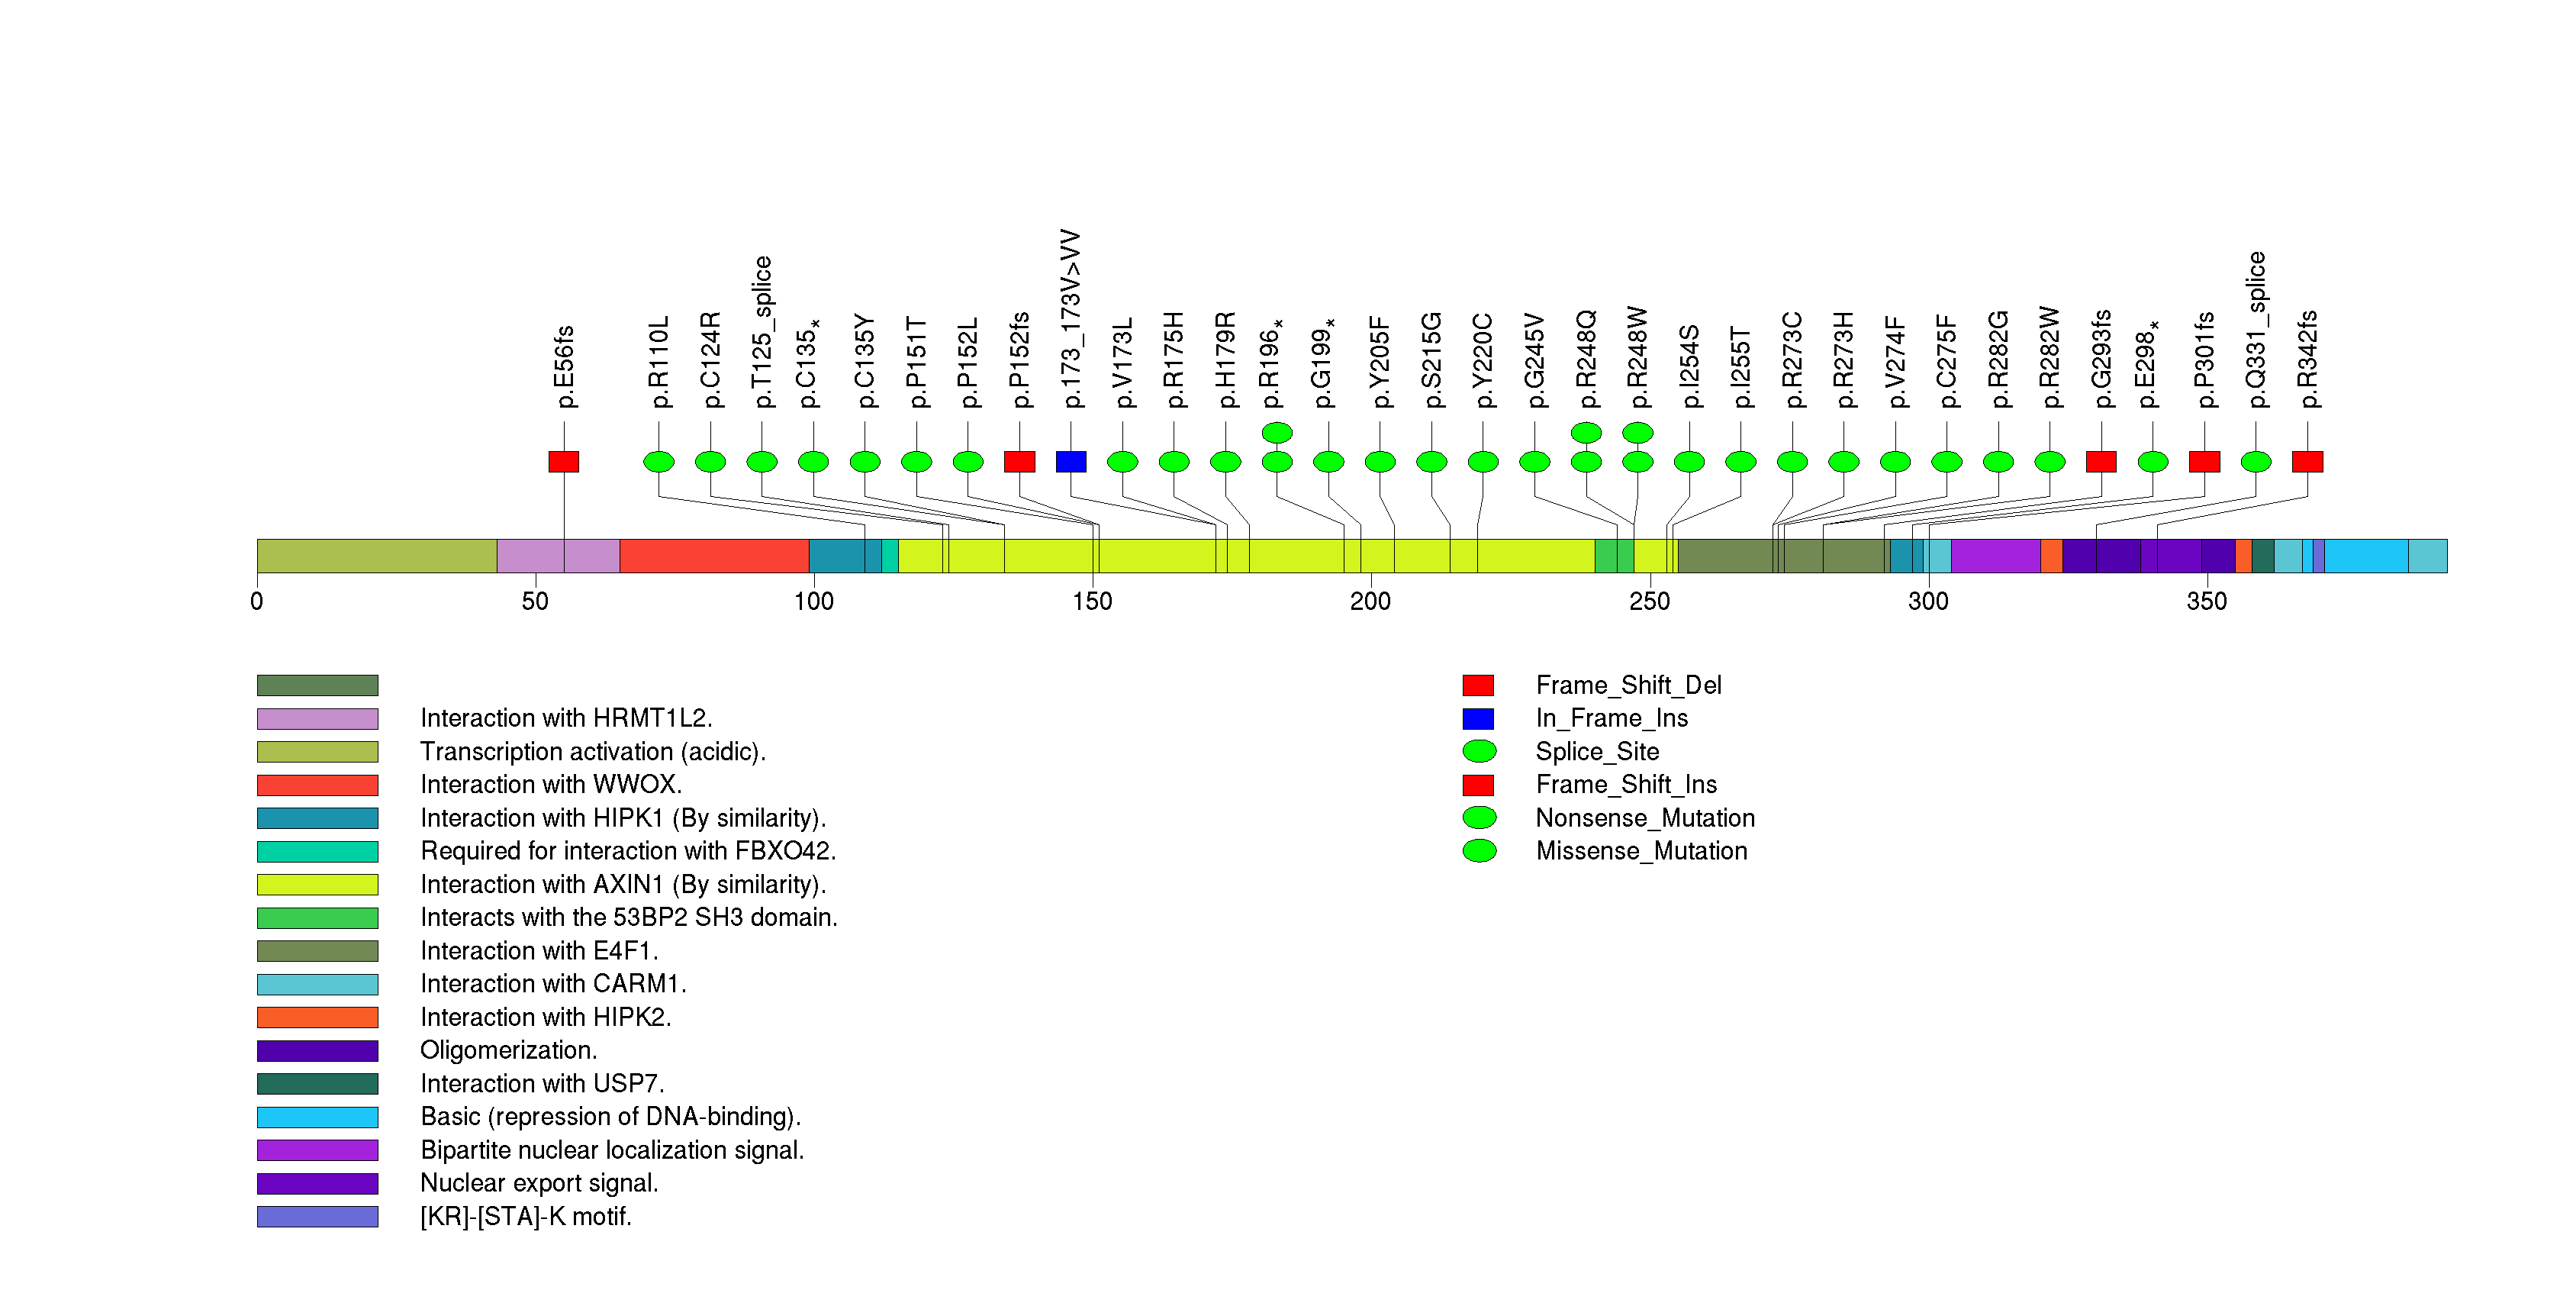
Figure S18. This figure depicts the distribution of mutations and mutation types across the QRICH1 significant gene.
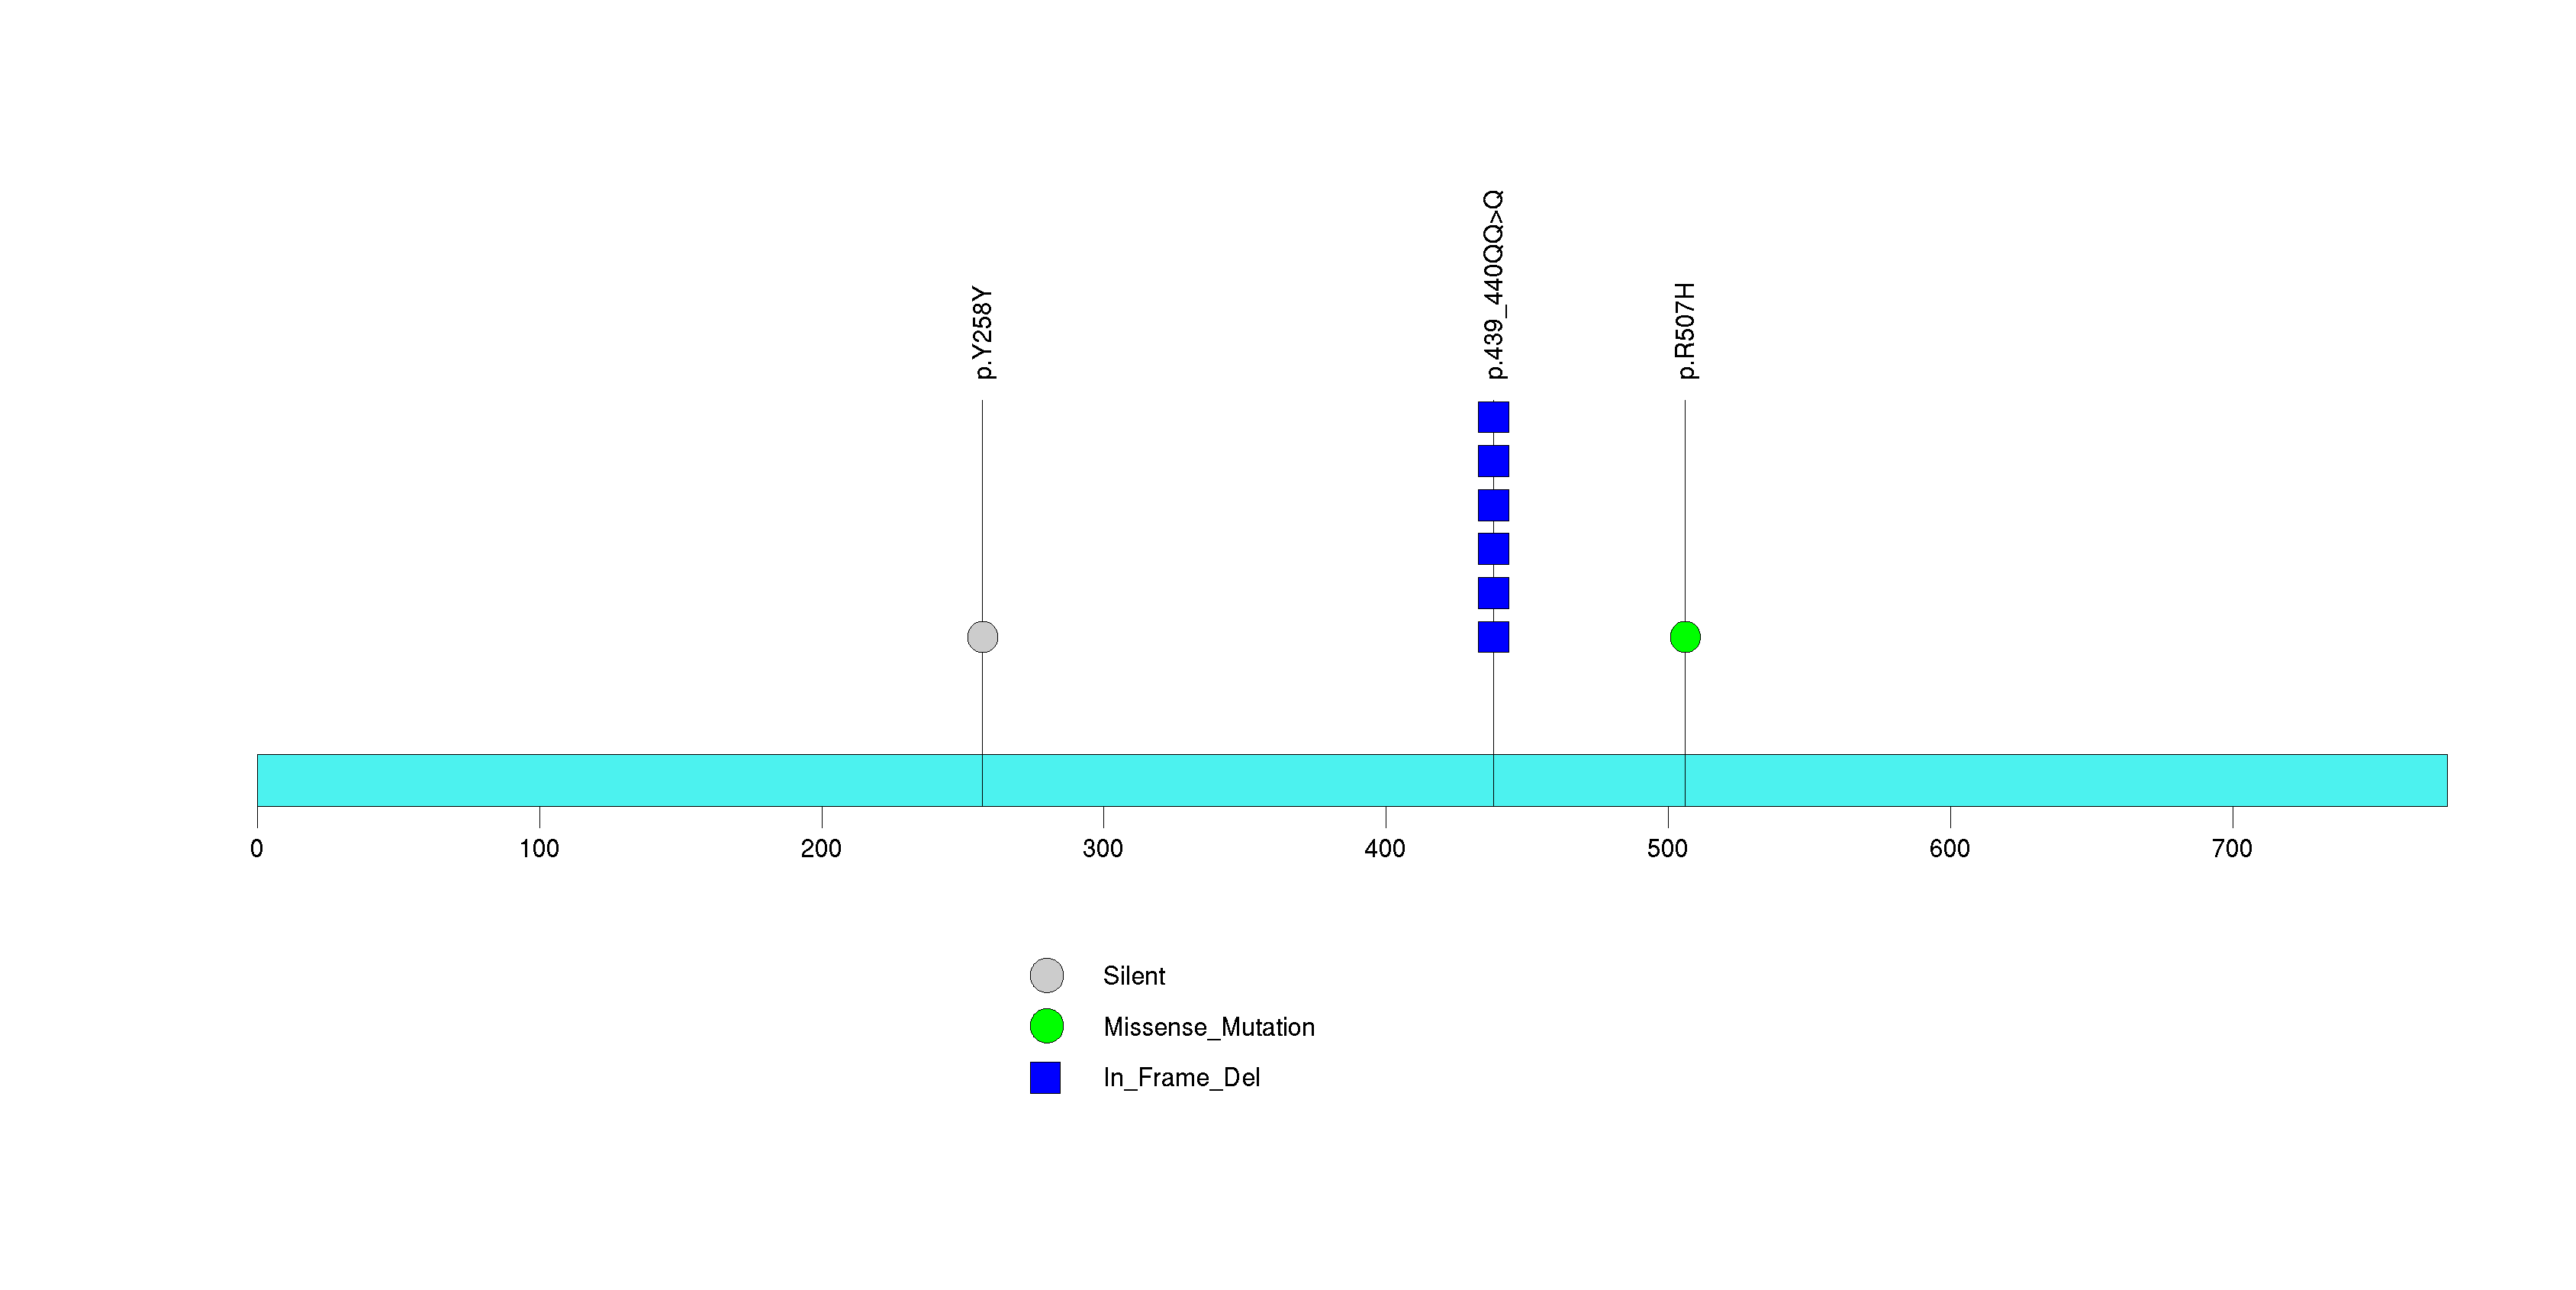
Figure S19. This figure depicts the distribution of mutations and mutation types across the ST6GALNAC5 significant gene.
Figure S20. This figure depicts the distribution of mutations and mutation types across the TNFSF9 significant gene.
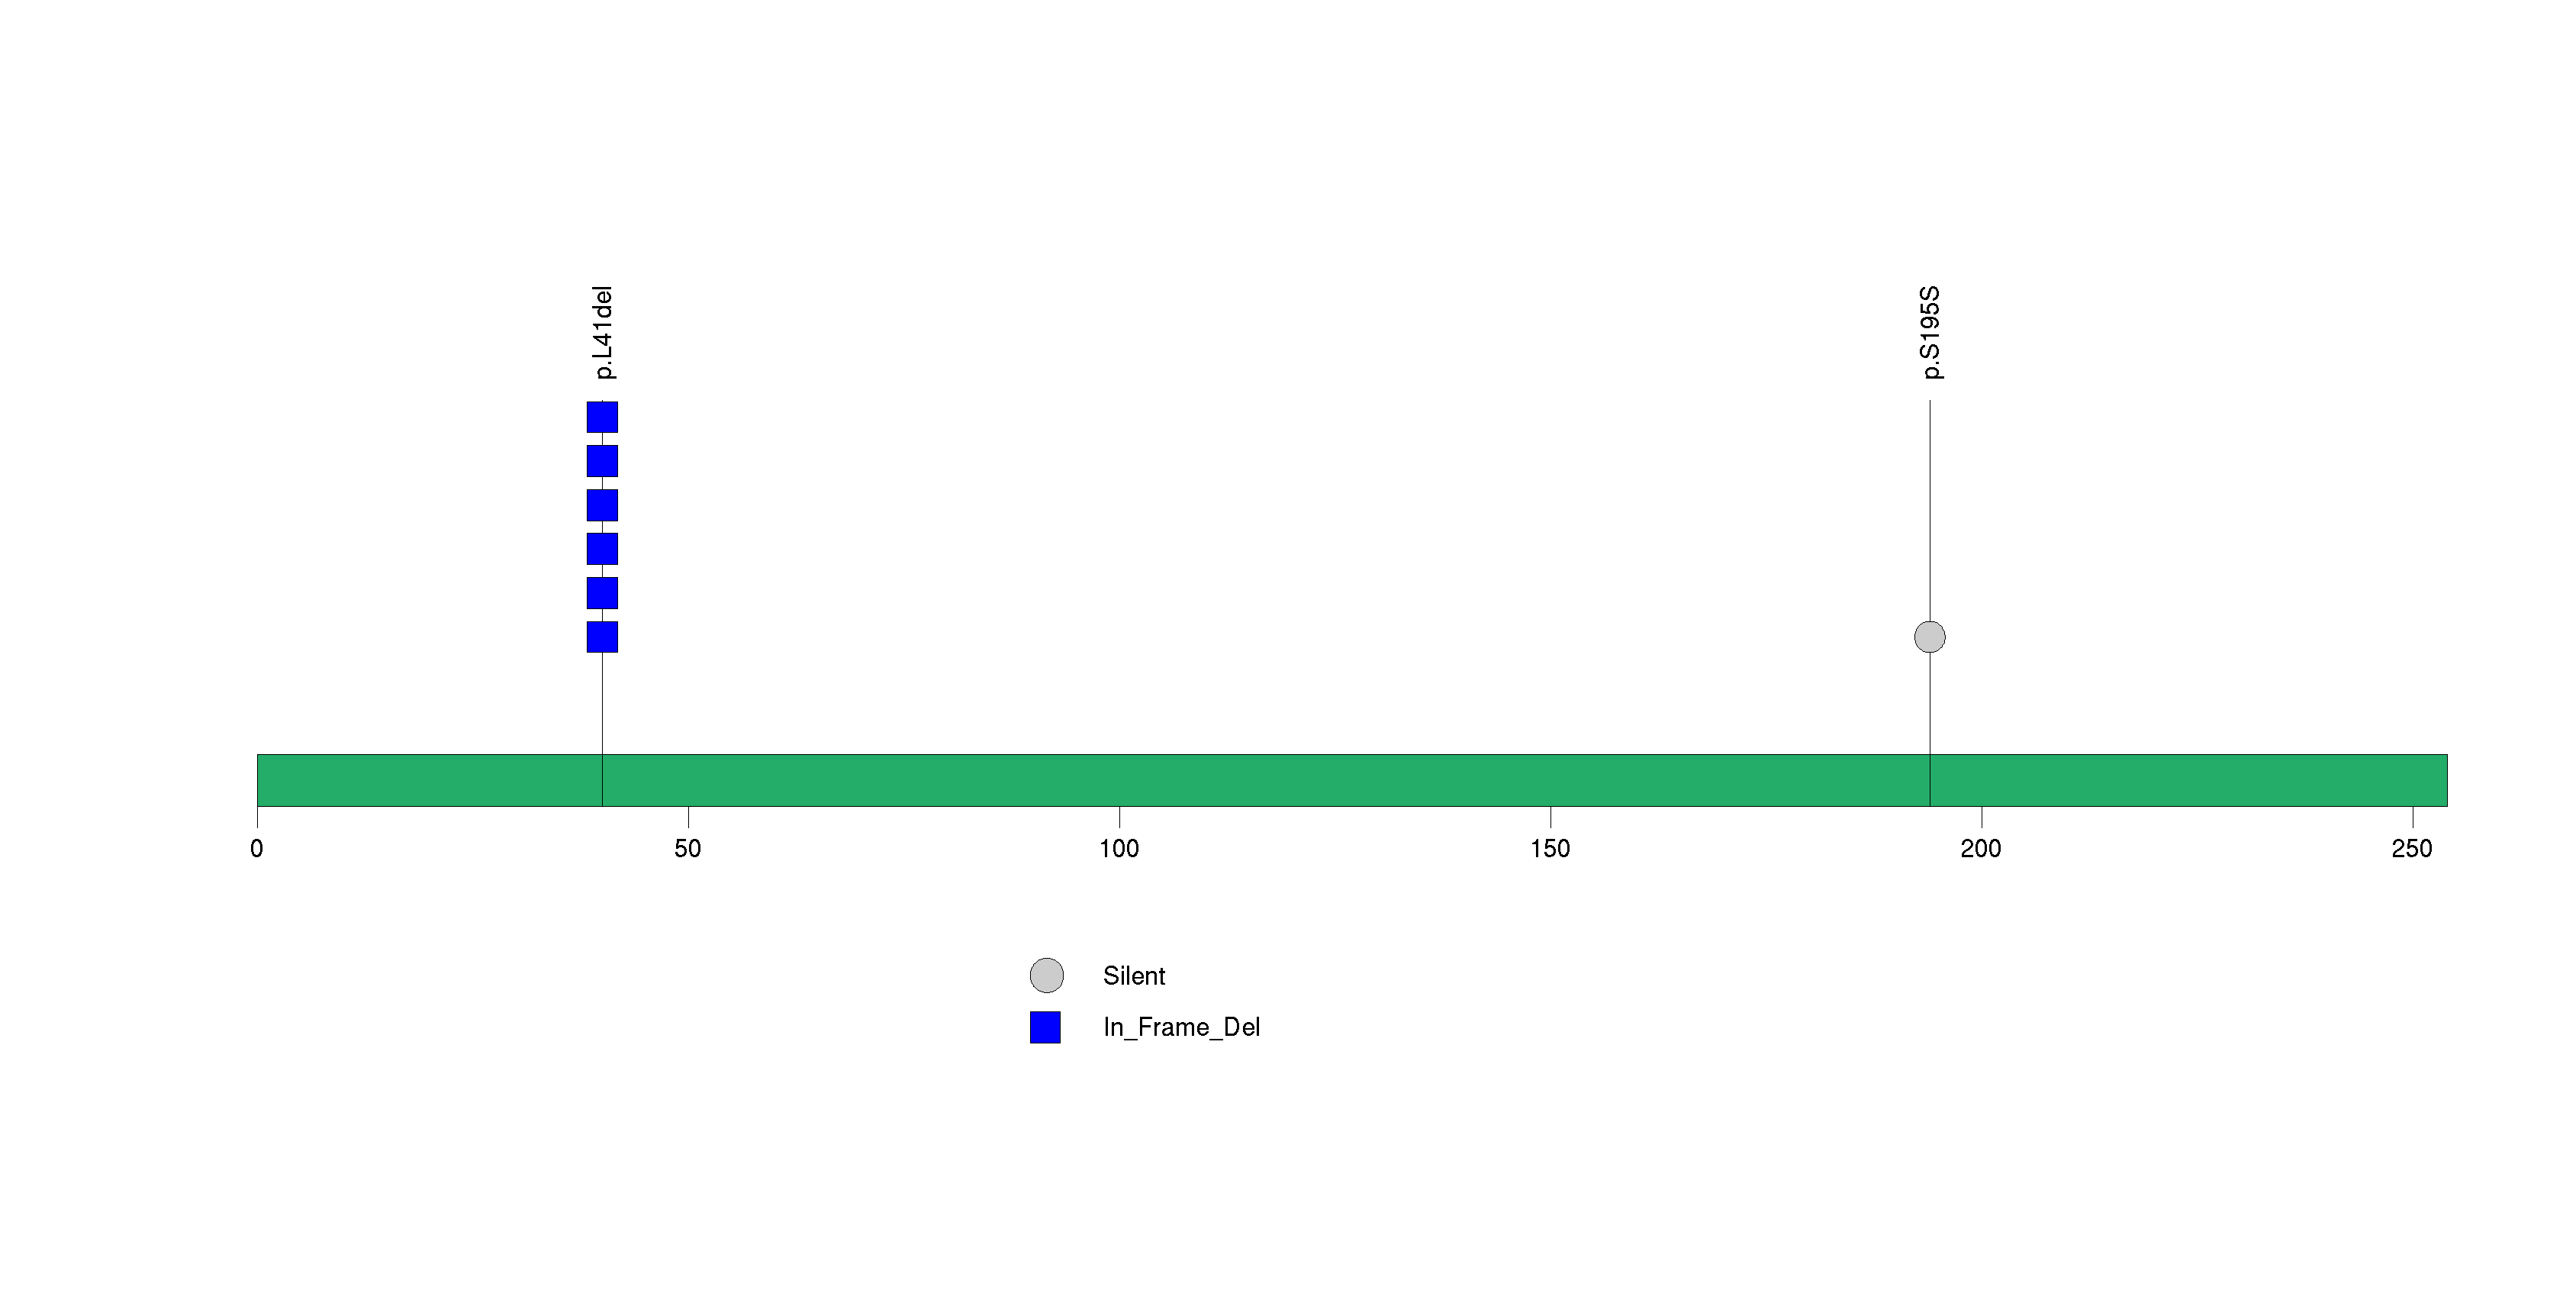
Figure S21. This figure depicts the distribution of mutations and mutation types across the CDKN2A significant gene.
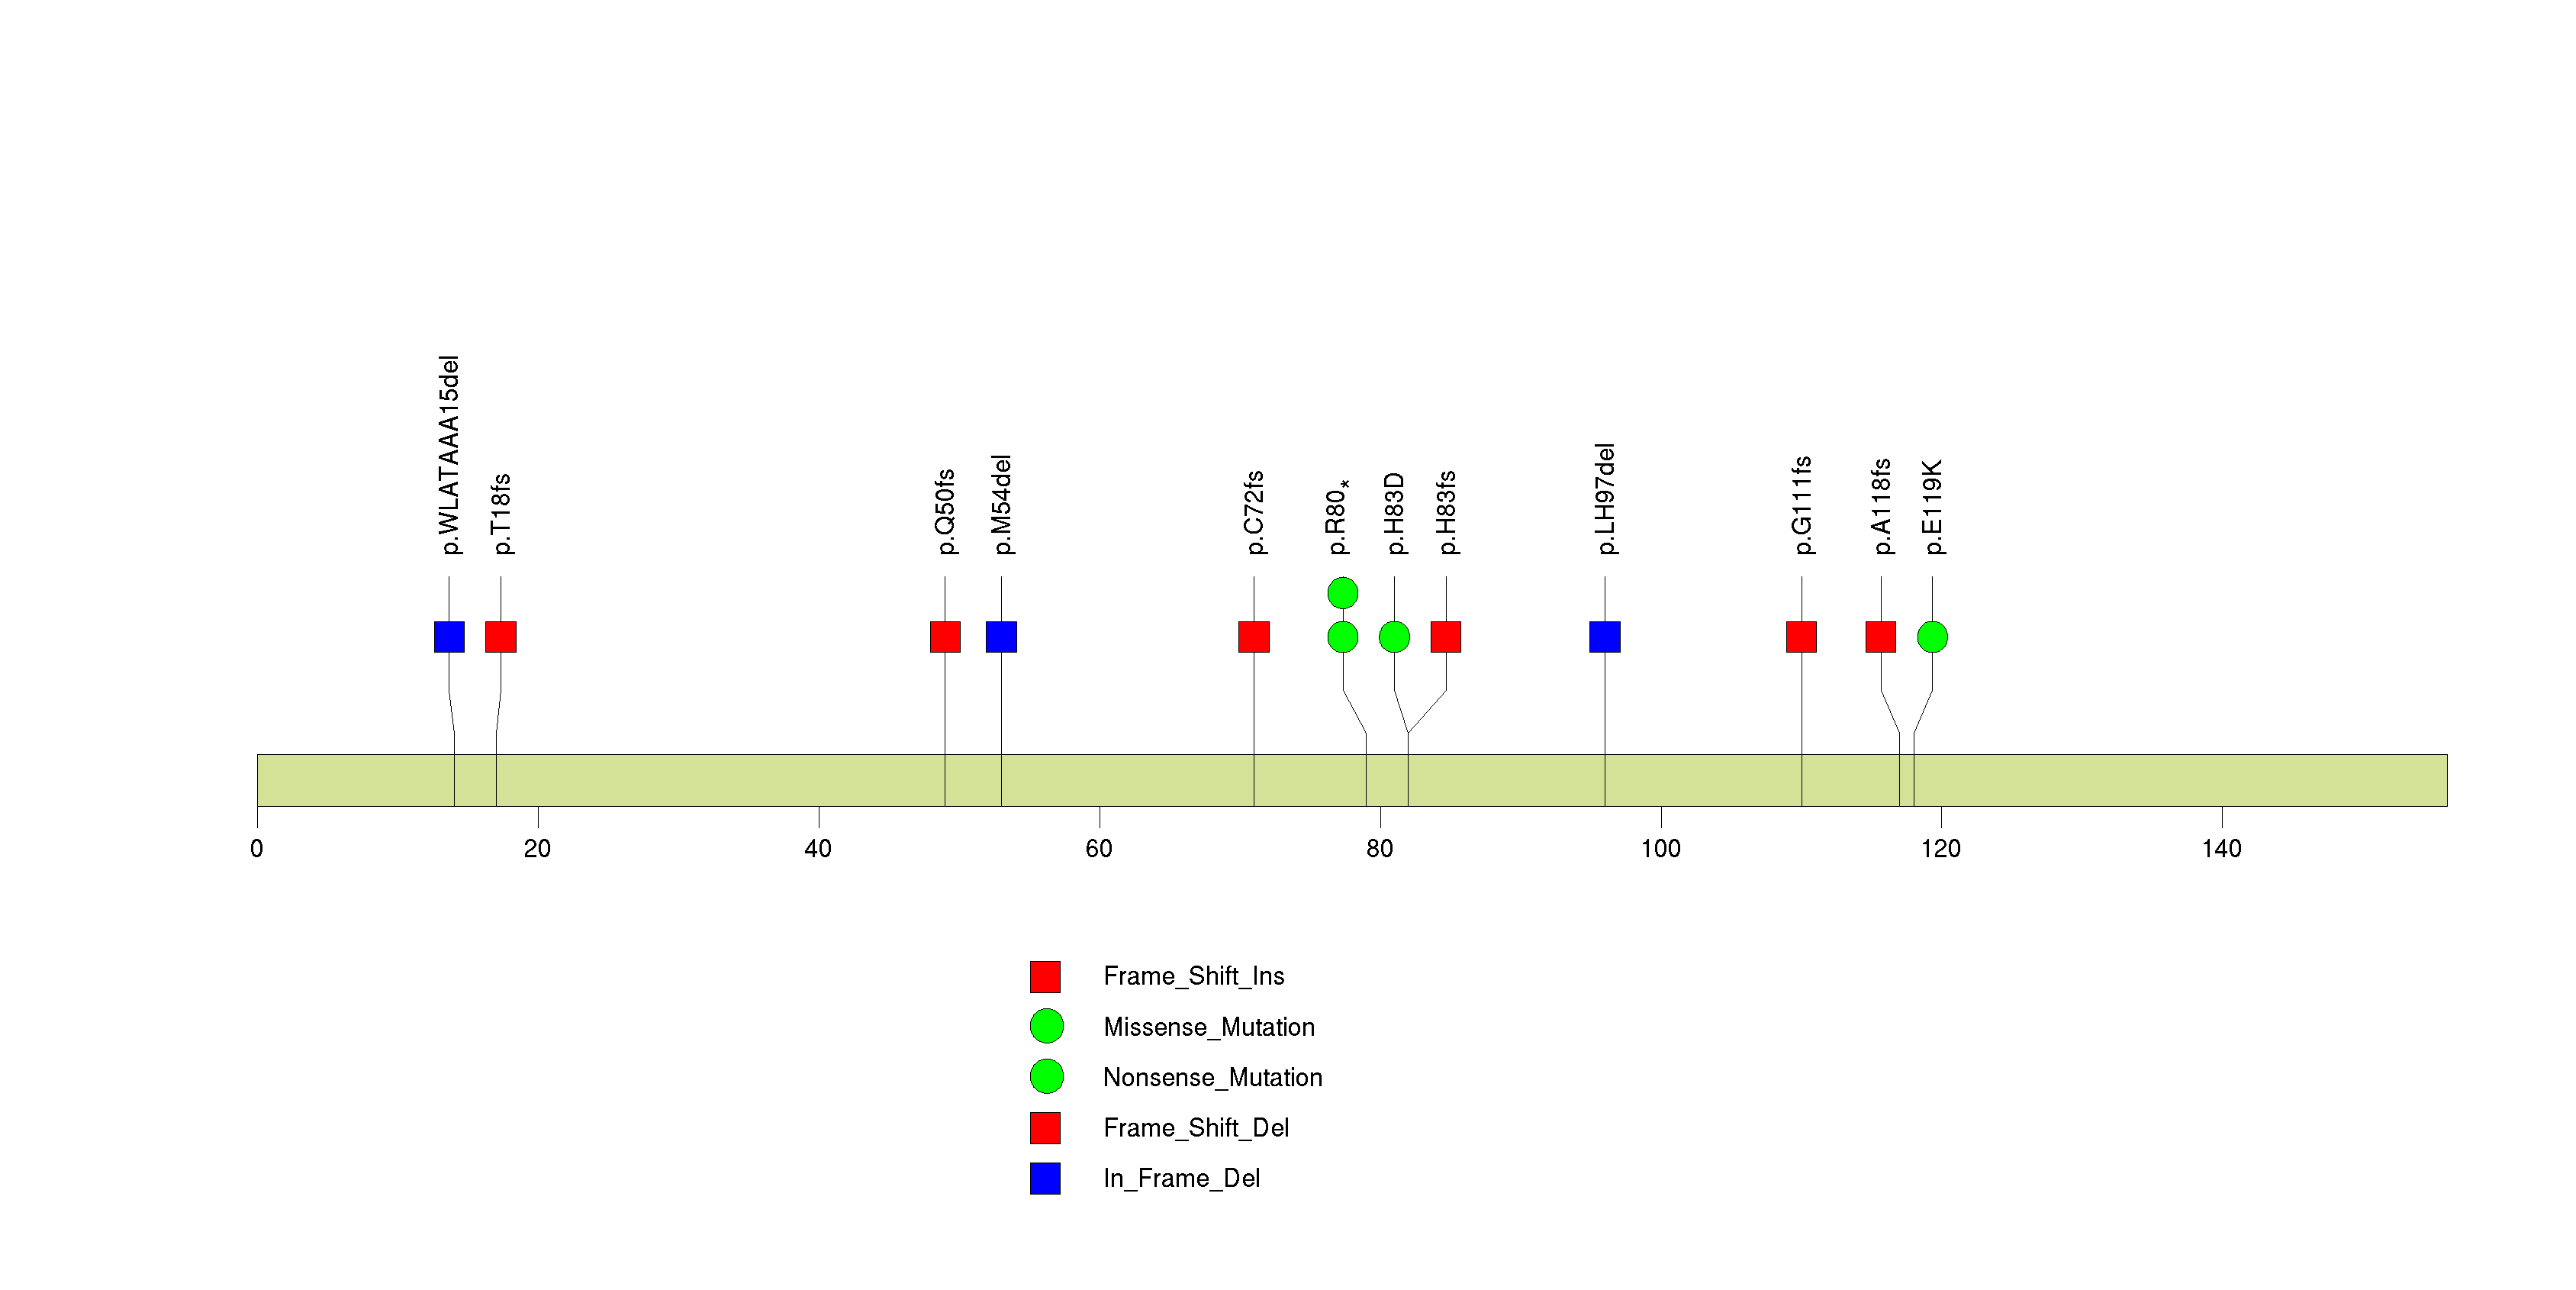
Figure S22. This figure depicts the distribution of mutations and mutation types across the SEH1L significant gene.
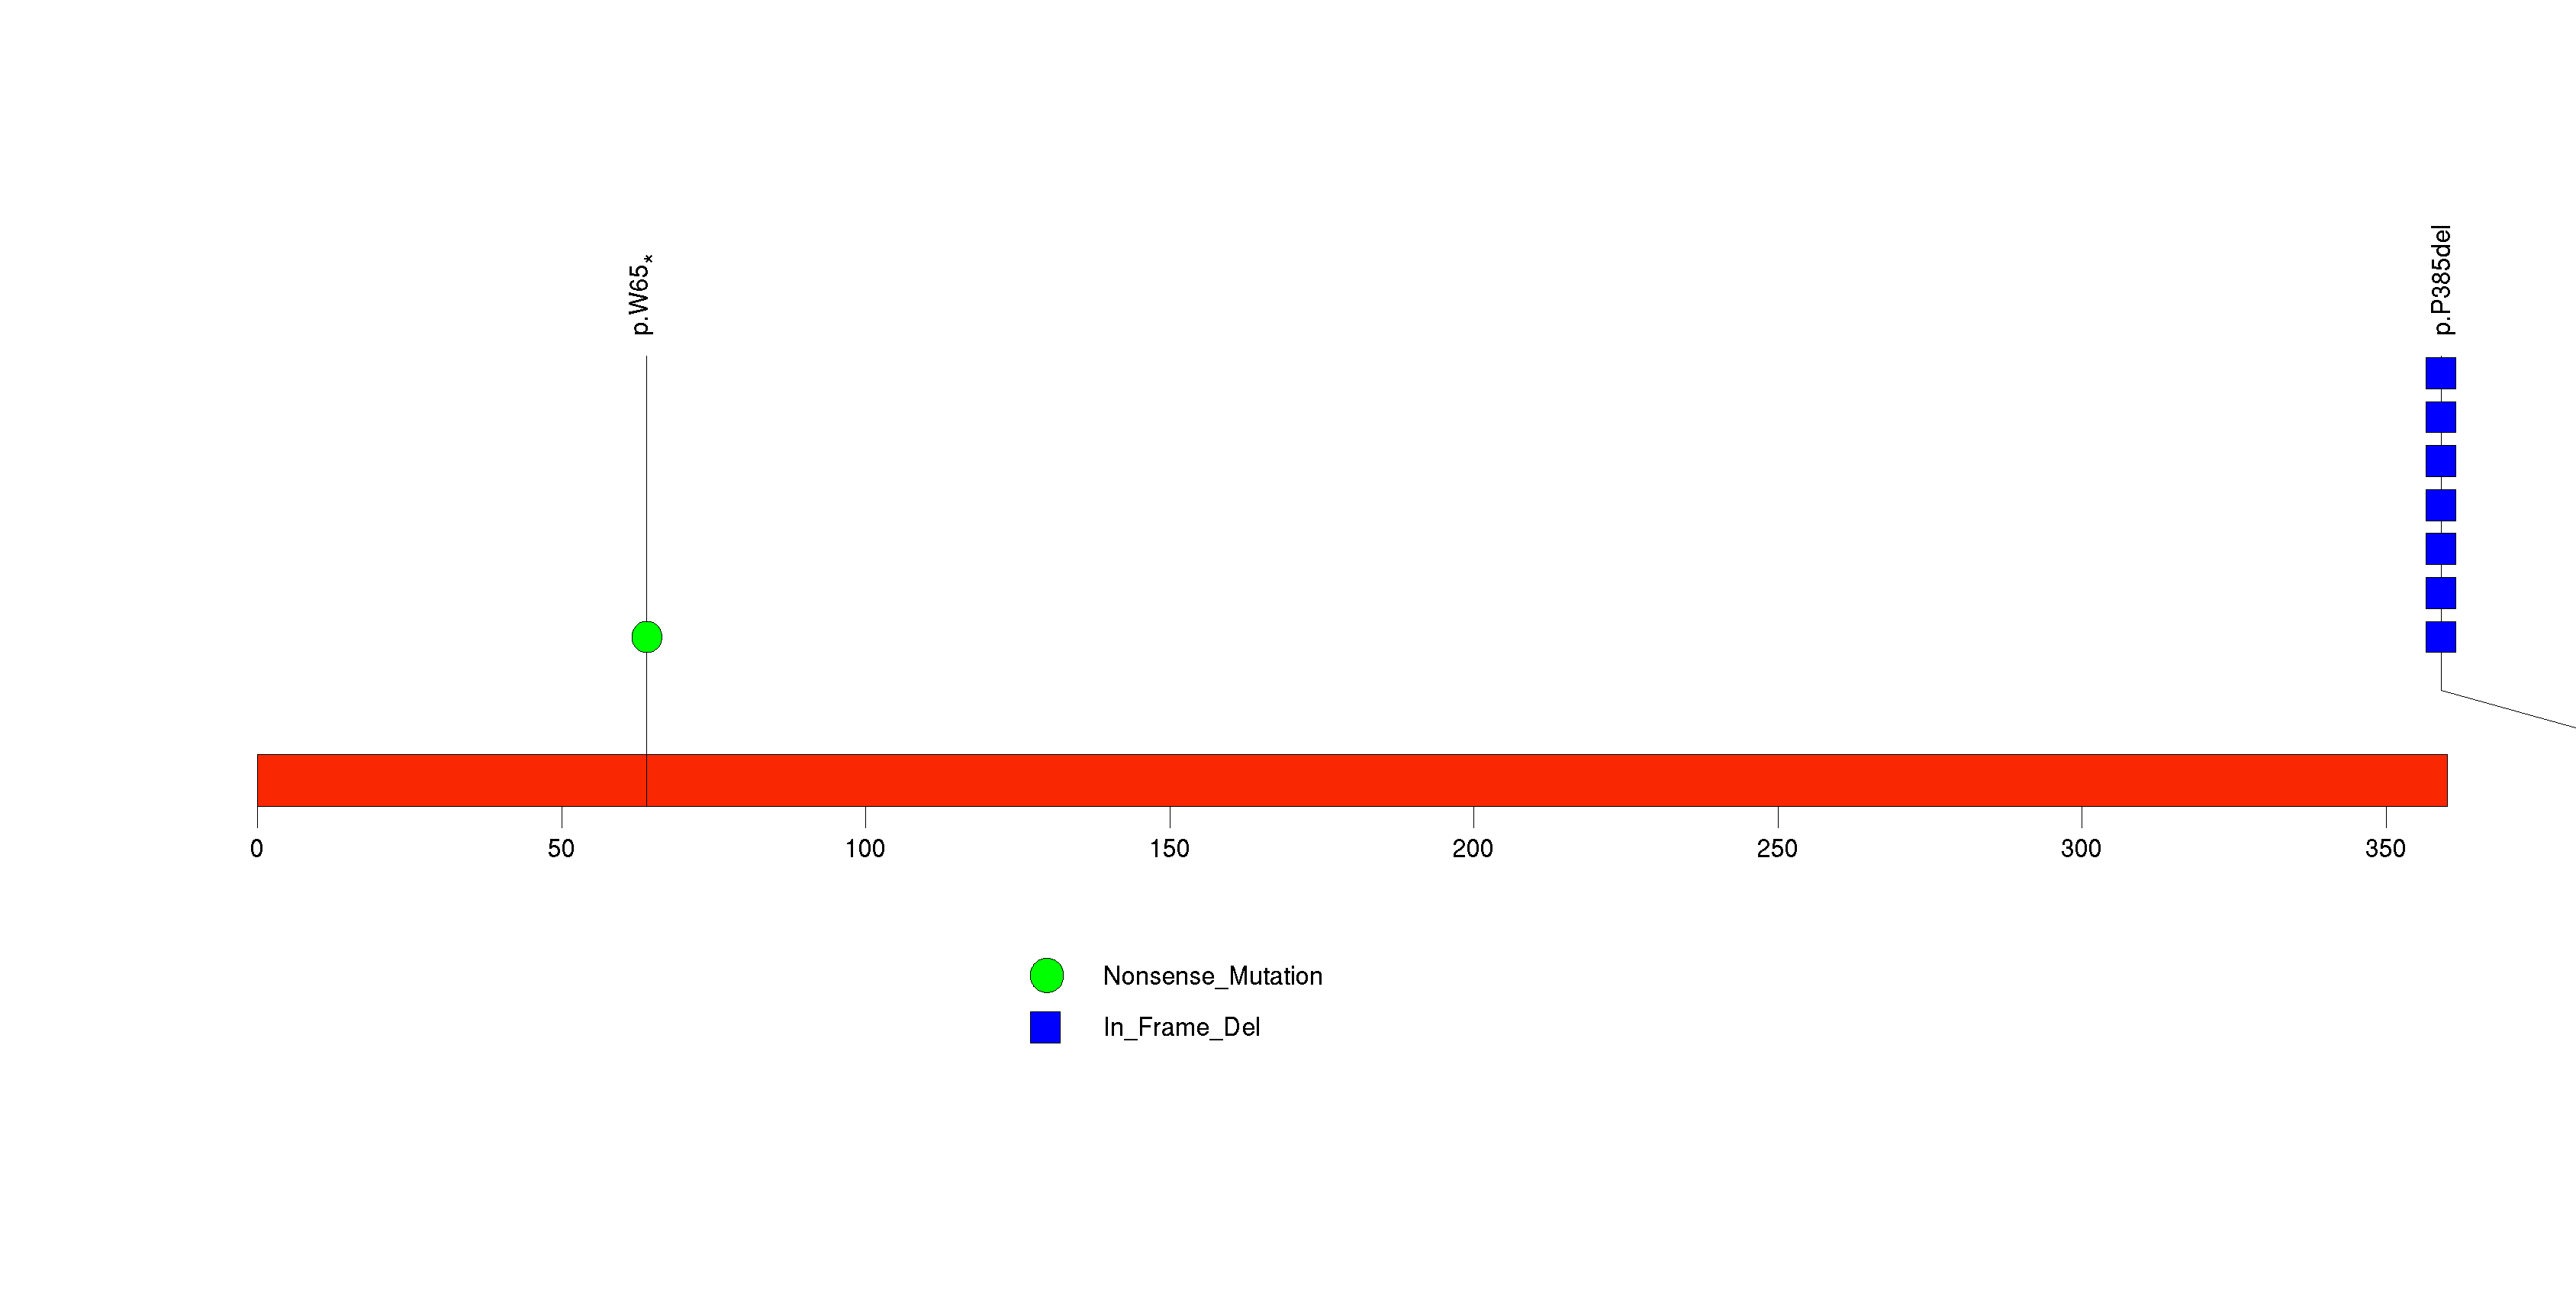
Figure S23. This figure depicts the distribution of mutations and mutation types across the SCD significant gene.
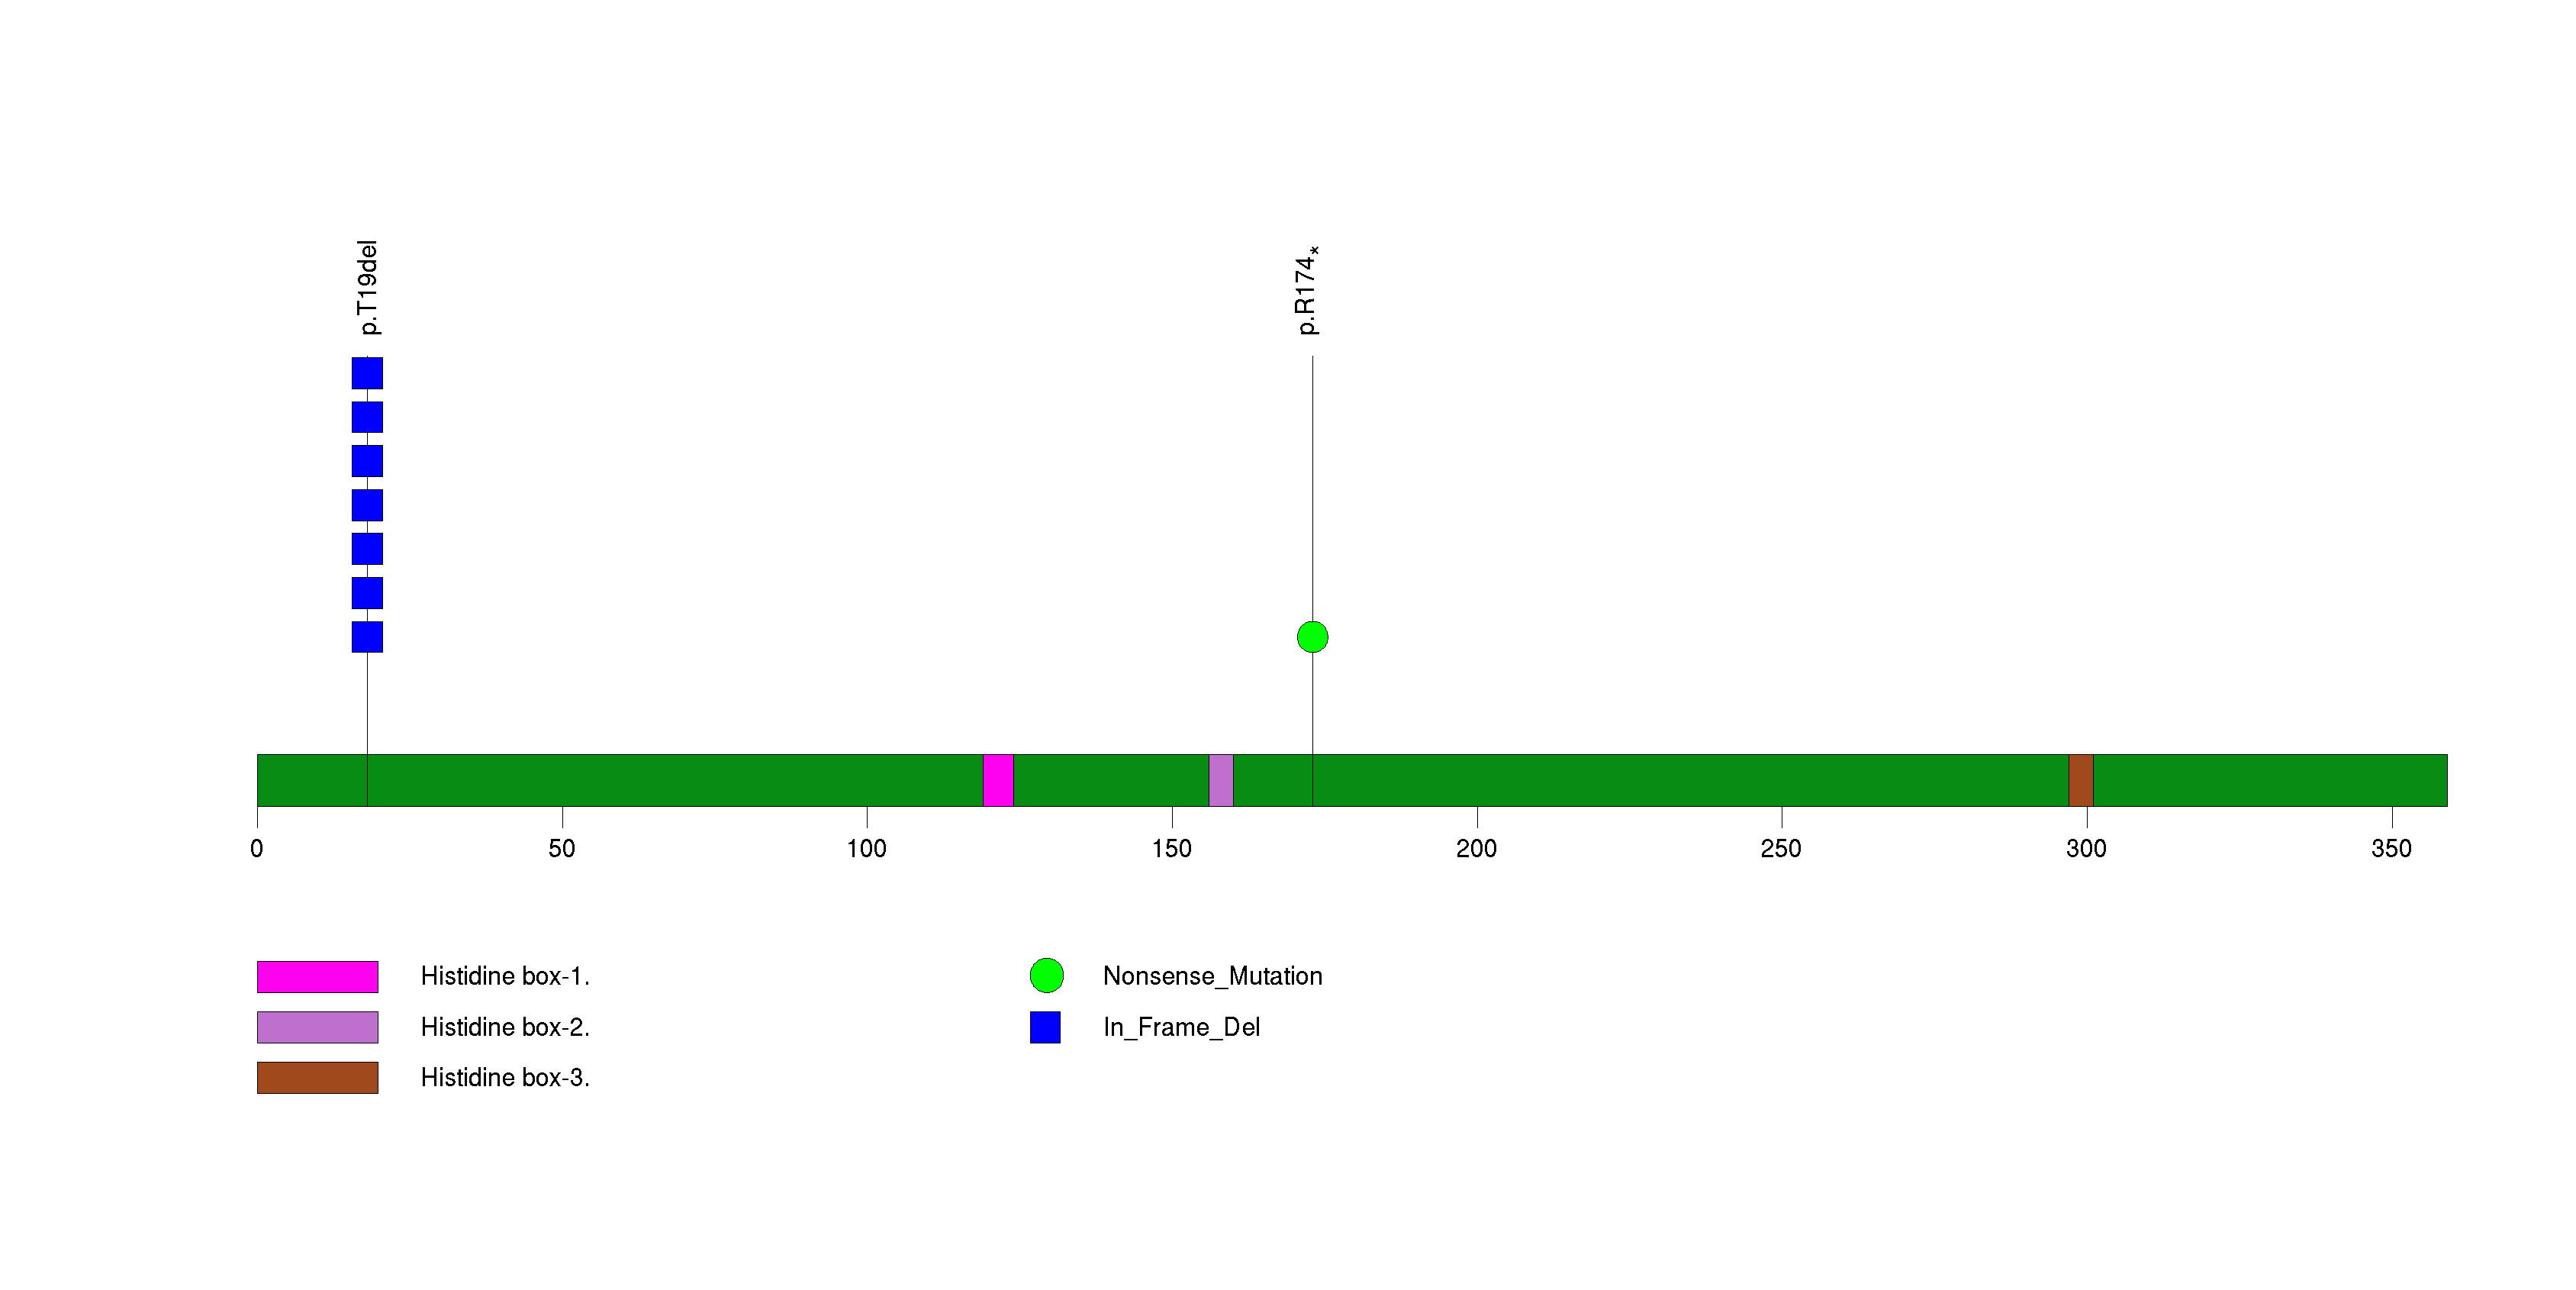
Figure S24. This figure depicts the distribution of mutations and mutation types across the TMC4 significant gene.
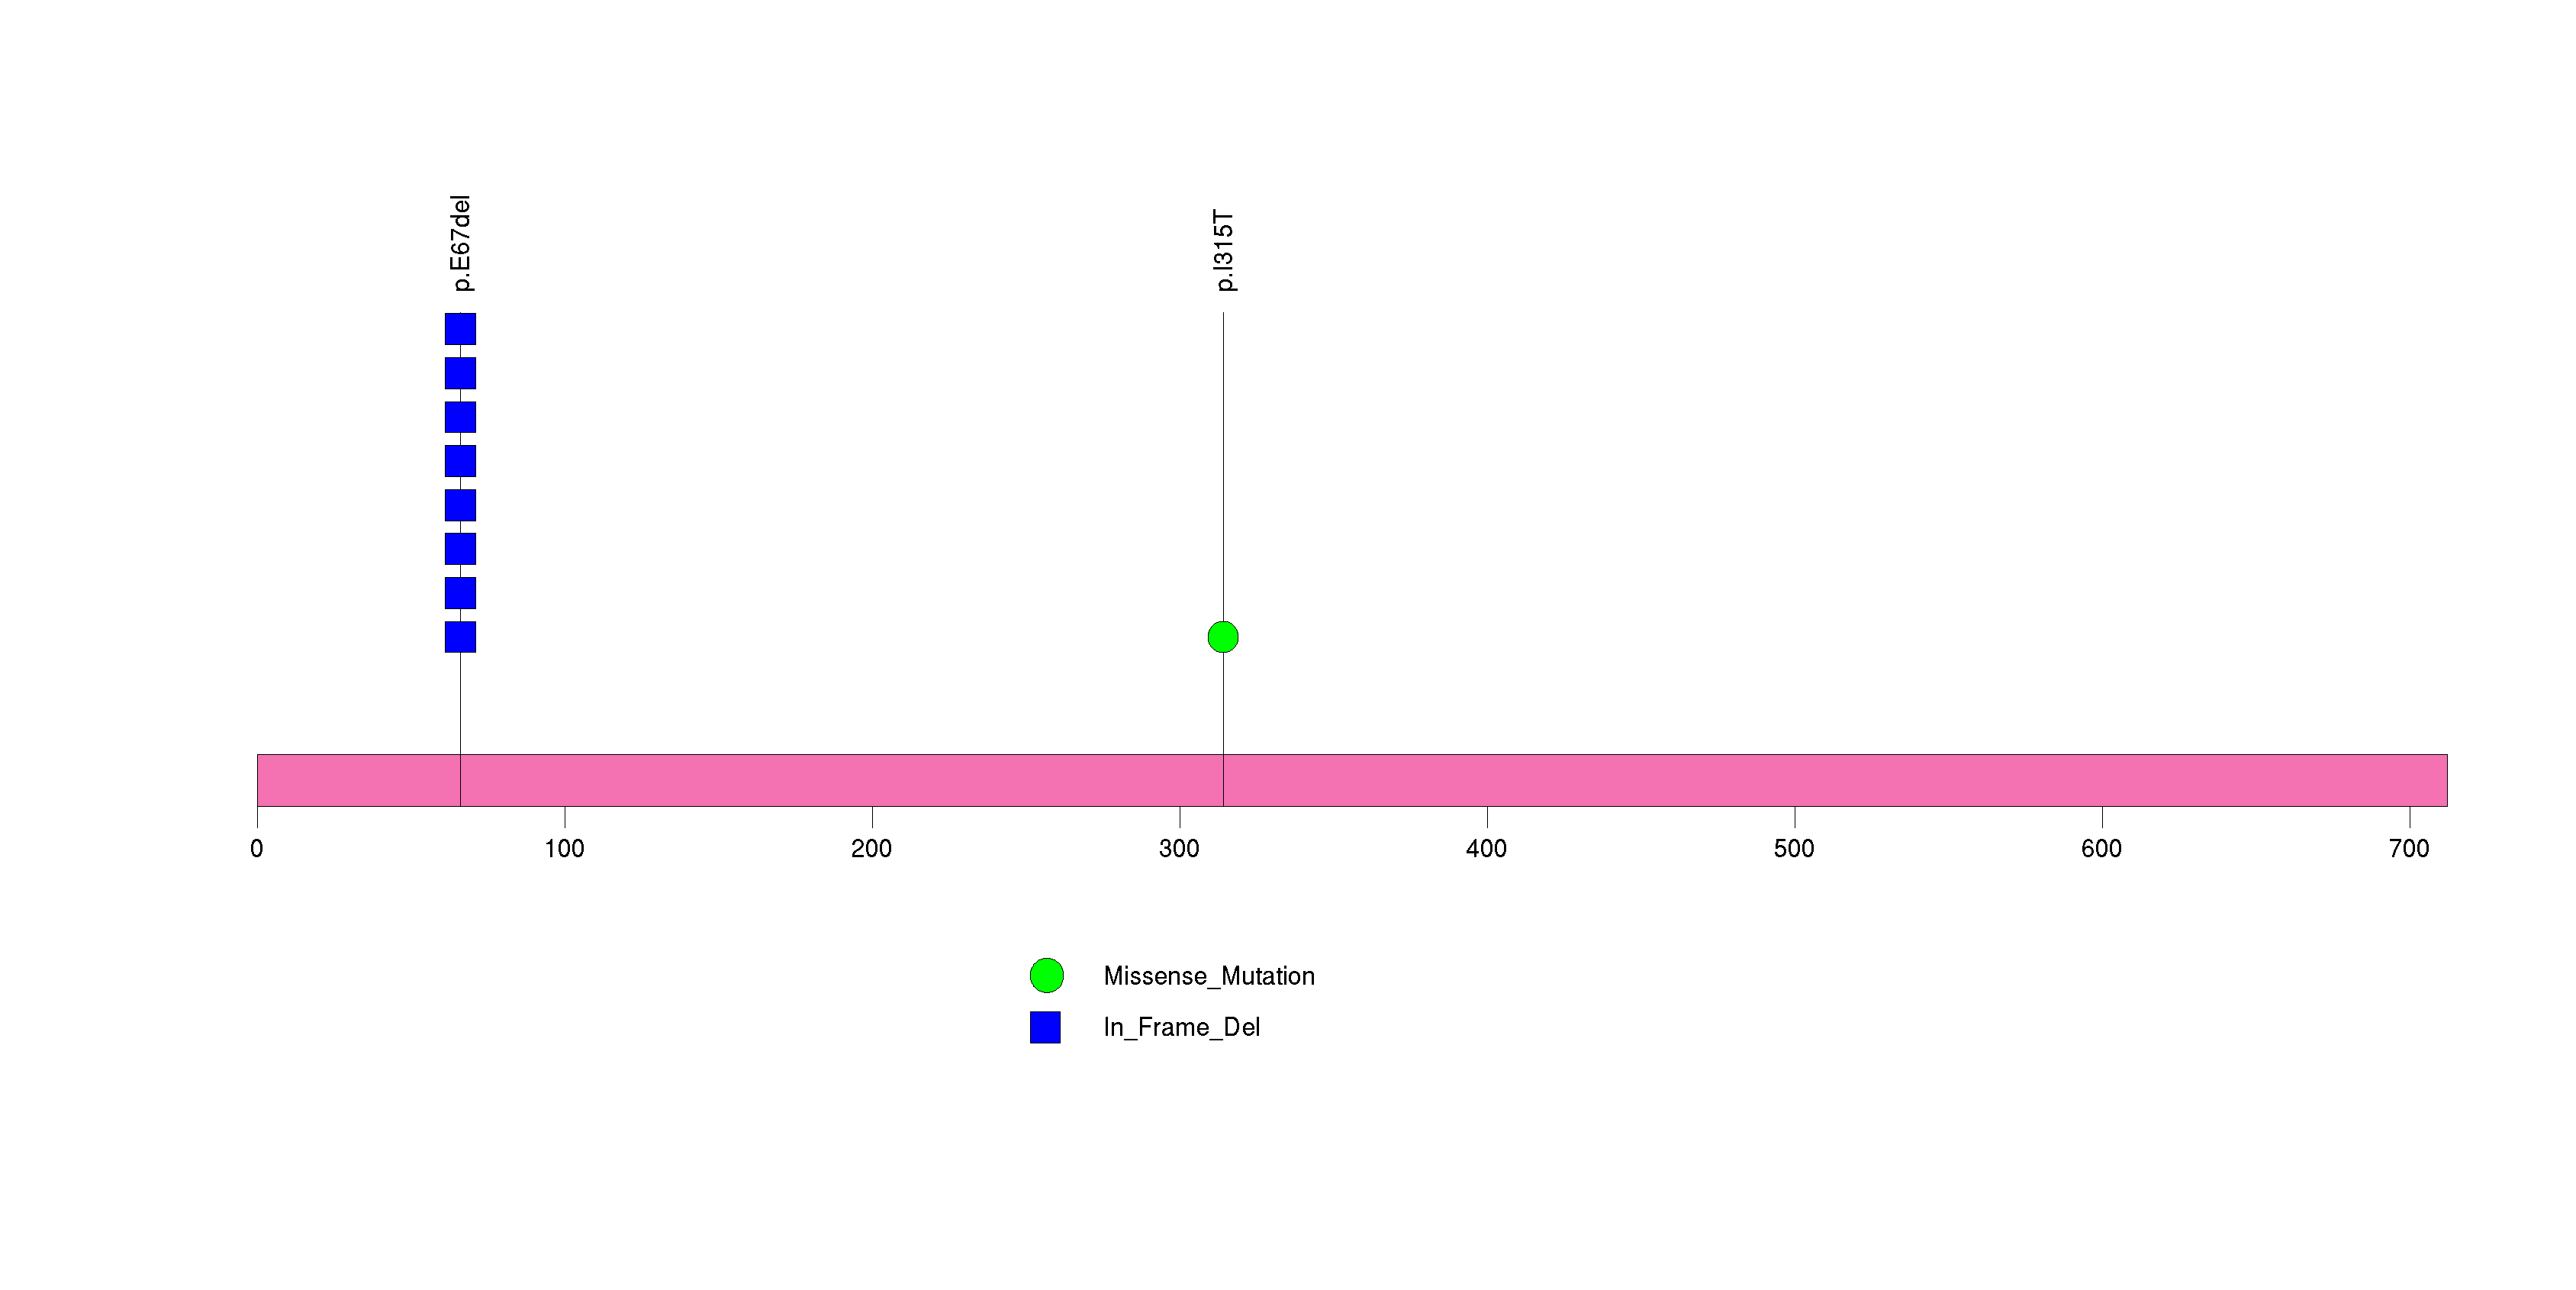
Figure S25. This figure depicts the distribution of mutations and mutation types across the MED15 significant gene.
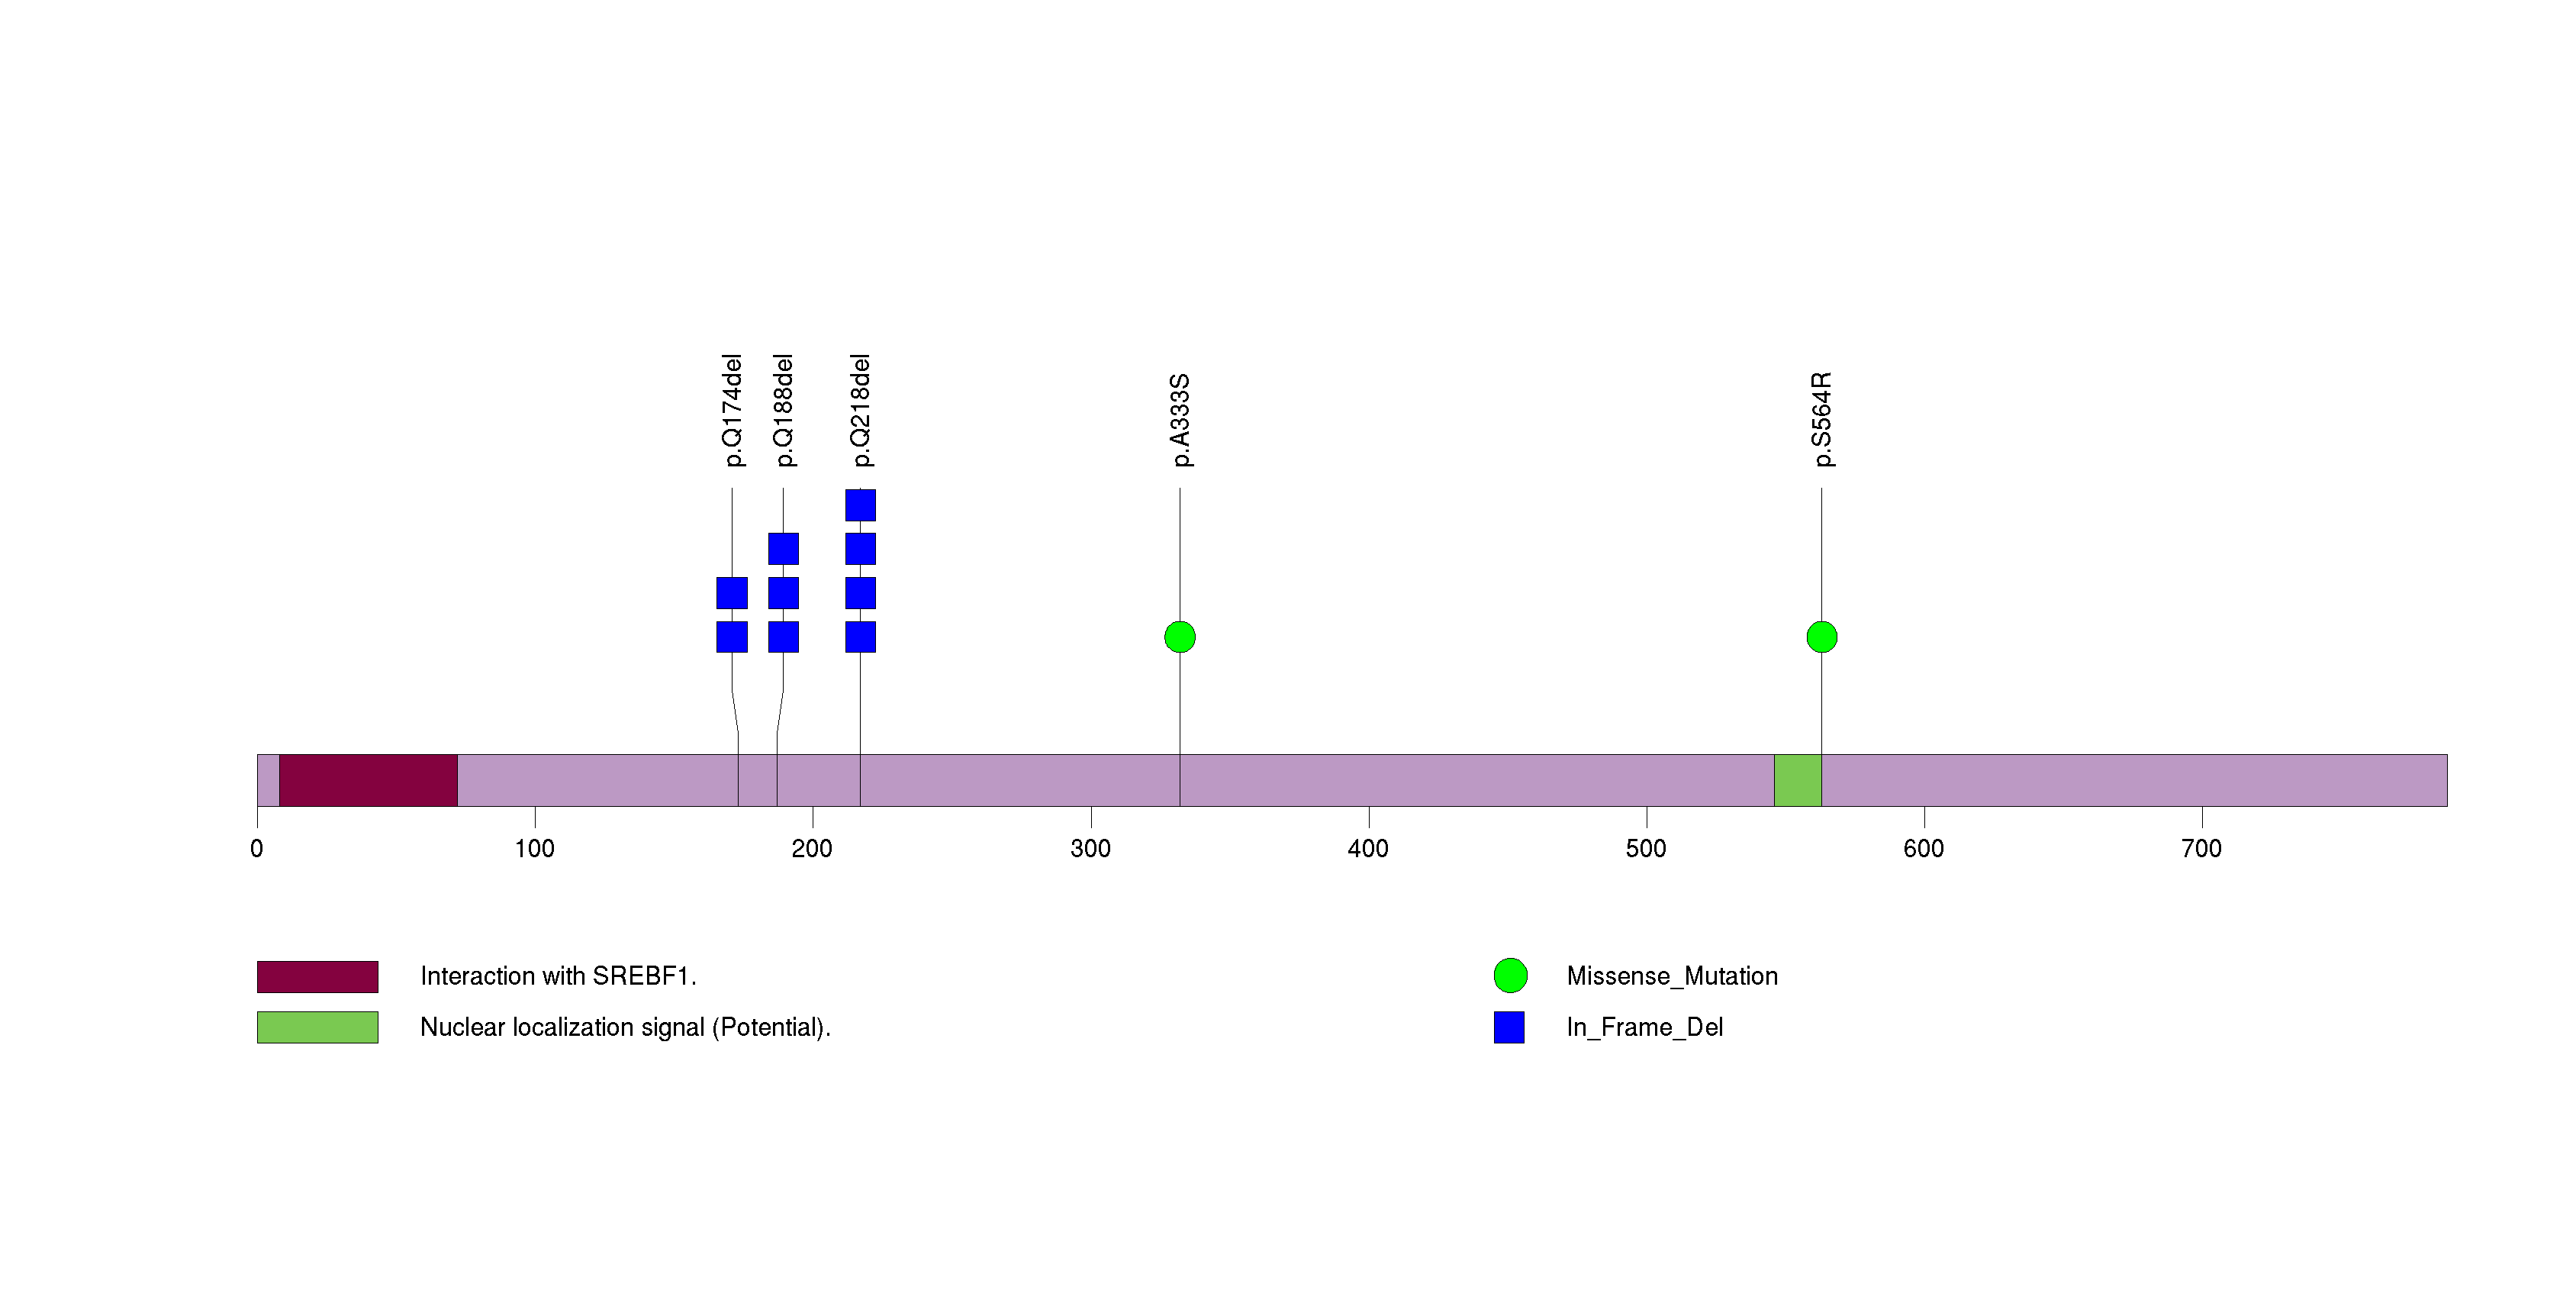
Figure S26. This figure depicts the distribution of mutations and mutation types across the TNFRSF9 significant gene.
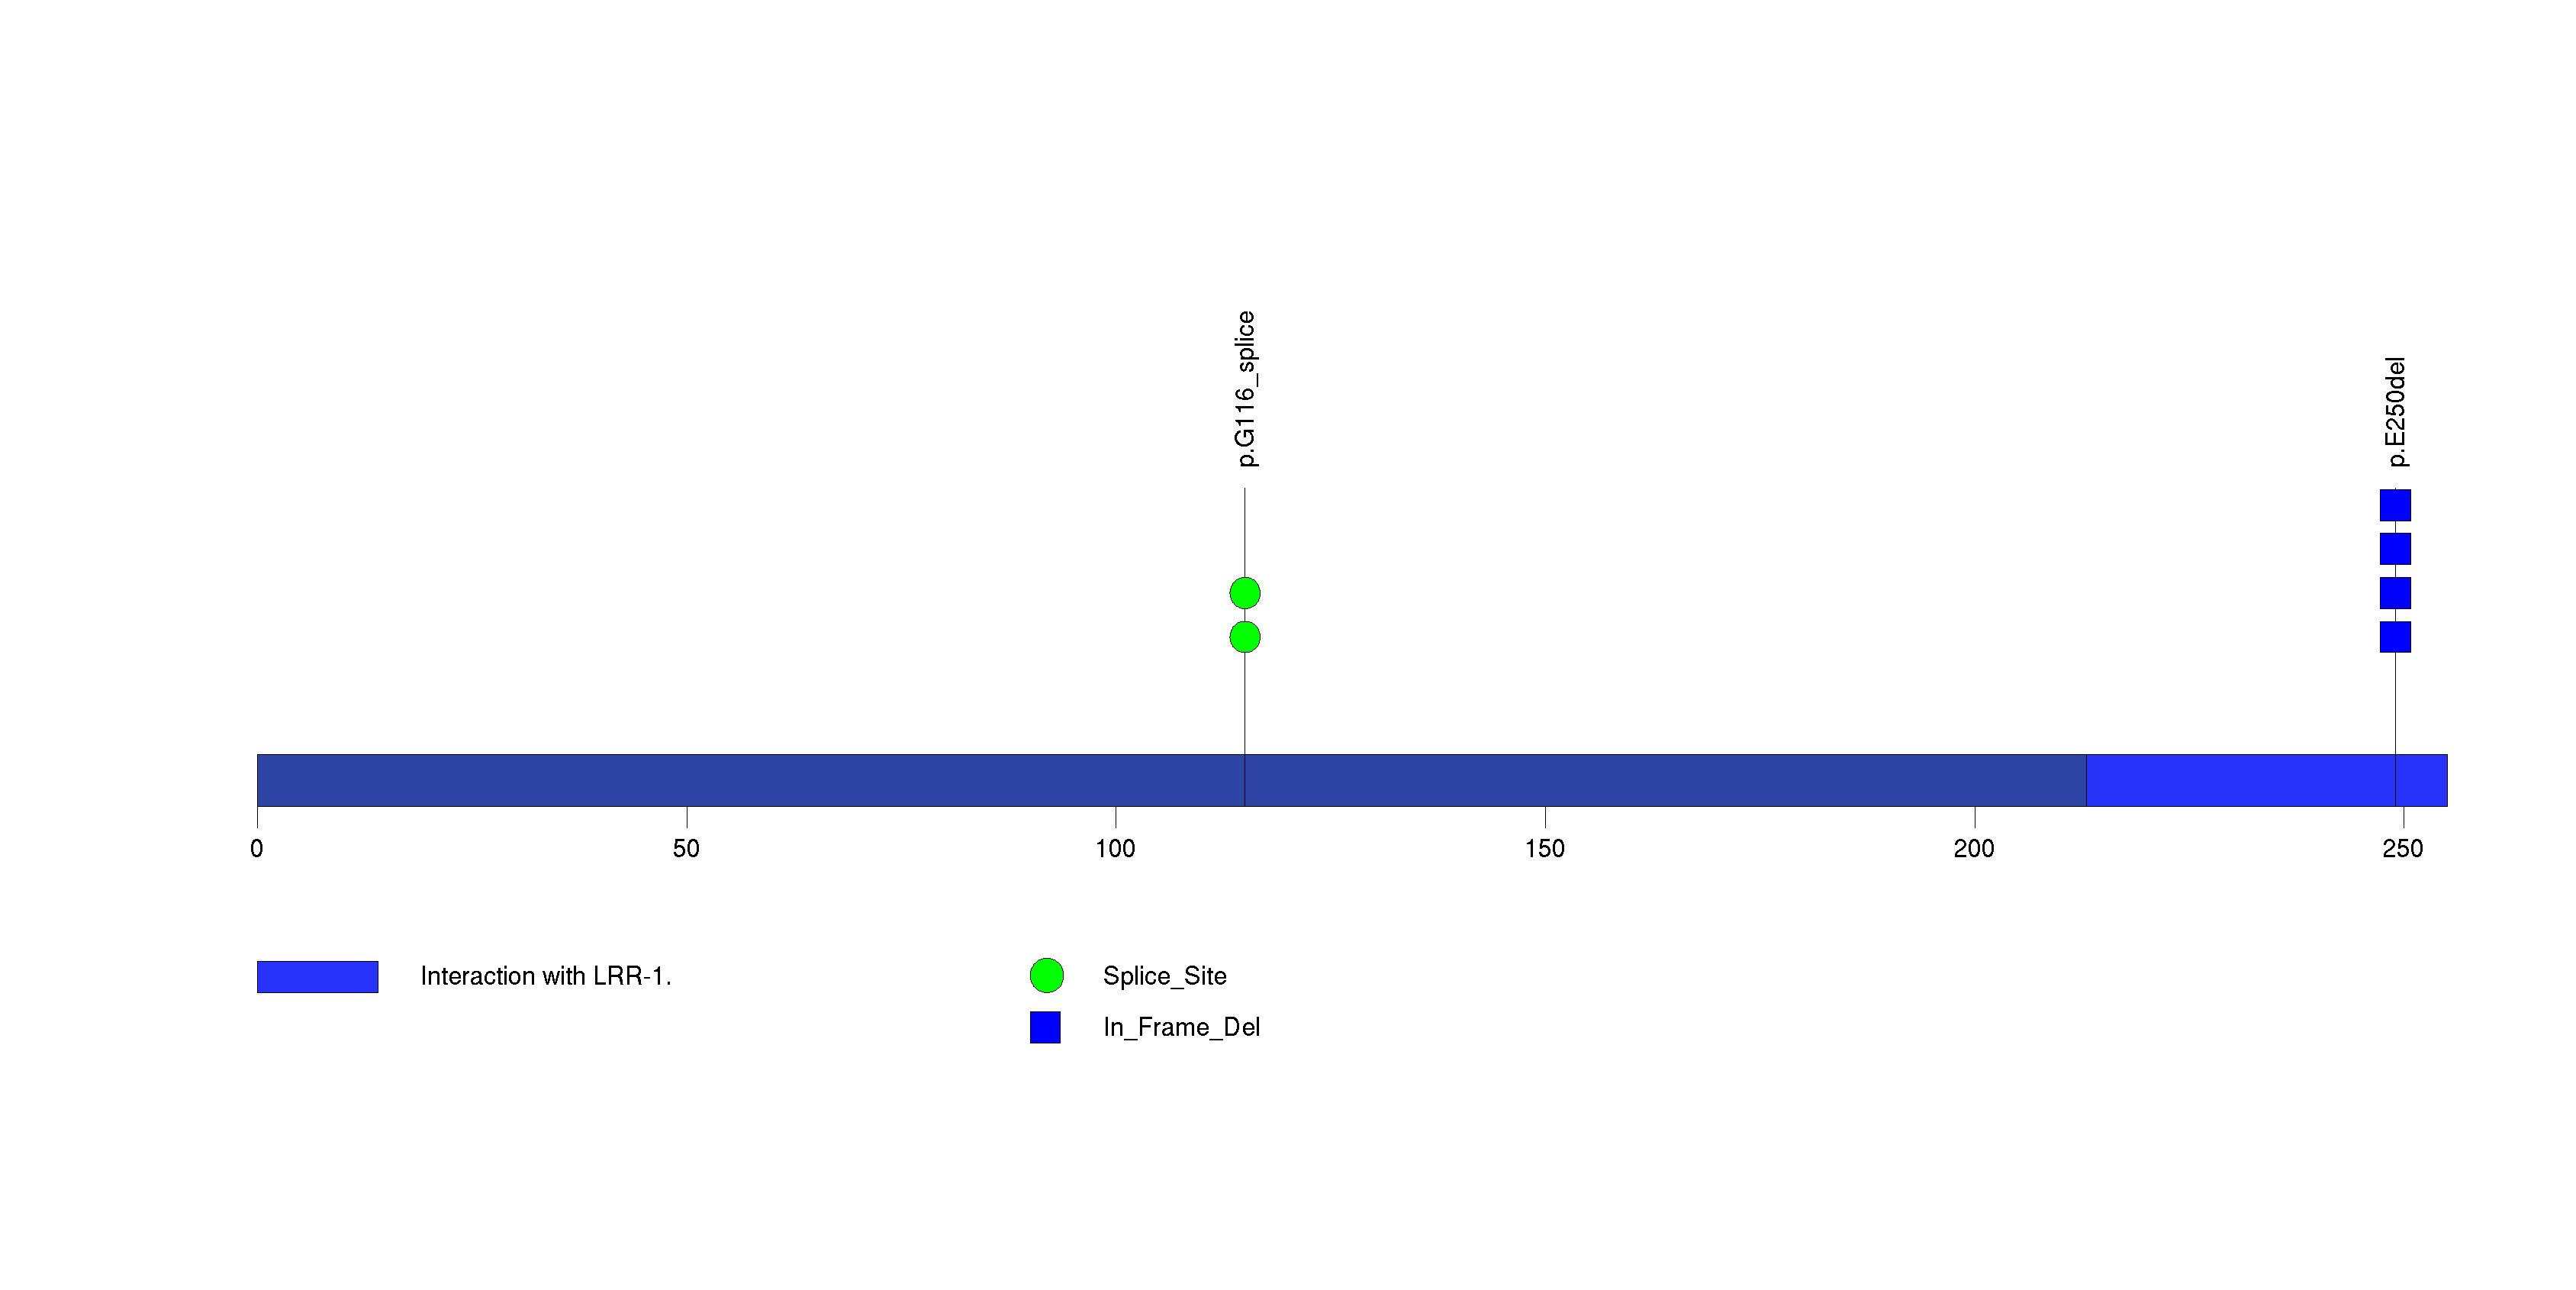
Figure S27. This figure depicts the distribution of mutations and mutation types across the BRDT significant gene.
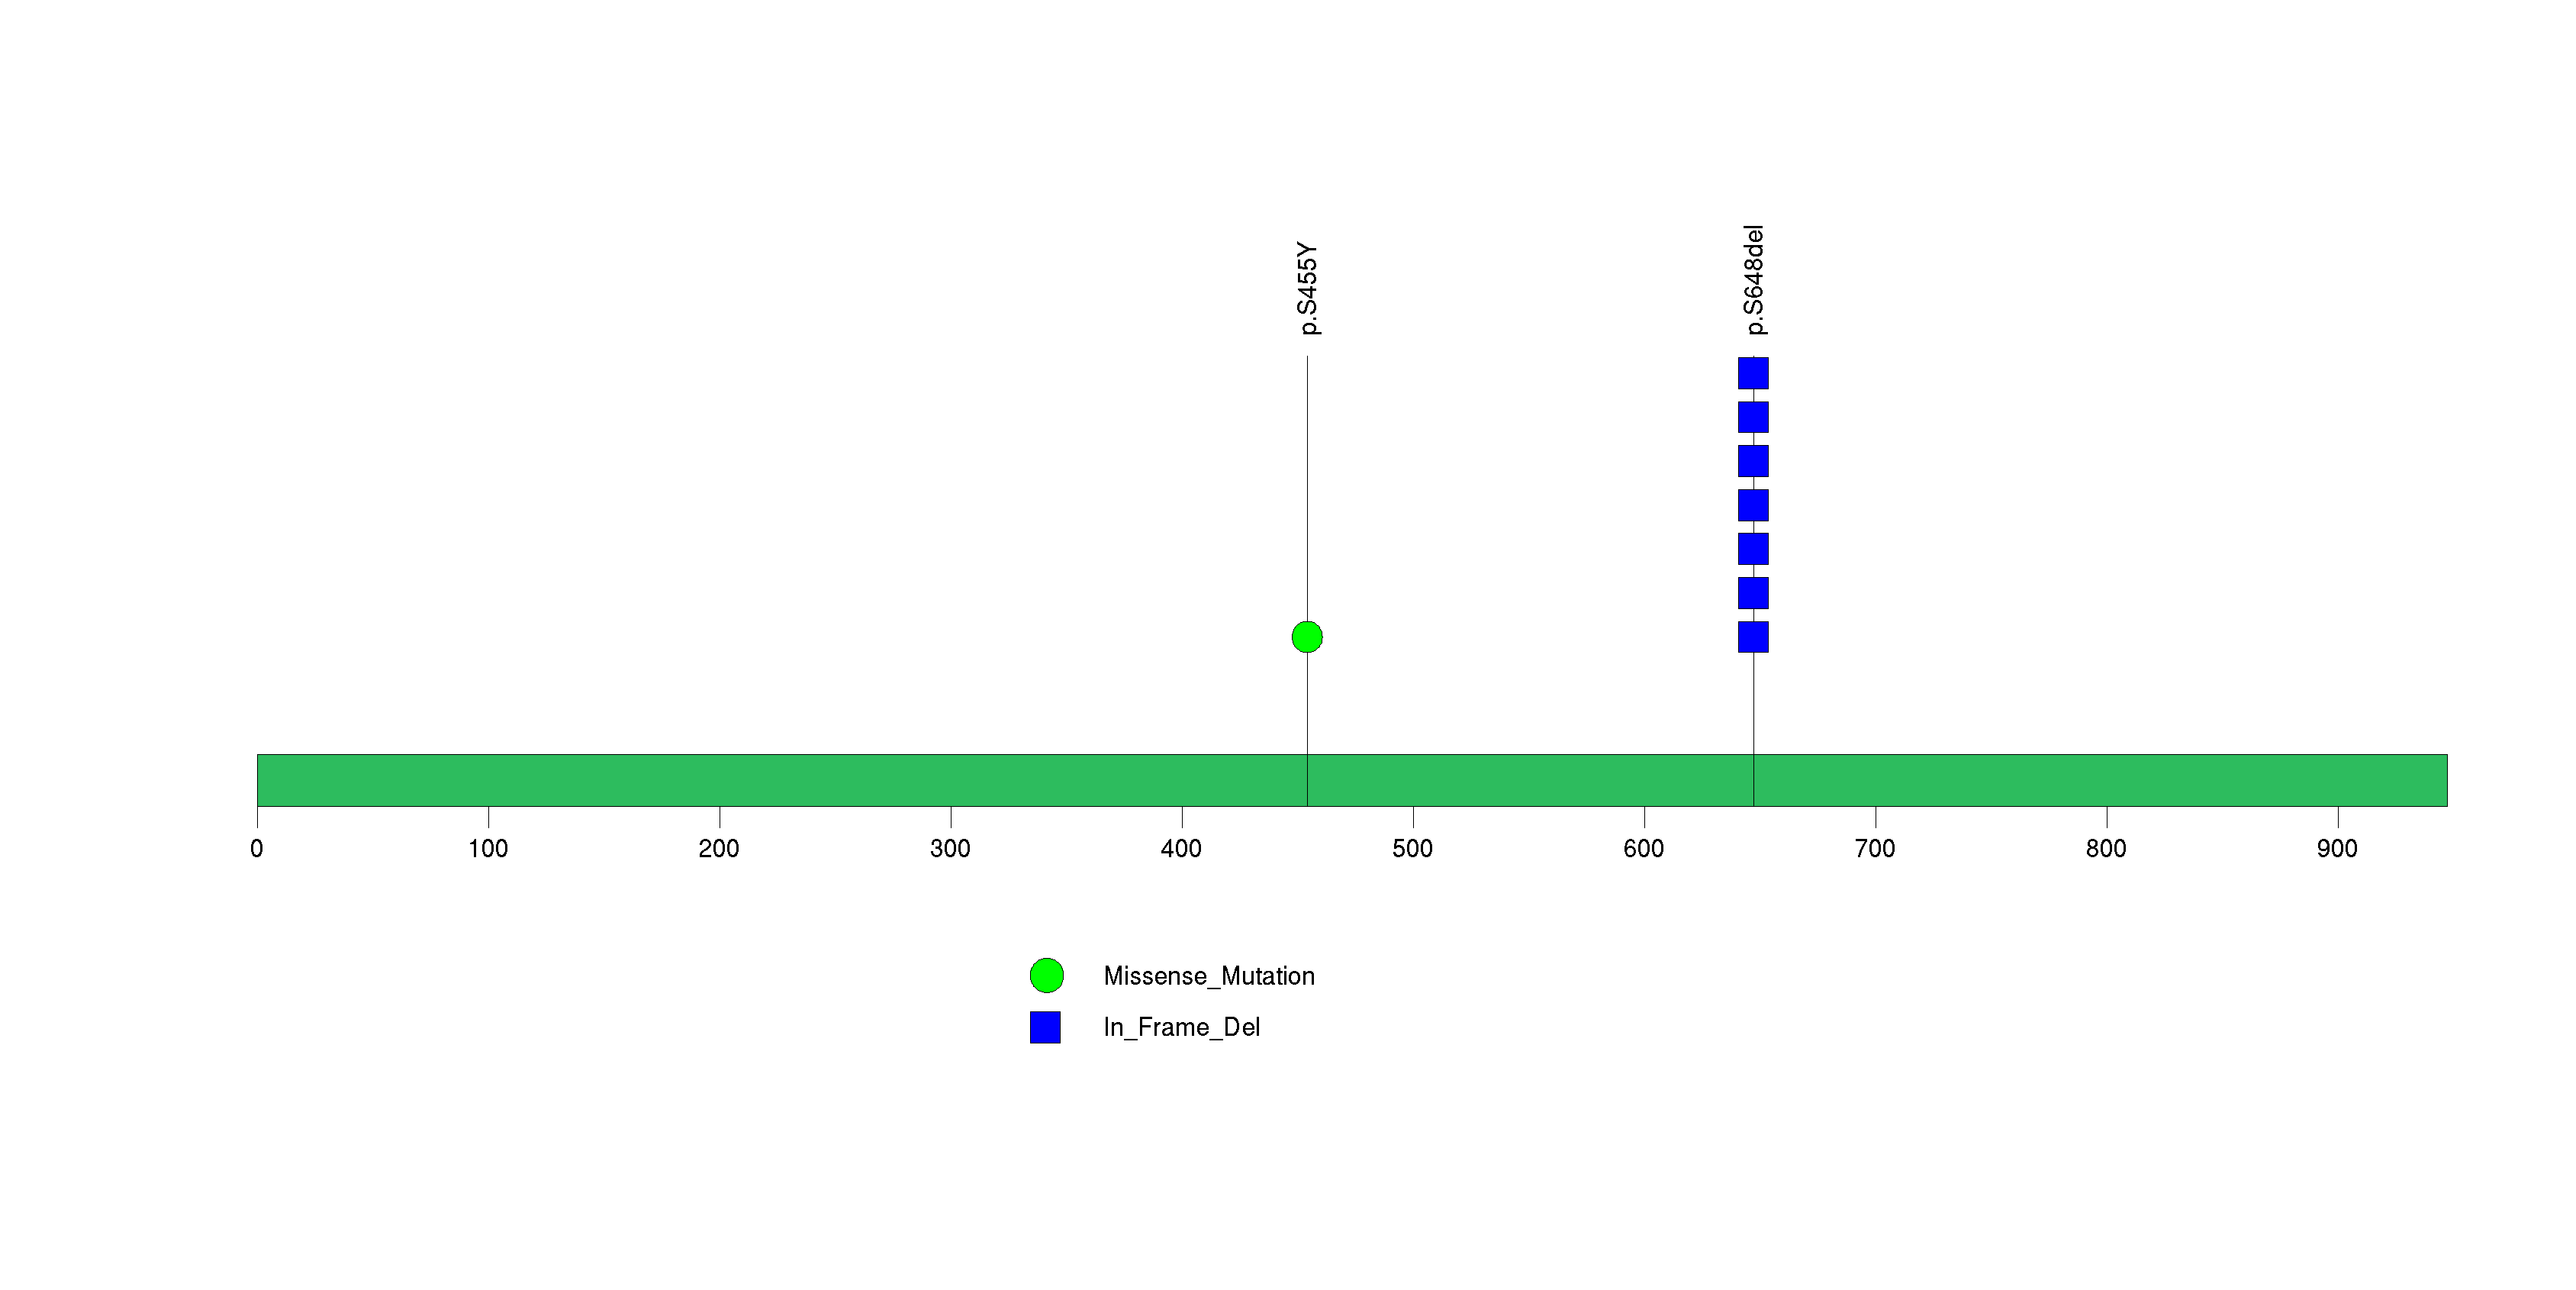
Figure S28. This figure depicts the distribution of mutations and mutation types across the MBD3 significant gene.
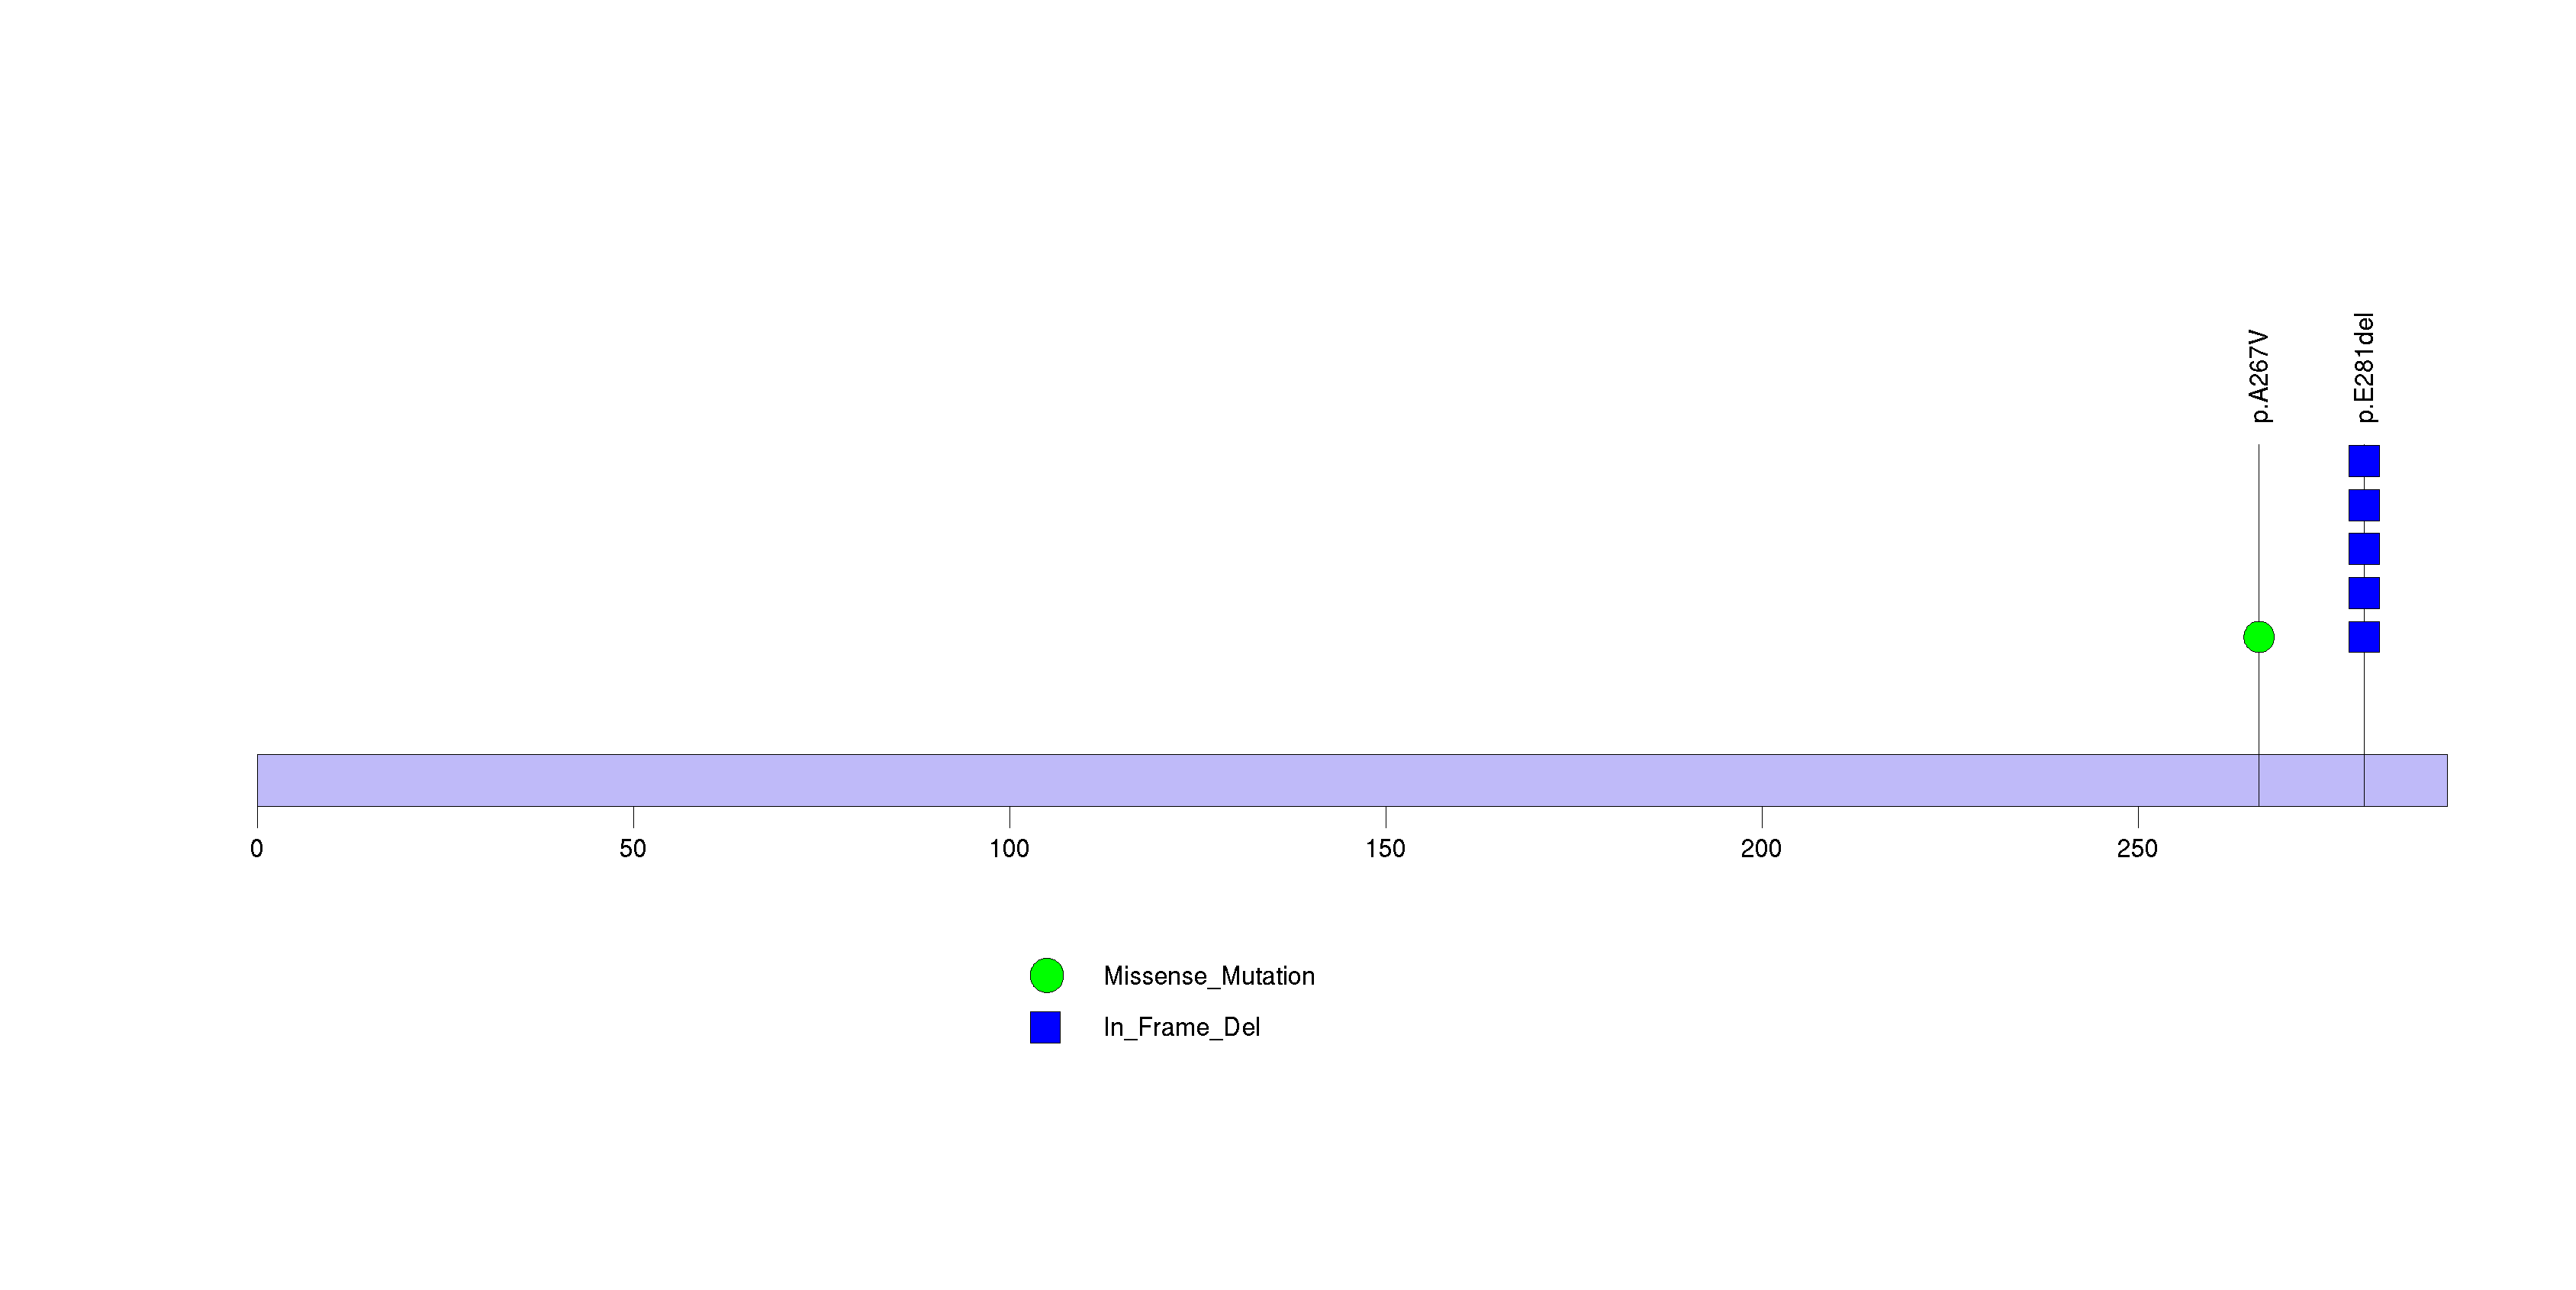
Figure S29. This figure depicts the distribution of mutations and mutation types across the TULP1 significant gene.
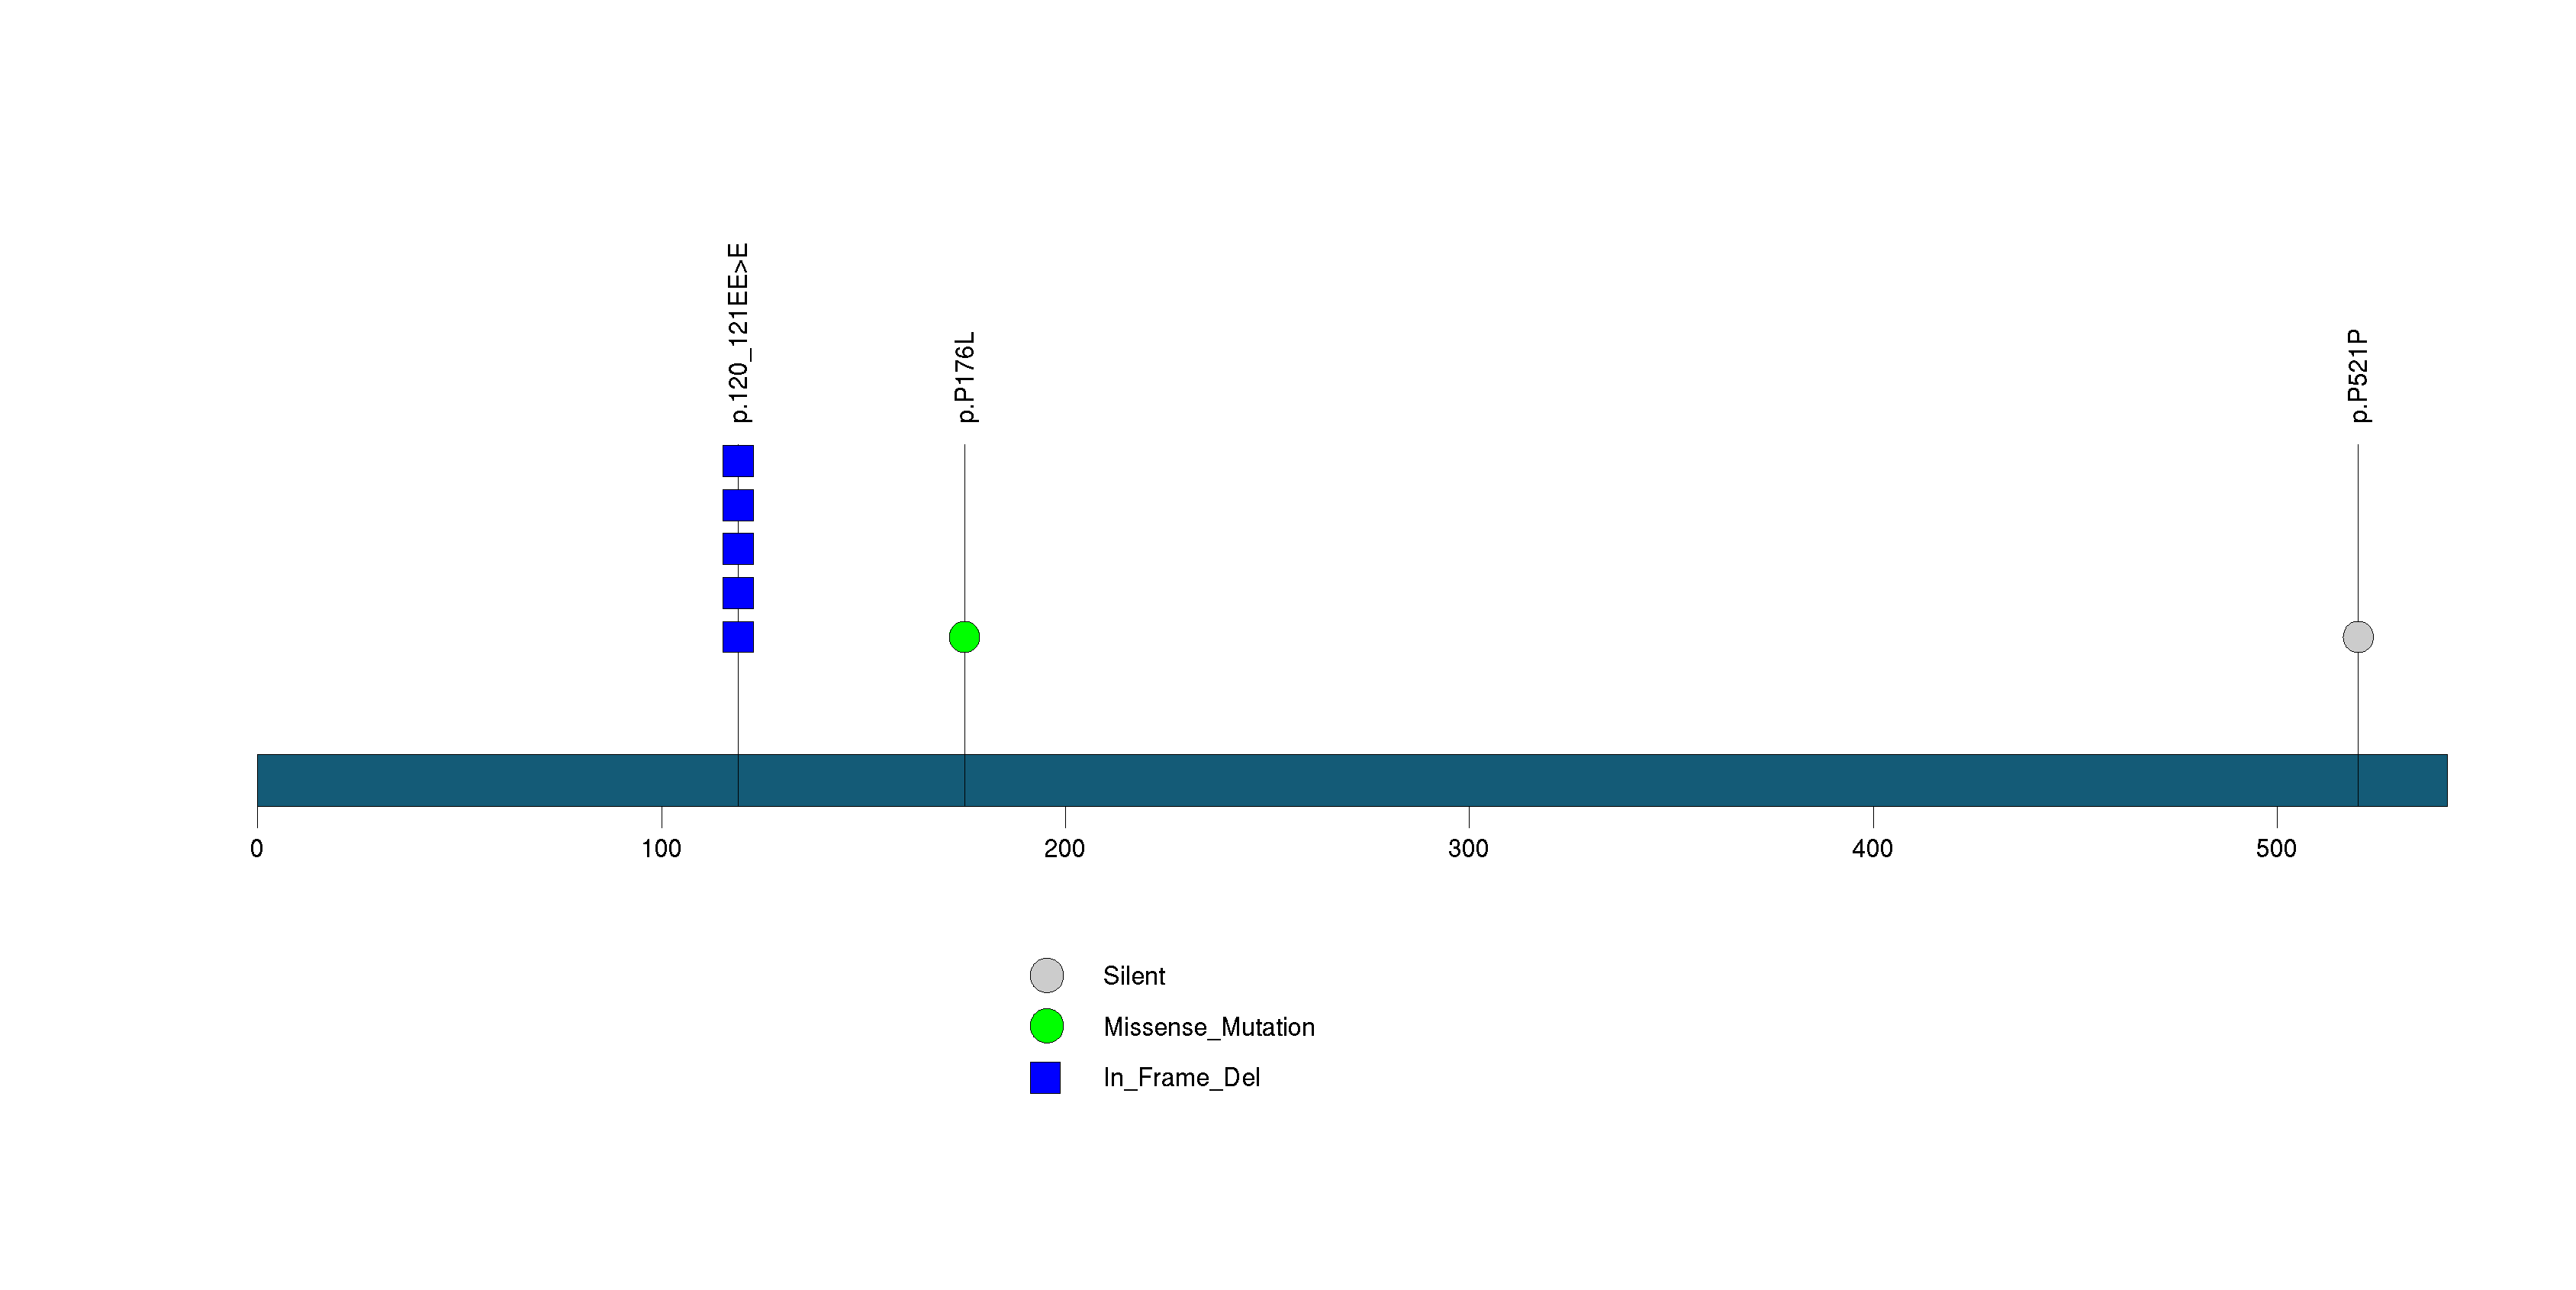
Figure S30. This figure depicts the distribution of mutations and mutation types across the PHF13 significant gene.
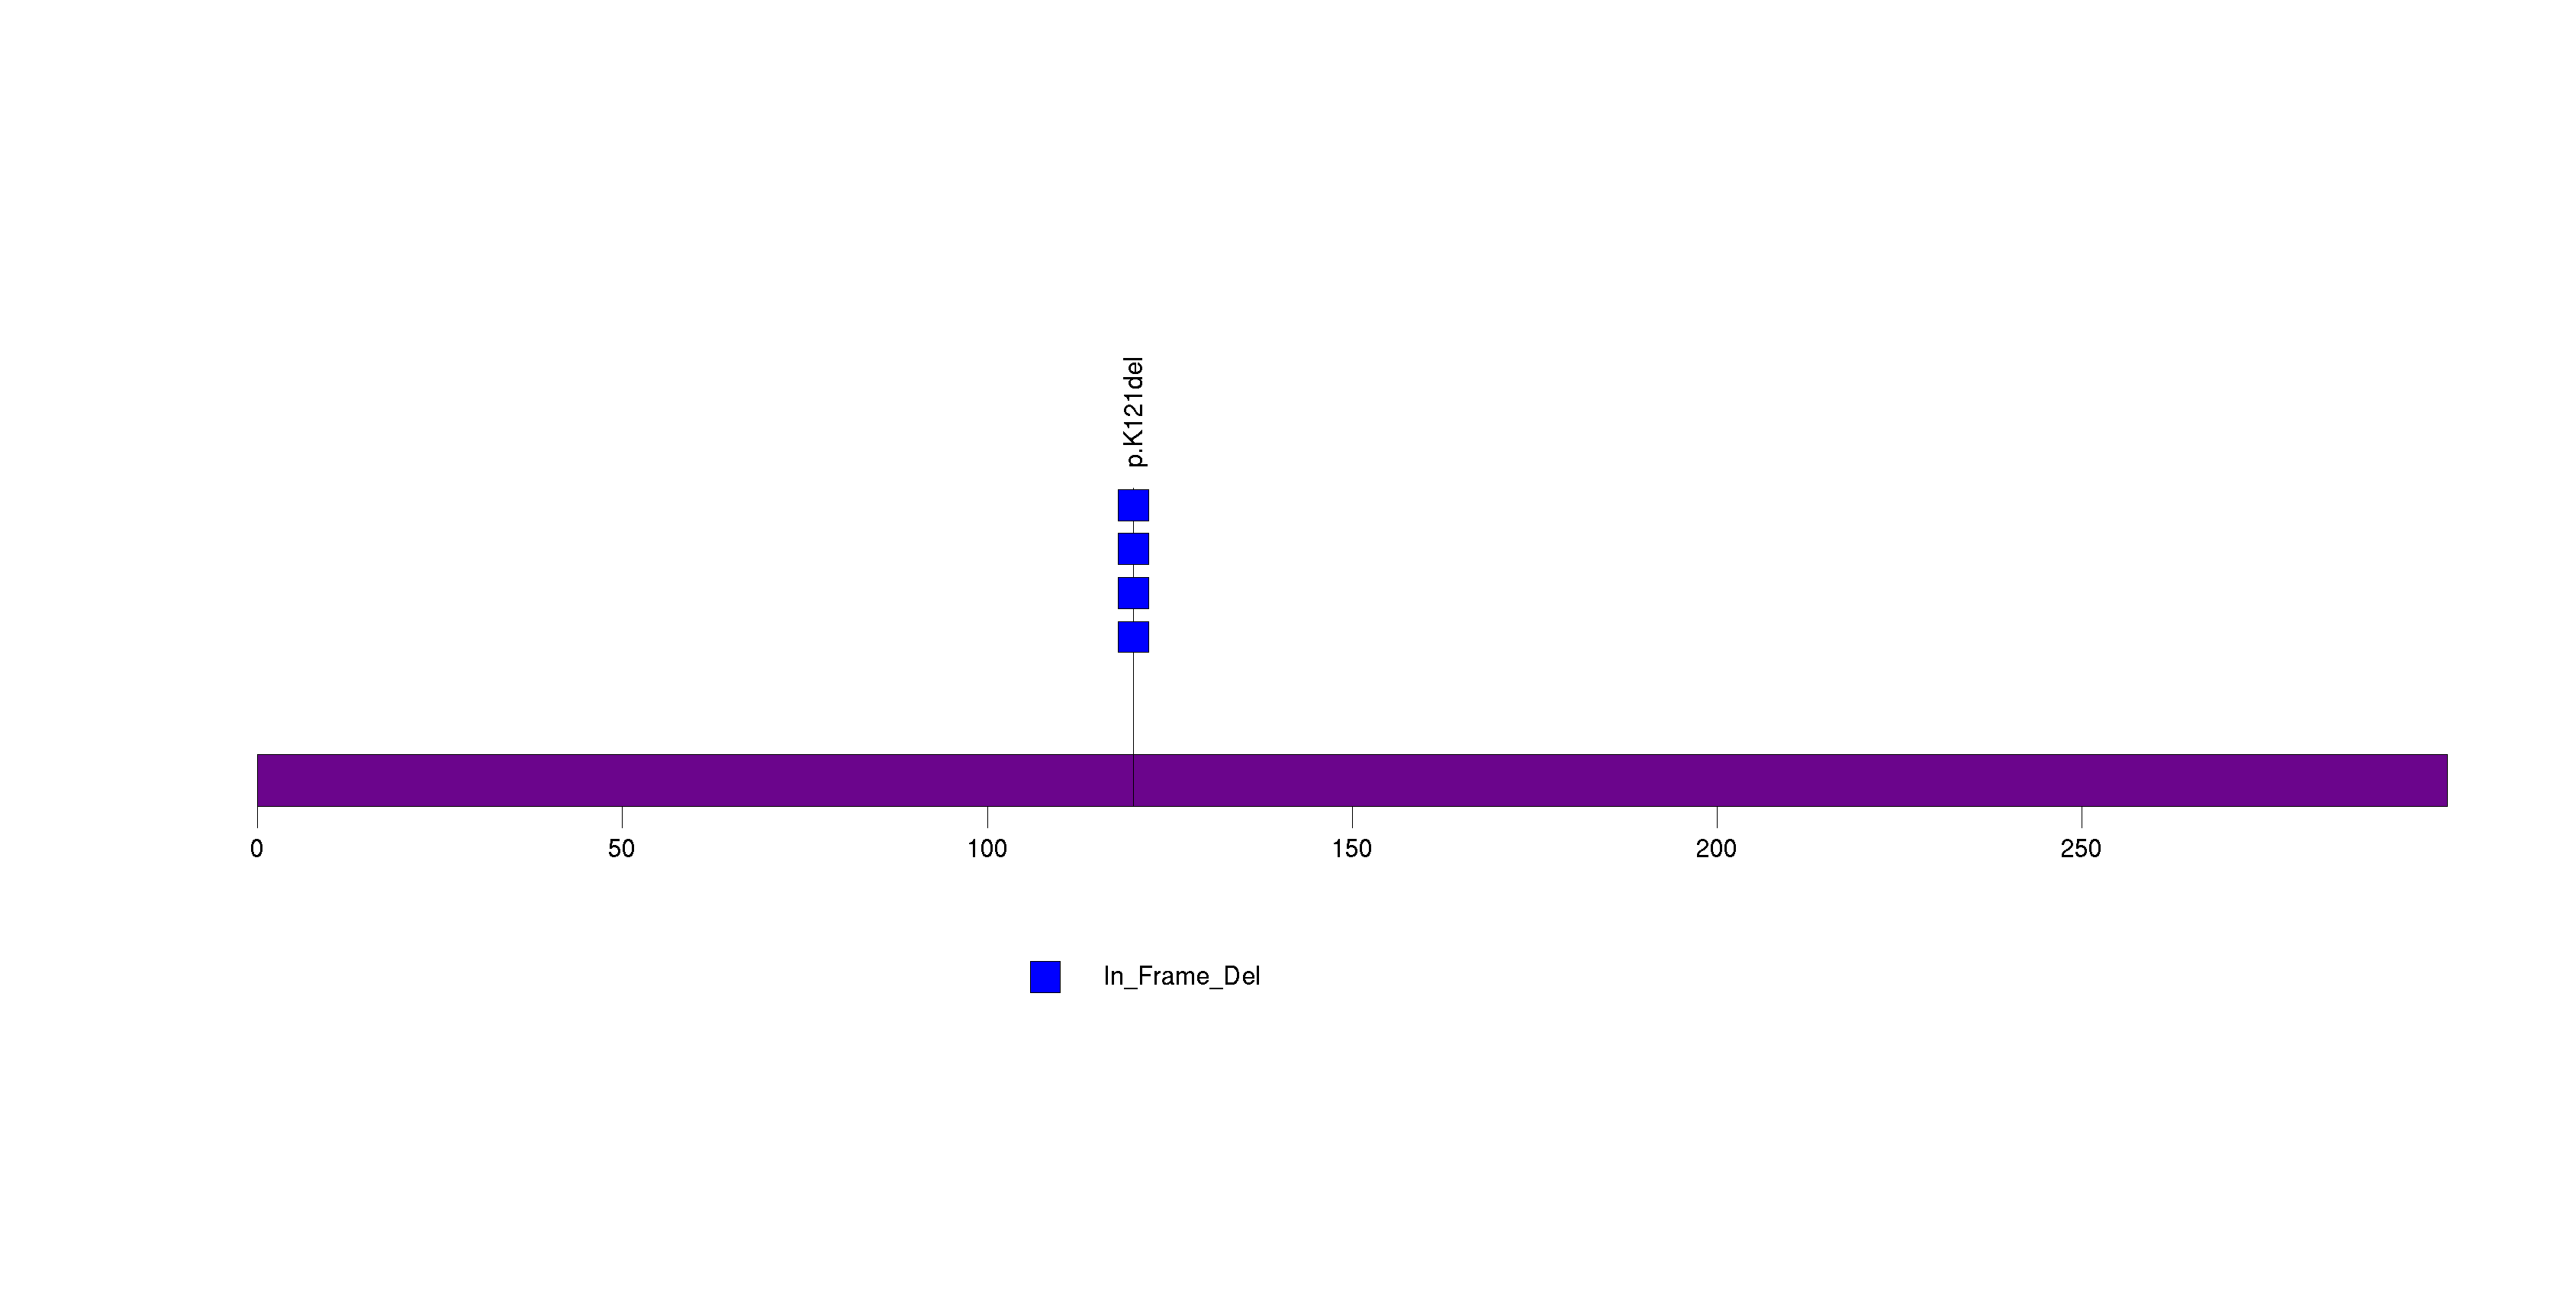
Figure S31. This figure depicts the distribution of mutations and mutation types across the BHLHB9 significant gene.
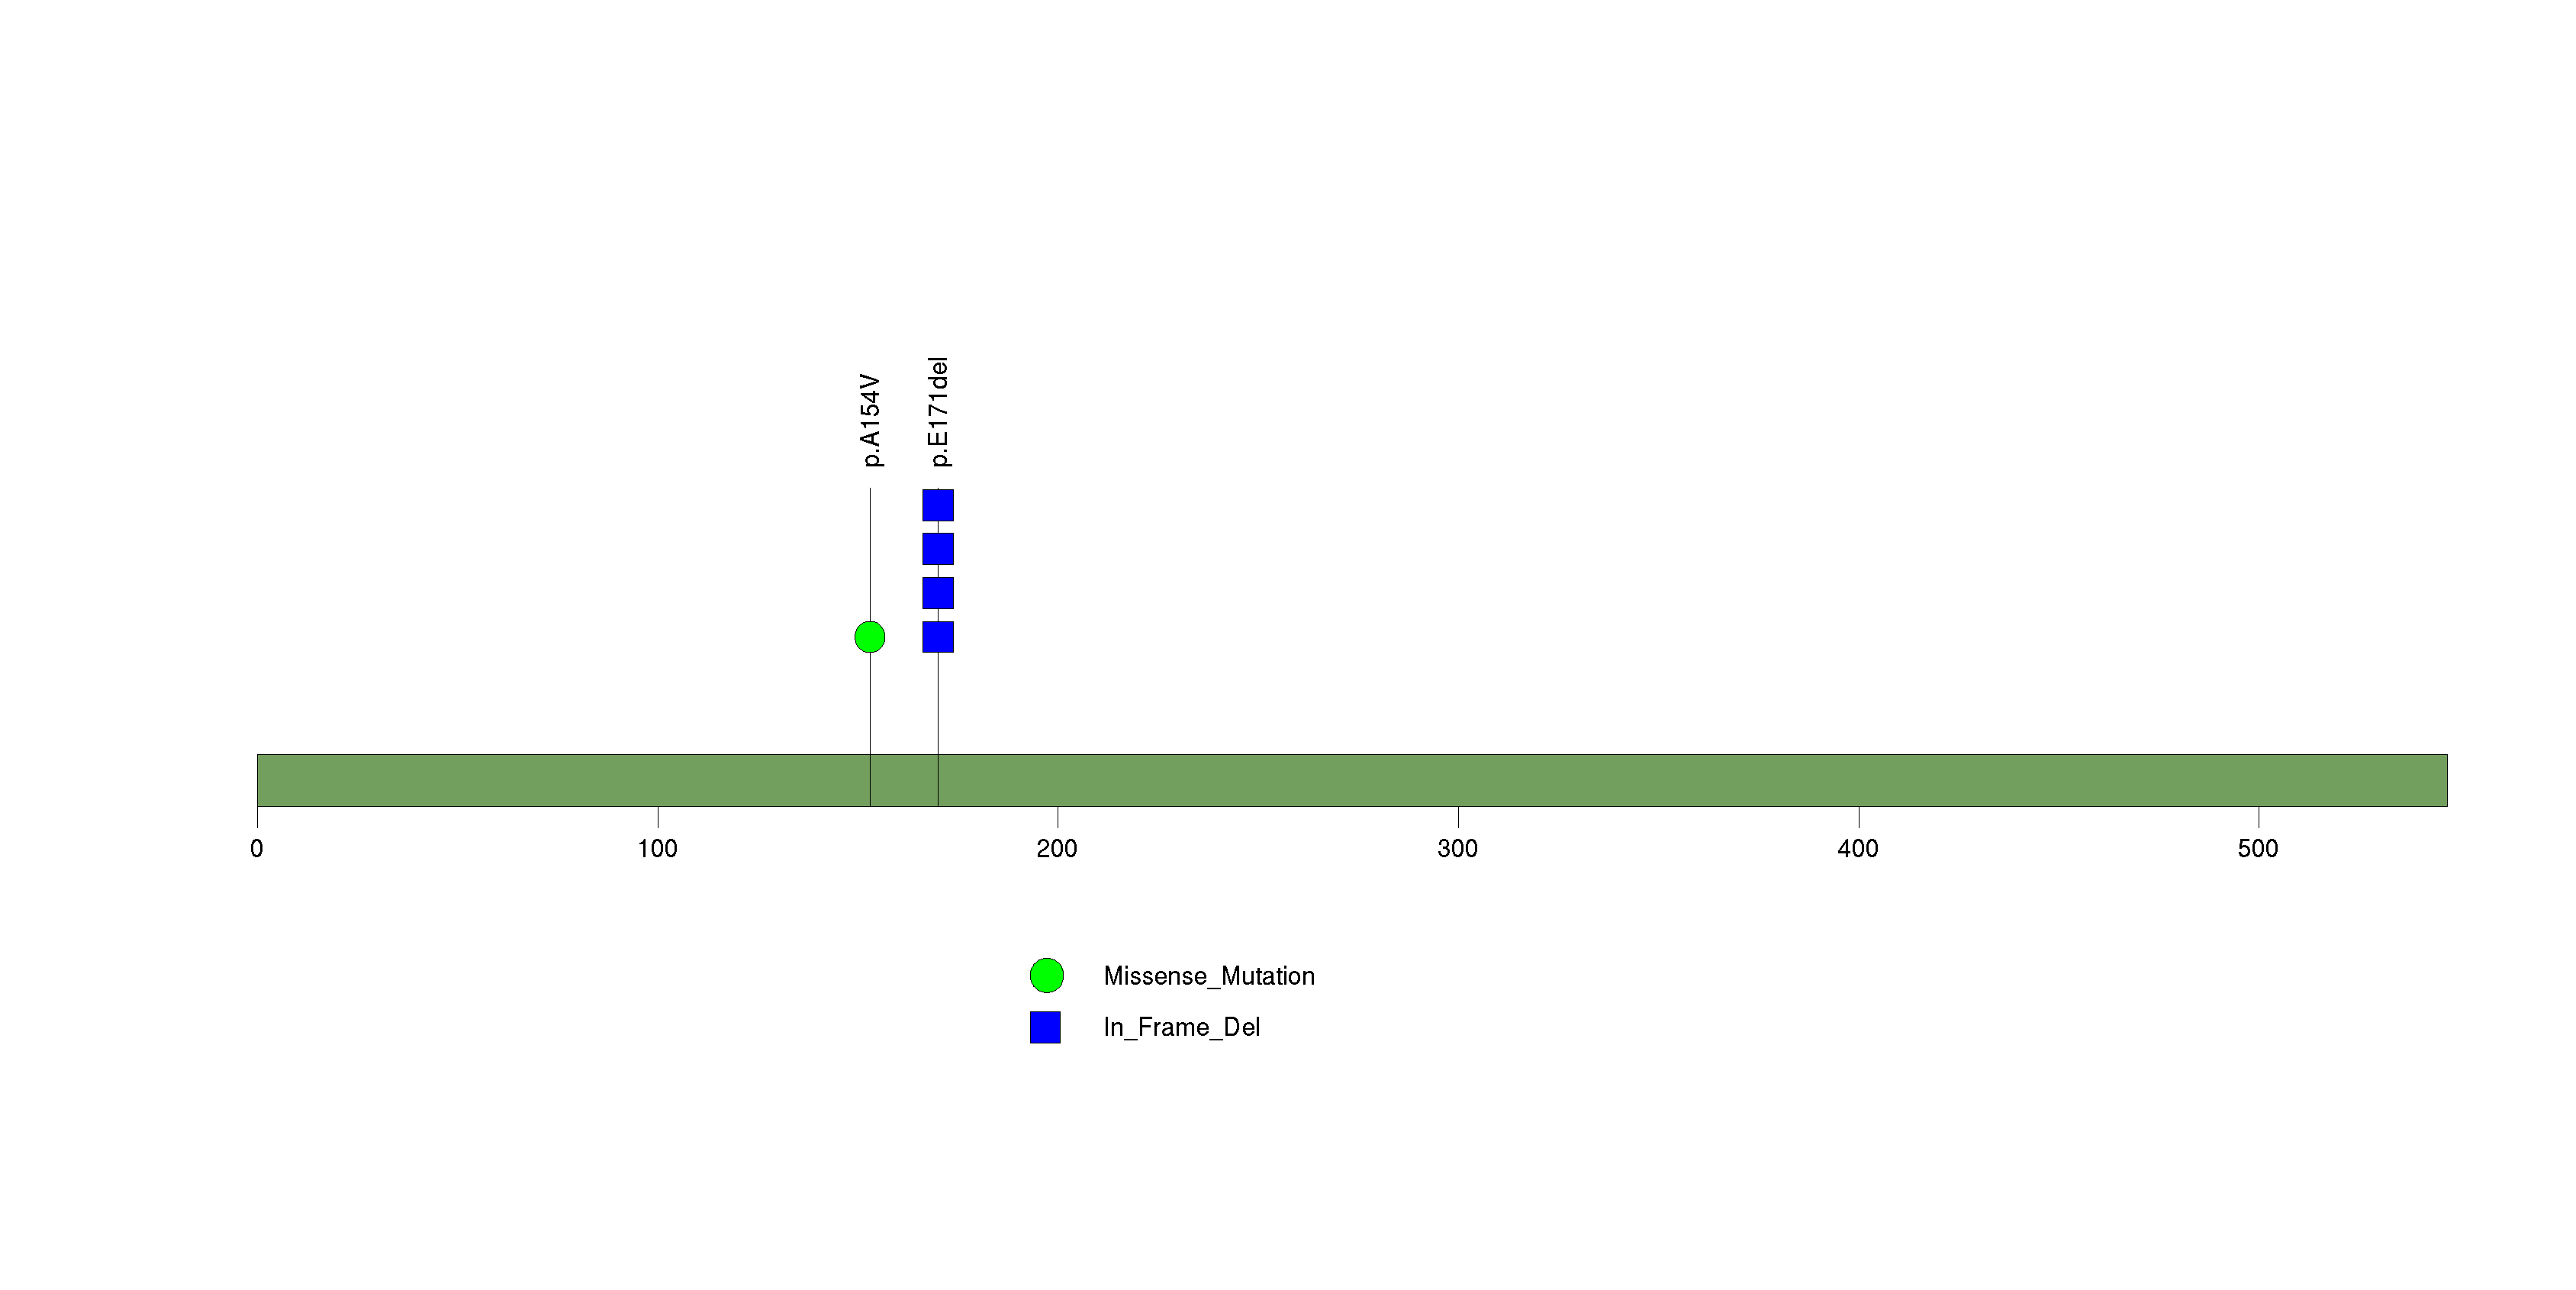
Figure S32. This figure depicts the distribution of mutations and mutation types across the PRDM8 significant gene.
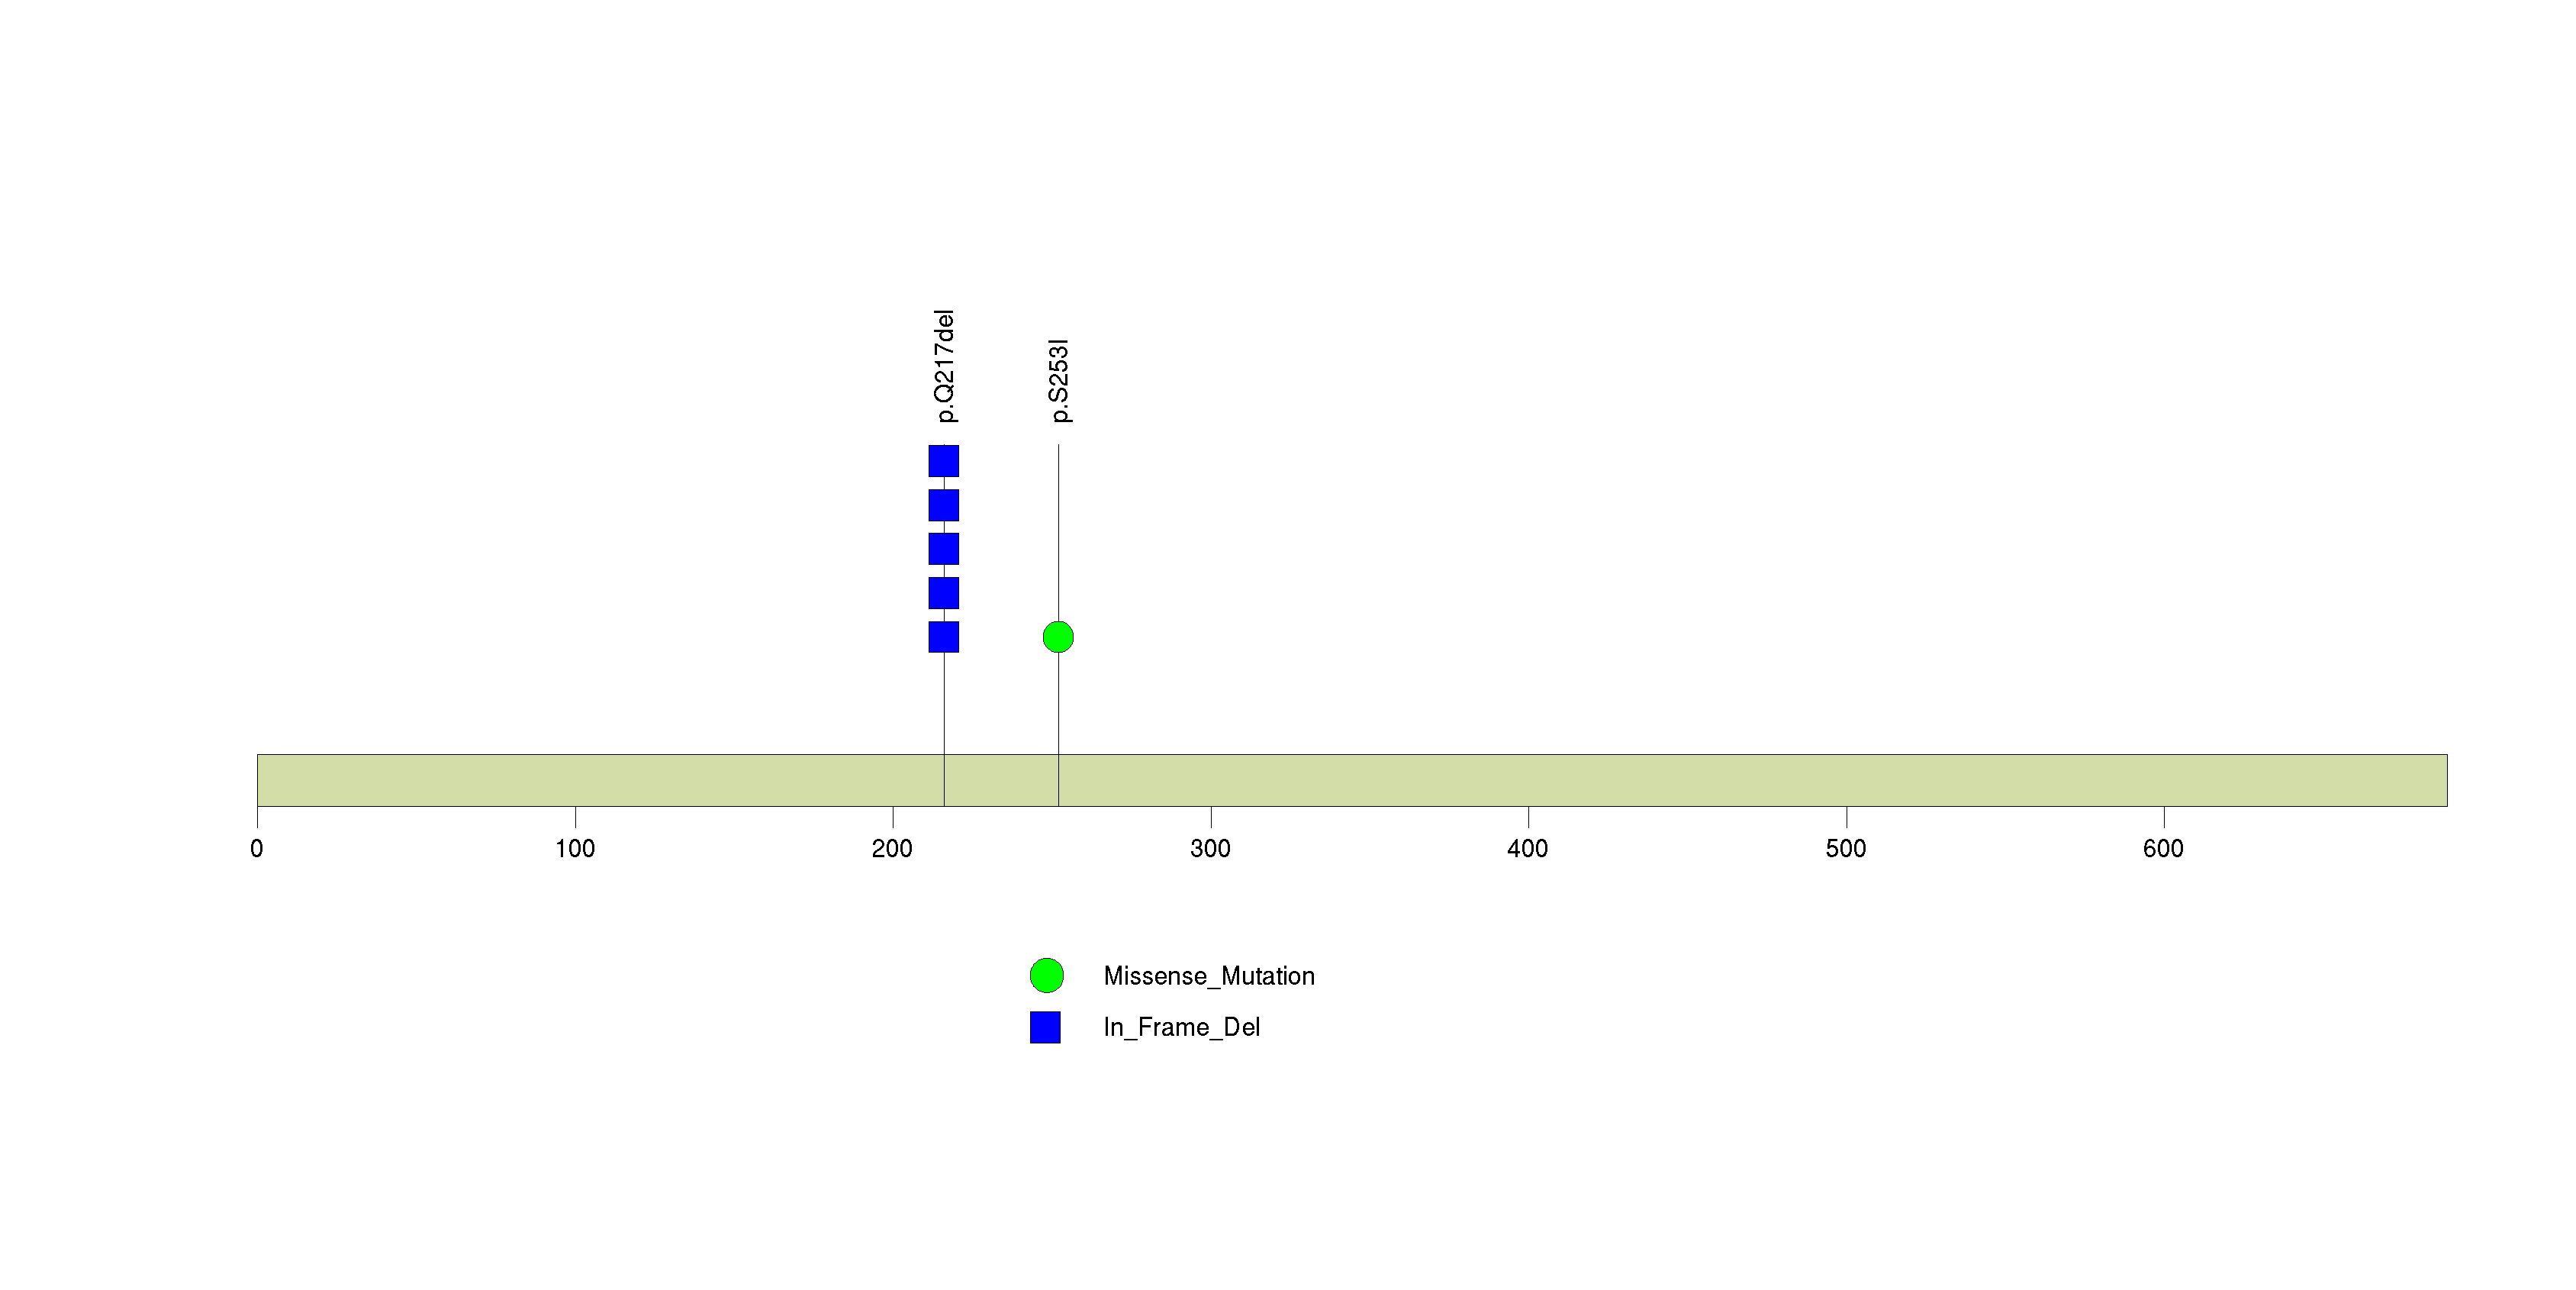
Figure S33. This figure depicts the distribution of mutations and mutation types across the SMAD4 significant gene.
In this analysis, COSMIC is used as a filter to increase power by restricting the territory of each gene. Cosmic version: v48.
Table 4. Get Full Table Significantly mutated genes (COSMIC territory only). To access the database please go to: COSMIC. Number of significant genes found: 8. Number of genes displayed: 10
| rank | gene | description | n | cos | n_cos | N_cos | cos_ev | p | q |
|---|---|---|---|---|---|---|---|---|---|
| 1 | KRAS | v-Ki-ras2 Kirsten rat sarcoma viral oncogene homolog | 33 | 52 | 33 | 2964 | 423105 | 0 | 0 |
| 2 | TP53 | tumor protein p53 | 37 | 356 | 35 | 20292 | 9591 | 0 | 0 |
| 3 | CDKN2A | cyclin-dependent kinase inhibitor 2A (melanoma, p16, inhibits CDK4) | 13 | 332 | 13 | 18924 | 380 | 0 | 0 |
| 4 | TNFRSF9 | tumor necrosis factor receptor superfamily, member 9 | 7 | 1 | 4 | 57 | 4 | 2e-15 | 2.3e-12 |
| 5 | TTK | TTK protein kinase | 5 | 2 | 4 | 114 | 12 | 6.4e-14 | 5.8e-11 |
| 6 | SMAD4 | SMAD family member 4 | 10 | 159 | 6 | 9063 | 16 | 7.4e-10 | 5.6e-07 |
| 7 | GNAS | GNAS complex locus | 6 | 7 | 2 | 399 | 420 | 8e-06 | 0.0052 |
| 8 | TGFBR2 | transforming growth factor, beta receptor II (70/80kDa) | 4 | 12 | 2 | 684 | 2 | 0.000024 | 0.013 |
| 9 | BRCA2 | breast cancer 2, early onset | 6 | 59 | 2 | 3363 | 2 | 0.00056 | 0.22 |
| 10 | MCM2 | minichromosome maintenance complex component 2 | 3 | 1 | 1 | 57 | 1 | 0.00057 | 0.22 |
Note:
n - number of (nonsilent) mutations in this gene across the individual set.
cos = number of unique mutated sites in this gene in COSMIC
n_cos = overlap between n and cos.
N_cos = number of individuals times cos.
cos_ev = total evidence: number of reports in COSMIC for mutations seen in this gene.
p = p-value for seeing the observed amount of overlap in this gene)
q = q-value, False Discovery Rate (Benjamini-Hochberg procedure)
Table 5. Get Full Table A Ranked List of Significantly Mutated Genesets. (Source: MSigDB GSEA Cannonical Pathway Set).Number of significant genesets found: 21. Number of genesets displayed: 10
| rank | geneset | description | genes | N_genes | mut_tally | N | n | npat | nsite | nsil | n1 | n2 | n3 | n4 | n5 | n6 | p_ns_s | p | q |
|---|---|---|---|---|---|---|---|---|---|---|---|---|---|---|---|---|---|---|---|
| 1 | P53HYPOXIAPATHWAY | Hypoxia induces p53 accumulation and consequent apoptosis with p53-mediated cell cycle arrest, which is present under conditions of DNA damage. | ABCB1, AKT1, ATM, BAX, CDKN1A, CPB2, CSNK1A1, CSNK1D, FHL2, GADD45A, HIC1, HIF1A, HSPA1A, HSPCA, IGFBP3, MAPK8, MDM2, NFKBIB, NQO1, TP53 | 19 | ABCB1(2), AKT1(2), ATM(6), CSNK1D(1), FHL2(1), HIC1(1), HIF1A(1), MAPK8(1), MDM2(1), TP53(37) | 1809048 | 53 | 40 | 49 | 4 | 10 | 3 | 11 | 11 | 18 | 0 | 0.0034 | 1.3e-15 | 3.4e-13 |
| 2 | TIDPATHWAY | On ligand binding, interferon gamma receptors stimulate JAK2 kinase to phosphorylate STAT transcription factors, which promote expression of interferon responsive genes. | DNAJA3, HSPA1A, IFNG, IFNGR1, IFNGR2, IKBKB, JAK2, LIN7A, NFKB1, NFKBIA, RB1, RELA, TIP-1, TNF, TNFRSF1A, TNFRSF1B, TP53, USH1C, WT1 | 18 | IFNGR1(1), IFNGR2(4), IKBKB(2), JAK2(2), LIN7A(1), NFKBIA(2), RB1(1), RELA(1), TNFRSF1A(2), TNFRSF1B(1), TP53(37), USH1C(1) | 1594010 | 55 | 41 | 48 | 6 | 12 | 3 | 12 | 9 | 19 | 0 | 0.011 | 2.6e-15 | 3.4e-13 |
| 3 | P53PATHWAY | p53 induces cell cycle arrest or apoptosis under conditions of DNA damage. | APAF1, ATM, BAX, BCL2, CCND1, CCNE1, CDK2, CDK4, CDKN1A, E2F1, GADD45A, MDM2, PCNA, RB1, TIMP3, TP53 | 16 | APAF1(3), ATM(6), CCNE1(1), CDK4(2), MDM2(1), RB1(1), TP53(37) | 1563583 | 51 | 40 | 47 | 3 | 12 | 4 | 11 | 9 | 15 | 0 | 0.0016 | 2.6e-15 | 3.4e-13 |
| 4 | RNAPATHWAY | dsRNA-activated protein kinase phosphorylates elF2a, which generally inhibits translation, and activates NF-kB to provoke inflammation. | CHUK, DNAJC3, EIF2S1, EIF2S2, MAP3K14, NFKB1, NFKBIA, PRKR, RELA, TP53 | 9 | CHUK(1), DNAJC3(3), NFKBIA(2), RELA(1), TP53(37) | 859778 | 44 | 39 | 40 | 3 | 9 | 2 | 9 | 9 | 15 | 0 | 0.0062 | 3.1e-15 | 3.4e-13 |
| 5 | TERTPATHWAY | hTERC, the RNA subunit of telomerase, and hTERT, the catalytic protein subunit, are required for telomerase activity and are overexpressed in many cancers. | HDAC1, MAX, MYC, SP1, SP3, TP53, WT1, ZNF42 | 7 | MAX(2), SP1(1), TP53(37) | 607537 | 40 | 40 | 36 | 0 | 9 | 1 | 8 | 7 | 15 | 0 | 0.000057 | 3.9e-15 | 3.4e-13 |
| 6 | ARFPATHWAY | Cyclin-dependent kinase inhibitor 2A is a tumor suppressor that induces G1 arrest and can activate the p53 pathway, leading to G2/M arrest. | ABL1, CDKN2A, E2F1, MDM2, MYC, PIK3CA, PIK3R1, POLR1A, POLR1B, POLR1C, POLR1D, RAC1, RB1, TBX2, TP53, TWIST1 | 16 | ABL1(8), CDKN2A(13), MDM2(1), PIK3CA(1), PIK3R1(1), POLR1A(3), POLR1B(2), RB1(1), TP53(37) | 1763289 | 67 | 38 | 60 | 3 | 12 | 5 | 13 | 8 | 29 | 0 | 0.00016 | 4.2e-15 | 3.4e-13 |
| 7 | ATMPATHWAY | The tumor-suppressing protein kinase ATM responds to radiation-induced DNA damage by blocking cell-cycle progression and activating DNA repair. | ABL1, ATM, BRCA1, CDKN1A, CHEK1, CHEK2, GADD45A, JUN, MAPK8, MDM2, MRE11A, NBS1, NFKB1, NFKBIA, RAD50, RAD51, RBBP8, RELA, TP53, TP73 | 19 | ABL1(8), ATM(6), BRCA1(3), MAPK8(1), MDM2(1), MRE11A(2), NFKBIA(2), RBBP8(2), RELA(1), TP53(37) | 2565925 | 63 | 42 | 58 | 2 | 13 | 6 | 14 | 9 | 21 | 0 | 0.000087 | 4.4e-15 | 3.4e-13 |
| 8 | PMLPATHWAY | Ring-shaped PML nuclear bodies regulate transcription and are required co-activators in p53- and DAXX-mediated apoptosis. | CREBBP, DAXX, HRAS, PAX3, PML, PRAM-1, RARA, RB1, SIRT1, SP100, TNF, TNFRSF1A, TNFRSF1B, TNFRSF6, TNFSF6, TP53, UBL1 | 13 | CREBBP(1), DAXX(2), HRAS(1), PML(1), RB1(1), SIRT1(1), SP100(4), TNFRSF1A(2), TNFRSF1B(1), TP53(37) | 1656321 | 51 | 38 | 47 | 5 | 13 | 3 | 11 | 10 | 14 | 0 | 0.0043 | 4.4e-15 | 3.4e-13 |
| 9 | SA_G1_AND_S_PHASES | Cdk2, 4, and 6 bind cyclin D in G1, while cdk2/cyclin E promotes the G1/S transition. | ARF1, ARF3, CCND1, CDK2, CDK4, CDKN1A, CDKN1B, CDKN2A, CFL1, E2F1, E2F2, MDM2, NXT1, PRB1, TP53 | 15 | ARF1(1), CDK4(2), CDKN2A(13), MDM2(1), NXT1(1), TP53(37) | 738429 | 55 | 38 | 49 | 0 | 12 | 2 | 10 | 7 | 24 | 0 | 6.3e-06 | 5.2e-15 | 3.6e-13 |
| 10 | RBPATHWAY | The ATM protein kinase recognizes DNA damage and blocks cell cycle progression by phosphorylating chk1 and p53, which normally inhibits Rb to allow G1/S transitions. | ATM, CDC2, CDC25A, CDC25B, CDC25C, CDK2, CDK4, CHEK1, MYT1, RB1, TP53, WEE1, YWHAH | 12 | ATM(6), CDC25A(2), CDC25C(2), CDK4(2), MYT1(6), RB1(1), TP53(37), YWHAH(1) | 1510491 | 57 | 41 | 51 | 3 | 12 | 4 | 11 | 10 | 20 | 0 | 0.0014 | 6e-15 | 3.7e-13 |
In brief, we tabulate the number of mutations and the number of covered bases for each gene. The counts are broken down by mutation context category: four context categories that are discovered by MutSig, and one for indel and 'null' mutations, which include indels, nonsense mutations, splice-site mutations, and non-stop (read-through) mutations. For each gene, we calculate the probability of seeing the observed constellation of mutations, i.e. the product P1 x P2 x ... x Pm, or a more extreme one, given the background mutation rates calculated across the dataset. [1]
In addition to the links below, the full results of the analysis summarized in this report can also be downloaded programmatically using firehose_get, or interactively from either the Broad GDAC website or TCGA Data Coordination Center Portal.