This pipeline computes the correlation between significantly recurrent gene mutations and selected clinical features.
Testing the association between mutation status of 6 genes and 14 clinical features across 171 patients, 3 significant findings detected with Q value < 0.25.
-
CTNNB1 mutation correlated to 'NUMBER.OF.LYMPH.NODES'.
-
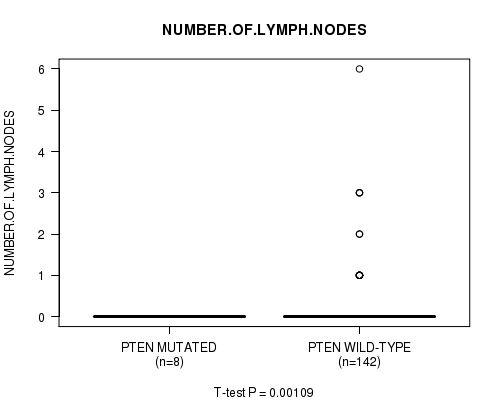
PTEN mutation correlated to 'NUMBER.OF.LYMPH.NODES'.
-
FOXA1 mutation correlated to 'NUMBER.OF.LYMPH.NODES'.
Table 1. Get Full Table Overview of the association between mutation status of 6 genes and 14 clinical features. Shown in the table are P values (Q values). Thresholded by Q value < 0.25, 3 significant findings detected.
|
Clinical Features |
Time to Death |
AGE |
PATHOLOGY T STAGE |
PATHOLOGY N STAGE |
COMPLETENESS OF RESECTION |
NUMBER OF LYMPH NODES |
GLEASON SCORE COMBINED |
GLEASON SCORE PRIMARY |
GLEASON SCORE SECONDARY |
GLEASON SCORE |
PSA RESULT PREOP |
DAYS TO PREOP PSA |
PSA VALUE |
DAYS TO PSA |
||
| nMutated (%) | nWild-Type | logrank test | t-test | Fisher's exact test | Fisher's exact test | Fisher's exact test | t-test | t-test | t-test | t-test | t-test | t-test | t-test | t-test | t-test | |
| CTNNB1 | 4 (2%) | 167 |
100 (1.00) |
0.892 (1.00) |
1 (1.00) |
1 (1.00) |
1 (1.00) |
0.00109 (0.0915) |
0.366 (1.00) |
0.902 (1.00) |
0.155 (1.00) |
0.401 (1.00) |
0.0552 (1.00) |
0.726 (1.00) |
0.769 (1.00) |
0.798 (1.00) |
| PTEN | 9 (5%) | 162 |
100 (1.00) |
0.411 (1.00) |
0.385 (1.00) |
1 (1.00) |
1 (1.00) |
0.00109 (0.0915) |
0.896 (1.00) |
0.451 (1.00) |
0.623 (1.00) |
0.756 (1.00) |
0.821 (1.00) |
0.611 (1.00) |
0.492 (1.00) |
0.106 (1.00) |
| FOXA1 | 6 (4%) | 165 |
100 (1.00) |
0.621 (1.00) |
0.745 (1.00) |
1 (1.00) |
0.633 (1.00) |
0.00109 (0.0915) |
0.637 (1.00) |
0.869 (1.00) |
0.72 (1.00) |
0.49 (1.00) |
0.392 (1.00) |
0.428 (1.00) |
0.565 (1.00) |
0.434 (1.00) |
| SPOP | 12 (7%) | 159 |
100 (1.00) |
0.0444 (1.00) |
0.757 (1.00) |
1 (1.00) |
1 (1.00) |
0.52 (1.00) |
0.664 (1.00) |
0.163 (1.00) |
0.509 (1.00) |
0.815 (1.00) |
0.468 (1.00) |
0.374 (1.00) |
0.0305 (1.00) |
0.107 (1.00) |
| PCDHAC2 | 19 (11%) | 152 |
100 (1.00) |
0.417 (1.00) |
0.384 (1.00) |
0.00323 (0.262) |
0.129 (1.00) |
0.0918 (1.00) |
0.231 (1.00) |
0.918 (1.00) |
0.155 (1.00) |
0.0504 (1.00) |
0.219 (1.00) |
0.443 (1.00) |
0.664 (1.00) |
0.853 (1.00) |
| TP53 | 15 (9%) | 156 |
100 (1.00) |
0.927 (1.00) |
0.281 (1.00) |
0.66 (1.00) |
0.785 (1.00) |
0.963 (1.00) |
0.0138 (1.00) |
0.0195 (1.00) |
0.208 (1.00) |
0.00439 (0.351) |
0.145 (1.00) |
0.364 (1.00) |
0.983 (1.00) |
0.155 (1.00) |
P value = 0.00109 (t-test), Q value = 0.092
Table S1. Gene #1: 'CTNNB1 MUTATION STATUS' versus Clinical Feature #6: 'NUMBER.OF.LYMPH.NODES'
| nPatients | Mean (Std.Dev) | |
|---|---|---|
| ALL | 150 | 0.2 (0.7) |
| CTNNB1 MUTATED | 4 | 0.0 (0.0) |
| CTNNB1 WILD-TYPE | 146 | 0.2 (0.7) |
Figure S1. Get High-res Image Gene #1: 'CTNNB1 MUTATION STATUS' versus Clinical Feature #6: 'NUMBER.OF.LYMPH.NODES'

P value = 0.00109 (t-test), Q value = 0.092
Table S2. Gene #3: 'PTEN MUTATION STATUS' versus Clinical Feature #6: 'NUMBER.OF.LYMPH.NODES'
| nPatients | Mean (Std.Dev) | |
|---|---|---|
| ALL | 150 | 0.2 (0.7) |
| PTEN MUTATED | 8 | 0.0 (0.0) |
| PTEN WILD-TYPE | 142 | 0.2 (0.7) |
Figure S2. Get High-res Image Gene #3: 'PTEN MUTATION STATUS' versus Clinical Feature #6: 'NUMBER.OF.LYMPH.NODES'
P value = 0.00109 (t-test), Q value = 0.092
Table S3. Gene #5: 'FOXA1 MUTATION STATUS' versus Clinical Feature #6: 'NUMBER.OF.LYMPH.NODES'
| nPatients | Mean (Std.Dev) | |
|---|---|---|
| ALL | 150 | 0.2 (0.7) |
| FOXA1 MUTATED | 5 | 0.0 (0.0) |
| FOXA1 WILD-TYPE | 145 | 0.2 (0.7) |
Figure S3. Get High-res Image Gene #5: 'FOXA1 MUTATION STATUS' versus Clinical Feature #6: 'NUMBER.OF.LYMPH.NODES'

-
Mutation data file = transformed.cor.cli.txt
-
Clinical data file = PRAD-TP.merged_data.txt
-
Number of patients = 171
-
Number of significantly mutated genes = 6
-
Number of selected clinical features = 14
-
Exclude genes that fewer than K tumors have mutations, K = 3
For survival clinical features, the Kaplan-Meier survival curves of tumors with and without gene mutations were plotted and the statistical significance P values were estimated by logrank test (Bland and Altman 2004) using the 'survdiff' function in R
For continuous numerical clinical features, two-tailed Student's t test with unequal variance (Lehmann and Romano 2005) was applied to compare the clinical values between tumors with and without gene mutations using 't.test' function in R
For binary or multi-class clinical features (nominal or ordinal), two-tailed Fisher's exact tests (Fisher 1922) were used to estimate the P values using the 'fisher.test' function in R
For multiple hypothesis correction, Q value is the False Discovery Rate (FDR) analogue of the P value (Benjamini and Hochberg 1995), defined as the minimum FDR at which the test may be called significant. We used the 'Benjamini and Hochberg' method of 'p.adjust' function in R to convert P values into Q values.
In addition to the links below, the full results of the analysis summarized in this report can also be downloaded programmatically using firehose_get, or interactively from either the Broad GDAC website or TCGA Data Coordination Center Portal.