This pipeline computes the correlation between significant arm-level copy number variations (cnvs) and selected clinical features.
Testing the association between copy number variation 79 arm-level events and 3 clinical features across 82 patients, 8 significant findings detected with Q value < 0.25.
-
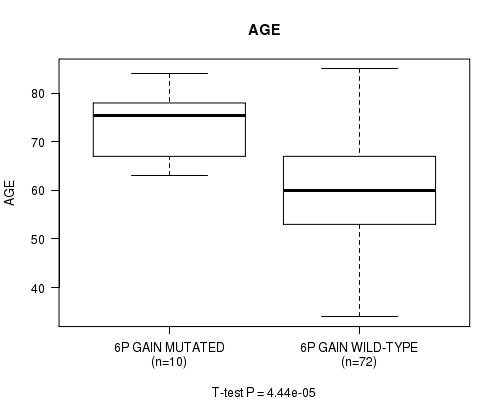
6p gain cnv correlated to 'AGE'.
-
6q gain cnv correlated to 'AGE'.
-
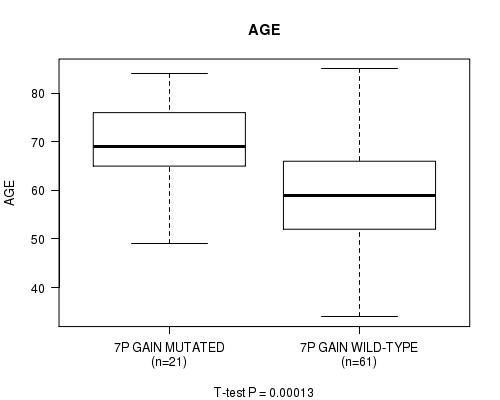
7p gain cnv correlated to 'AGE'.
-
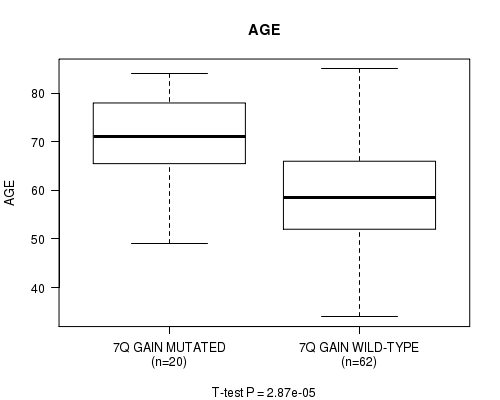
7q gain cnv correlated to 'AGE'.
-
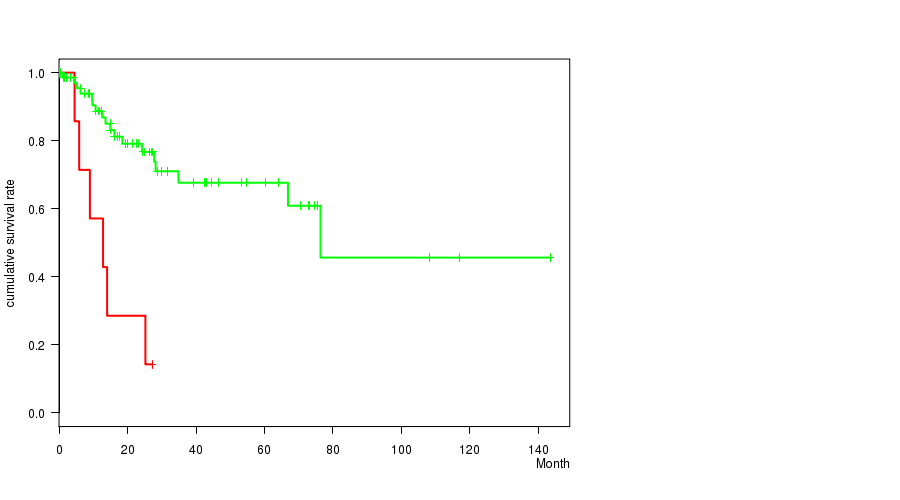
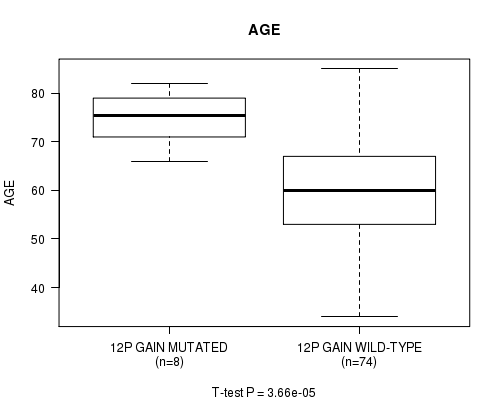
12p gain cnv correlated to 'Time to Death' and 'AGE'.
-
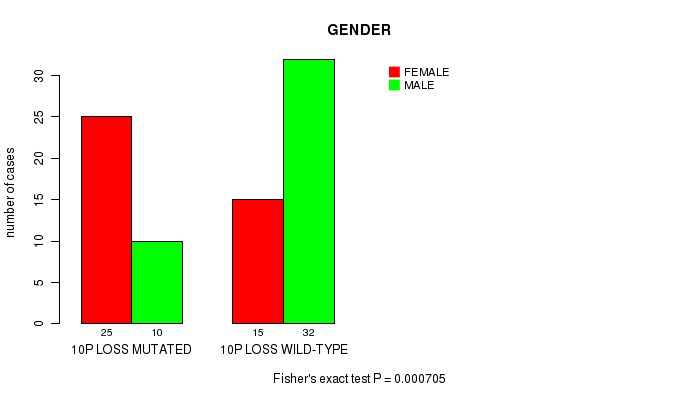
10p loss cnv correlated to 'GENDER'.
-
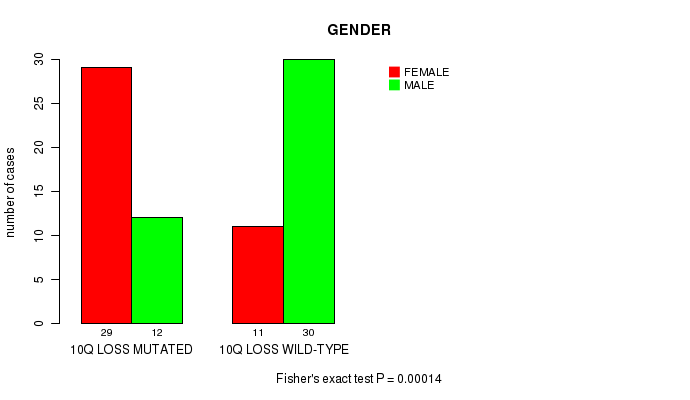
10q loss cnv correlated to 'GENDER'.
Table 1. Get Full Table Overview of the association between significant copy number variation of 79 arm-level events and 3 clinical features. Shown in the table are P values (Q values). Thresholded by Q value < 0.25, 8 significant findings detected.
|
Clinical Features |
Time to Death |
AGE | GENDER | ||
| nCNV (%) | nWild-Type | logrank test | t-test | Fisher's exact test | |
| 12p gain | 8 (10%) | 74 |
3.93e-05 (0.00925) |
3.66e-05 (0.00864) |
1 (1.00) |
| 6p gain | 10 (12%) | 72 |
0.736 (1.00) |
4.44e-05 (0.0104) |
0.514 (1.00) |
| 6q gain | 13 (16%) | 69 |
0.208 (1.00) |
0.000414 (0.0956) |
1 (1.00) |
| 7p gain | 21 (26%) | 61 |
0.488 (1.00) |
0.00013 (0.0303) |
0.0773 (1.00) |
| 7q gain | 20 (24%) | 62 |
0.313 (1.00) |
2.87e-05 (0.00681) |
0.308 (1.00) |
| 10p loss | 35 (43%) | 47 |
0.447 (1.00) |
0.0104 (1.00) |
0.000705 (0.162) |
| 10q loss | 41 (50%) | 41 |
0.23 (1.00) |
0.337 (1.00) |
0.00014 (0.0324) |
| 1p gain | 14 (17%) | 68 |
0.0378 (1.00) |
0.019 (1.00) |
0.565 (1.00) |
| 1q gain | 15 (18%) | 67 |
0.206 (1.00) |
0.0186 (1.00) |
0.399 (1.00) |
| 2p gain | 8 (10%) | 74 |
0.573 (1.00) |
0.0673 (1.00) |
0.477 (1.00) |
| 2q gain | 7 (9%) | 75 |
0.543 (1.00) |
0.302 (1.00) |
0.709 (1.00) |
| 3p gain | 6 (7%) | 76 |
0.927 (1.00) |
0.358 (1.00) |
1 (1.00) |
| 3q gain | 6 (7%) | 76 |
0.927 (1.00) |
0.358 (1.00) |
1 (1.00) |
| 4p gain | 11 (13%) | 71 |
0.586 (1.00) |
0.416 (1.00) |
0.753 (1.00) |
| 4q gain | 10 (12%) | 72 |
0.972 (1.00) |
0.0626 (1.00) |
0.738 (1.00) |
| 5p gain | 22 (27%) | 60 |
0.893 (1.00) |
0.0855 (1.00) |
1 (1.00) |
| 5q gain | 20 (24%) | 62 |
0.457 (1.00) |
0.0741 (1.00) |
0.125 (1.00) |
| 8p gain | 16 (20%) | 66 |
0.00319 (0.721) |
0.0224 (1.00) |
0.271 (1.00) |
| 8q gain | 18 (22%) | 64 |
0.00485 (1.00) |
0.0887 (1.00) |
0.598 (1.00) |
| 9p gain | 15 (18%) | 67 |
0.442 (1.00) |
0.0116 (1.00) |
0.779 (1.00) |
| 9q gain | 21 (26%) | 61 |
0.403 (1.00) |
0.00208 (0.476) |
0.452 (1.00) |
| 10p gain | 7 (9%) | 75 |
0.017 (1.00) |
0.289 (1.00) |
1 (1.00) |
| 10q gain | 3 (4%) | 79 |
0.052 (1.00) |
0.986 (1.00) |
0.241 (1.00) |
| 11p gain | 4 (5%) | 78 |
0.0923 (1.00) |
0.0124 (1.00) |
0.0523 (1.00) |
| 11q gain | 4 (5%) | 78 |
0.822 (1.00) |
0.308 (1.00) |
0.0523 (1.00) |
| 12q gain | 4 (5%) | 78 |
0.15 (1.00) |
0.00879 (1.00) |
1 (1.00) |
| 14q gain | 14 (17%) | 68 |
0.0595 (1.00) |
0.104 (1.00) |
1 (1.00) |
| 15q gain | 18 (22%) | 64 |
0.376 (1.00) |
0.0331 (1.00) |
0.291 (1.00) |
| 16p gain | 15 (18%) | 67 |
0.0421 (1.00) |
0.191 (1.00) |
0.158 (1.00) |
| 16q gain | 4 (5%) | 78 |
0.865 (1.00) |
0.658 (1.00) |
1 (1.00) |
| 17p gain | 16 (20%) | 66 |
0.208 (1.00) |
0.0276 (1.00) |
1 (1.00) |
| 17q gain | 13 (16%) | 69 |
0.185 (1.00) |
0.103 (1.00) |
0.137 (1.00) |
| 18p gain | 11 (13%) | 71 |
0.662 (1.00) |
0.15 (1.00) |
0.024 (1.00) |
| 18q gain | 11 (13%) | 71 |
0.655 (1.00) |
0.034 (1.00) |
0.024 (1.00) |
| 19p gain | 21 (26%) | 61 |
0.0128 (1.00) |
0.00306 (0.695) |
0.616 (1.00) |
| 19q gain | 15 (18%) | 67 |
0.373 (1.00) |
0.00354 (0.796) |
1 (1.00) |
| 20p gain | 21 (26%) | 61 |
0.0769 (1.00) |
0.0243 (1.00) |
0.452 (1.00) |
| 20q gain | 25 (30%) | 57 |
0.191 (1.00) |
0.0455 (1.00) |
0.474 (1.00) |
| 21q gain | 13 (16%) | 69 |
0.0483 (1.00) |
0.0244 (1.00) |
0.228 (1.00) |
| 22q gain | 16 (20%) | 66 |
0.613 (1.00) |
0.0348 (1.00) |
0.0259 (1.00) |
| xq gain | 8 (10%) | 74 |
0.755 (1.00) |
0.337 (1.00) |
1 (1.00) |
| 1p loss | 14 (17%) | 68 |
0.142 (1.00) |
0.0983 (1.00) |
0.00292 (0.665) |
| 1q loss | 11 (13%) | 71 |
0.769 (1.00) |
0.889 (1.00) |
0.344 (1.00) |
| 2p loss | 21 (26%) | 61 |
0.887 (1.00) |
0.269 (1.00) |
0.452 (1.00) |
| 2q loss | 17 (21%) | 65 |
0.121 (1.00) |
0.00807 (1.00) |
1 (1.00) |
| 3p loss | 16 (20%) | 66 |
0.0732 (1.00) |
0.408 (1.00) |
0.783 (1.00) |
| 3q loss | 18 (22%) | 64 |
0.162 (1.00) |
0.298 (1.00) |
0.792 (1.00) |
| 4p loss | 16 (20%) | 66 |
0.105 (1.00) |
0.58 (1.00) |
0.271 (1.00) |
| 4q loss | 18 (22%) | 64 |
0.929 (1.00) |
0.223 (1.00) |
0.112 (1.00) |
| 5p loss | 8 (10%) | 74 |
0.272 (1.00) |
0.642 (1.00) |
1 (1.00) |
| 5q loss | 11 (13%) | 71 |
0.579 (1.00) |
0.686 (1.00) |
0.753 (1.00) |
| 6p loss | 21 (26%) | 61 |
0.356 (1.00) |
0.896 (1.00) |
0.0773 (1.00) |
| 6q loss | 10 (12%) | 72 |
0.498 (1.00) |
0.201 (1.00) |
0.0457 (1.00) |
| 7p loss | 11 (13%) | 71 |
0.228 (1.00) |
0.638 (1.00) |
0.52 (1.00) |
| 7q loss | 9 (11%) | 73 |
0.477 (1.00) |
0.998 (1.00) |
0.483 (1.00) |
| 8p loss | 19 (23%) | 63 |
0.864 (1.00) |
0.449 (1.00) |
0.796 (1.00) |
| 8q loss | 12 (15%) | 70 |
0.502 (1.00) |
0.209 (1.00) |
0.221 (1.00) |
| 9p loss | 24 (29%) | 58 |
0.903 (1.00) |
0.0355 (1.00) |
0.629 (1.00) |
| 9q loss | 15 (18%) | 67 |
0.129 (1.00) |
0.115 (1.00) |
1 (1.00) |
| 11p loss | 33 (40%) | 49 |
0.344 (1.00) |
0.0105 (1.00) |
1 (1.00) |
| 11q loss | 29 (35%) | 53 |
0.297 (1.00) |
0.00877 (1.00) |
0.649 (1.00) |
| 12p loss | 17 (21%) | 65 |
0.686 (1.00) |
0.207 (1.00) |
0.589 (1.00) |
| 12q loss | 18 (22%) | 64 |
0.848 (1.00) |
0.647 (1.00) |
0.598 (1.00) |
| 13q loss | 39 (48%) | 43 |
0.477 (1.00) |
0.0157 (1.00) |
0.121 (1.00) |
| 14q loss | 25 (30%) | 57 |
0.0321 (1.00) |
0.613 (1.00) |
0.474 (1.00) |
| 15q loss | 14 (17%) | 68 |
0.171 (1.00) |
0.324 (1.00) |
0.565 (1.00) |
| 16p loss | 19 (23%) | 63 |
0.81 (1.00) |
0.154 (1.00) |
0.437 (1.00) |
| 16q loss | 40 (49%) | 42 |
0.312 (1.00) |
0.363 (1.00) |
0.185 (1.00) |
| 17p loss | 14 (17%) | 68 |
0.986 (1.00) |
0.193 (1.00) |
1 (1.00) |
| 17q loss | 13 (16%) | 69 |
0.887 (1.00) |
0.248 (1.00) |
0.375 (1.00) |
| 18p loss | 21 (26%) | 61 |
0.694 (1.00) |
0.709 (1.00) |
0.0225 (1.00) |
| 18q loss | 23 (28%) | 59 |
0.342 (1.00) |
0.0299 (1.00) |
0.0858 (1.00) |
| 19p loss | 5 (6%) | 77 |
0.273 (1.00) |
0.809 (1.00) |
0.196 (1.00) |
| 19q loss | 12 (15%) | 70 |
0.761 (1.00) |
0.411 (1.00) |
0.757 (1.00) |
| 20p loss | 13 (16%) | 69 |
0.928 (1.00) |
0.0582 (1.00) |
1 (1.00) |
| 20q loss | 7 (9%) | 75 |
0.349 (1.00) |
0.0401 (1.00) |
1 (1.00) |
| 21q loss | 17 (21%) | 65 |
0.291 (1.00) |
0.00855 (1.00) |
0.42 (1.00) |
| 22q loss | 27 (33%) | 55 |
0.373 (1.00) |
0.257 (1.00) |
0.482 (1.00) |
| xq loss | 31 (38%) | 51 |
0.991 (1.00) |
0.142 (1.00) |
0.495 (1.00) |
P value = 4.44e-05 (t-test), Q value = 0.01
Table S1. Gene #11: '6p gain' versus Clinical Feature #2: 'AGE'
| nPatients | Mean (Std.Dev) | |
|---|---|---|
| ALL | 82 | 62.1 (12.8) |
| 6P GAIN MUTATED | 10 | 74.7 (7.1) |
| 6P GAIN WILD-TYPE | 72 | 60.4 (12.5) |
Figure S1. Get High-res Image Gene #11: '6p gain' versus Clinical Feature #2: 'AGE'
P value = 0.000414 (t-test), Q value = 0.096
Table S2. Gene #12: '6q gain' versus Clinical Feature #2: 'AGE'
| nPatients | Mean (Std.Dev) | |
|---|---|---|
| ALL | 82 | 62.1 (12.8) |
| 6Q GAIN MUTATED | 13 | 71.9 (8.6) |
| 6Q GAIN WILD-TYPE | 69 | 60.3 (12.7) |
Figure S2. Get High-res Image Gene #12: '6q gain' versus Clinical Feature #2: 'AGE'

P value = 0.00013 (t-test), Q value = 0.03
Table S3. Gene #13: '7p gain' versus Clinical Feature #2: 'AGE'
| nPatients | Mean (Std.Dev) | |
|---|---|---|
| ALL | 82 | 62.1 (12.8) |
| 7P GAIN MUTATED | 21 | 70.1 (9.1) |
| 7P GAIN WILD-TYPE | 61 | 59.4 (12.8) |
Figure S3. Get High-res Image Gene #13: '7p gain' versus Clinical Feature #2: 'AGE'
P value = 2.87e-05 (t-test), Q value = 0.0068
Table S4. Gene #14: '7q gain' versus Clinical Feature #2: 'AGE'
| nPatients | Mean (Std.Dev) | |
|---|---|---|
| ALL | 82 | 62.1 (12.8) |
| 7Q GAIN MUTATED | 20 | 71.0 (8.8) |
| 7Q GAIN WILD-TYPE | 62 | 59.2 (12.6) |
Figure S4. Get High-res Image Gene #14: '7q gain' versus Clinical Feature #2: 'AGE'
P value = 3.93e-05 (logrank test), Q value = 0.0092
Table S5. Gene #23: '12p gain' versus Clinical Feature #1: 'Time to Death'
| nPatients | nDeath | Duration Range (Median), Month | |
|---|---|---|---|
| ALL | 82 | 24 | 0.1 - 143.4 (18.1) |
| 12P GAIN MUTATED | 8 | 6 | 0.1 - 27.2 (10.9) |
| 12P GAIN WILD-TYPE | 74 | 18 | 0.1 - 143.4 (19.7) |
Figure S5. Get High-res Image Gene #23: '12p gain' versus Clinical Feature #1: 'Time to Death'
P value = 3.66e-05 (t-test), Q value = 0.0086
Table S6. Gene #23: '12p gain' versus Clinical Feature #2: 'AGE'
| nPatients | Mean (Std.Dev) | |
|---|---|---|
| ALL | 82 | 62.1 (12.8) |
| 12P GAIN MUTATED | 8 | 74.9 (5.7) |
| 12P GAIN WILD-TYPE | 74 | 60.7 (12.6) |
Figure S6. Get High-res Image Gene #23: '12p gain' versus Clinical Feature #2: 'AGE'
P value = 0.000705 (Fisher's exact test), Q value = 0.16
Table S7. Gene #58: '10p loss' versus Clinical Feature #3: 'GENDER'
| nPatients | FEMALE | MALE |
|---|---|---|
| ALL | 40 | 42 |
| 10P LOSS MUTATED | 25 | 10 |
| 10P LOSS WILD-TYPE | 15 | 32 |
Figure S7. Get High-res Image Gene #58: '10p loss' versus Clinical Feature #3: 'GENDER'
P value = 0.00014 (Fisher's exact test), Q value = 0.032
Table S8. Gene #59: '10q loss' versus Clinical Feature #3: 'GENDER'
| nPatients | FEMALE | MALE |
|---|---|---|
| ALL | 40 | 42 |
| 10Q LOSS MUTATED | 29 | 12 |
| 10Q LOSS WILD-TYPE | 11 | 30 |
Figure S8. Get High-res Image Gene #59: '10q loss' versus Clinical Feature #3: 'GENDER'
-
Copy number data file = transformed.cor.cli.txt
-
Clinical data file = SARC-TP.merged_data.txt
-
Number of patients = 82
-
Number of significantly arm-level cnvs = 79
-
Number of selected clinical features = 3
-
Exclude regions that fewer than K tumors have mutations, K = 3
For survival clinical features, the Kaplan-Meier survival curves of tumors with and without gene mutations were plotted and the statistical significance P values were estimated by logrank test (Bland and Altman 2004) using the 'survdiff' function in R
For continuous numerical clinical features, two-tailed Student's t test with unequal variance (Lehmann and Romano 2005) was applied to compare the clinical values between tumors with and without gene mutations using 't.test' function in R
For binary or multi-class clinical features (nominal or ordinal), two-tailed Fisher's exact tests (Fisher 1922) were used to estimate the P values using the 'fisher.test' function in R
For multiple hypothesis correction, Q value is the False Discovery Rate (FDR) analogue of the P value (Benjamini and Hochberg 1995), defined as the minimum FDR at which the test may be called significant. We used the 'Benjamini and Hochberg' method of 'p.adjust' function in R to convert P values into Q values.
In addition to the links below, the full results of the analysis summarized in this report can also be downloaded programmatically using firehose_get, or interactively from either the Broad GDAC website or TCGA Data Coordination Center Portal.