This pipeline computes the correlation between significant copy number variation (cnv focal) genes and selected clinical features.
Testing the association between copy number variation 54 focal events and 3 clinical features across 82 patients, 2 significant findings detected with Q value < 0.25.
-
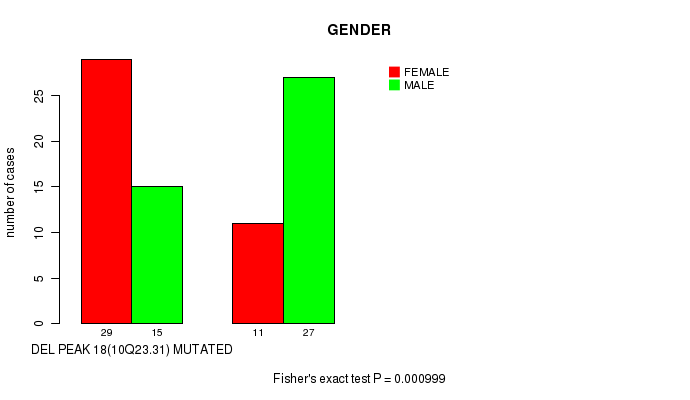
del_10q23.31 cnv correlated to 'GENDER'.
-
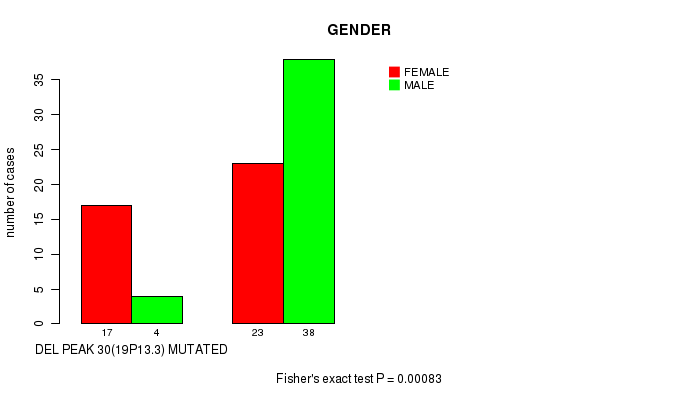
del_19p13.3 cnv correlated to 'GENDER'.
Table 1. Get Full Table Overview of the association between significant copy number variation of 54 focal events and 3 clinical features. Shown in the table are P values (Q values). Thresholded by Q value < 0.25, 2 significant findings detected.
|
Clinical Features |
Time to Death |
AGE | GENDER | ||
| nCNV (%) | nWild-Type | logrank test | t-test | Fisher's exact test | |
| del 10q23 31 | 44 (54%) | 38 |
0.232 (1.00) |
0.474 (1.00) |
0.000999 (0.161) |
| del 19p13 3 | 21 (26%) | 61 |
0.536 (1.00) |
0.563 (1.00) |
0.00083 (0.134) |
| amp 1p32 1 | 27 (33%) | 55 |
0.101 (1.00) |
0.142 (1.00) |
0.643 (1.00) |
| amp 1q24 3 | 32 (39%) | 50 |
0.967 (1.00) |
0.819 (1.00) |
0.824 (1.00) |
| amp 3p11 2 | 18 (22%) | 64 |
0.406 (1.00) |
0.0466 (1.00) |
1 (1.00) |
| amp 5p15 33 | 36 (44%) | 46 |
0.0573 (1.00) |
0.00631 (0.965) |
0.657 (1.00) |
| amp 6p21 1 | 17 (21%) | 65 |
0.161 (1.00) |
0.00398 (0.62) |
0.42 (1.00) |
| amp 6q24 3 | 26 (32%) | 56 |
0.489 (1.00) |
0.15 (1.00) |
0.482 (1.00) |
| amp 7p21 3 | 25 (30%) | 57 |
0.984 (1.00) |
0.00974 (1.00) |
0.474 (1.00) |
| amp 8q21 12 | 28 (34%) | 54 |
0.00565 (0.87) |
0.0849 (1.00) |
0.818 (1.00) |
| amp 11q22 2 | 14 (17%) | 68 |
0.532 (1.00) |
0.501 (1.00) |
0.771 (1.00) |
| amp 12p13 32 | 17 (21%) | 65 |
0.112 (1.00) |
0.178 (1.00) |
1 (1.00) |
| amp 12q15 | 37 (45%) | 45 |
0.998 (1.00) |
0.392 (1.00) |
0.0021 (0.333) |
| amp 17p12 | 27 (33%) | 55 |
0.581 (1.00) |
0.376 (1.00) |
0.241 (1.00) |
| amp 19p13 2 | 29 (35%) | 53 |
0.797 (1.00) |
0.276 (1.00) |
0.171 (1.00) |
| amp 19q12 | 28 (34%) | 54 |
0.2 (1.00) |
0.0964 (1.00) |
1 (1.00) |
| amp 20q12 | 32 (39%) | 50 |
0.153 (1.00) |
0.0095 (1.00) |
0.651 (1.00) |
| amp xp21 1 | 22 (27%) | 60 |
0.9 (1.00) |
0.716 (1.00) |
0.322 (1.00) |
| amp xq21 1 | 12 (15%) | 70 |
0.154 (1.00) |
0.0324 (1.00) |
1 (1.00) |
| del 1p36 32 | 30 (37%) | 52 |
0.0271 (1.00) |
0.0631 (1.00) |
0.0662 (1.00) |
| del 1q43 | 22 (27%) | 60 |
0.999 (1.00) |
0.356 (1.00) |
0.805 (1.00) |
| del 2p25 3 | 26 (32%) | 56 |
0.456 (1.00) |
0.179 (1.00) |
0.00408 (0.633) |
| del 2q37 3 | 30 (37%) | 52 |
0.216 (1.00) |
0.266 (1.00) |
0.647 (1.00) |
| del 2q37 3 | 30 (37%) | 52 |
0.621 (1.00) |
0.0387 (1.00) |
0.647 (1.00) |
| del 3p21 31 | 17 (21%) | 65 |
0.153 (1.00) |
0.00794 (1.00) |
0.42 (1.00) |
| del 3q26 31 | 19 (23%) | 63 |
0.472 (1.00) |
0.236 (1.00) |
1 (1.00) |
| del 4q35 1 | 32 (39%) | 50 |
0.211 (1.00) |
0.365 (1.00) |
0.174 (1.00) |
| del 5q31 1 | 9 (11%) | 73 |
0.938 (1.00) |
0.998 (1.00) |
0.307 (1.00) |
| del 6p24 3 | 31 (38%) | 51 |
0.745 (1.00) |
0.56 (1.00) |
0.111 (1.00) |
| del 6q14 1 | 18 (22%) | 64 |
0.365 (1.00) |
0.217 (1.00) |
0.598 (1.00) |
| del 7q36 3 | 19 (23%) | 63 |
0.495 (1.00) |
0.683 (1.00) |
0.299 (1.00) |
| del 8p23 3 | 24 (29%) | 58 |
0.82 (1.00) |
0.983 (1.00) |
0.229 (1.00) |
| del 9p24 3 | 32 (39%) | 50 |
0.934 (1.00) |
0.0017 (0.272) |
0.651 (1.00) |
| del 9p21 3 | 37 (45%) | 45 |
0.825 (1.00) |
0.073 (1.00) |
0.506 (1.00) |
| del 9q34 3 | 18 (22%) | 64 |
0.204 (1.00) |
0.501 (1.00) |
0.598 (1.00) |
| del 10p15 3 | 38 (46%) | 44 |
0.558 (1.00) |
0.179 (1.00) |
0.0758 (1.00) |
| del 11p15 5 | 34 (41%) | 48 |
0.172 (1.00) |
0.00966 (1.00) |
1 (1.00) |
| del 11q24 3 | 37 (45%) | 45 |
0.272 (1.00) |
0.00373 (0.589) |
1 (1.00) |
| del 12p13 1 | 21 (26%) | 61 |
0.702 (1.00) |
0.498 (1.00) |
0.0432 (1.00) |
| del 12q12 | 17 (21%) | 65 |
0.587 (1.00) |
0.768 (1.00) |
1 (1.00) |
| del 13q14 2 | 55 (67%) | 27 |
0.373 (1.00) |
0.0252 (1.00) |
0.0621 (1.00) |
| del 14q24 1 | 32 (39%) | 50 |
0.161 (1.00) |
0.441 (1.00) |
0.174 (1.00) |
| del 16q12 1 | 44 (54%) | 38 |
0.395 (1.00) |
0.322 (1.00) |
0.128 (1.00) |
| del 17p13 3 | 27 (33%) | 55 |
0.141 (1.00) |
0.615 (1.00) |
0.815 (1.00) |
| del 17p13 1 | 33 (40%) | 49 |
0.724 (1.00) |
0.823 (1.00) |
0.115 (1.00) |
| del 17q11 2 | 18 (22%) | 64 |
0.333 (1.00) |
0.0967 (1.00) |
1 (1.00) |
| del 17q25 3 | 23 (28%) | 59 |
0.385 (1.00) |
0.191 (1.00) |
0.807 (1.00) |
| del 19q13 43 | 29 (35%) | 53 |
0.747 (1.00) |
0.71 (1.00) |
0.249 (1.00) |
| del 21q11 2 | 16 (20%) | 66 |
0.8 (1.00) |
0.34 (1.00) |
1 (1.00) |
| del 21q22 3 | 25 (30%) | 57 |
0.841 (1.00) |
0.00385 (0.604) |
0.474 (1.00) |
| del 22q13 31 | 32 (39%) | 50 |
0.27 (1.00) |
0.19 (1.00) |
0.174 (1.00) |
| del xp22 32 | 27 (33%) | 55 |
0.334 (1.00) |
0.0656 (1.00) |
0.482 (1.00) |
| del xq21 1 | 41 (50%) | 41 |
0.156 (1.00) |
0.139 (1.00) |
0.269 (1.00) |
| del xq27 1 | 39 (48%) | 43 |
0.822 (1.00) |
0.322 (1.00) |
0.269 (1.00) |
P value = 0.000999 (Fisher's exact test), Q value = 0.16
Table S1. Gene #35: 'del_10q23.31' versus Clinical Feature #3: 'GENDER'
| nPatients | FEMALE | MALE |
|---|---|---|
| ALL | 40 | 42 |
| DEL PEAK 18(10Q23.31) MUTATED | 29 | 15 |
| DEL PEAK 18(10Q23.31) WILD-TYPE | 11 | 27 |
Figure S1. Get High-res Image Gene #35: 'del_10q23.31' versus Clinical Feature #3: 'GENDER'
P value = 0.00083 (Fisher's exact test), Q value = 0.13
Table S2. Gene #47: 'del_19p13.3' versus Clinical Feature #3: 'GENDER'
| nPatients | FEMALE | MALE |
|---|---|---|
| ALL | 40 | 42 |
| DEL PEAK 30(19P13.3) MUTATED | 17 | 4 |
| DEL PEAK 30(19P13.3) WILD-TYPE | 23 | 38 |
Figure S2. Get High-res Image Gene #47: 'del_19p13.3' versus Clinical Feature #3: 'GENDER'
-
Copy number data file = transformed.cor.cli.txt
-
Clinical data file = SARC-TP.merged_data.txt
-
Number of patients = 82
-
Number of significantly focal cnvs = 54
-
Number of selected clinical features = 3
-
Exclude genes that fewer than K tumors have mutations, K = 3
For survival clinical features, the Kaplan-Meier survival curves of tumors with and without gene mutations were plotted and the statistical significance P values were estimated by logrank test (Bland and Altman 2004) using the 'survdiff' function in R
For continuous numerical clinical features, two-tailed Student's t test with unequal variance (Lehmann and Romano 2005) was applied to compare the clinical values between tumors with and without gene mutations using 't.test' function in R
For binary or multi-class clinical features (nominal or ordinal), two-tailed Fisher's exact tests (Fisher 1922) were used to estimate the P values using the 'fisher.test' function in R
For multiple hypothesis correction, Q value is the False Discovery Rate (FDR) analogue of the P value (Benjamini and Hochberg 1995), defined as the minimum FDR at which the test may be called significant. We used the 'Benjamini and Hochberg' method of 'p.adjust' function in R to convert P values into Q values.
In addition to the links below, the full results of the analysis summarized in this report can also be downloaded programmatically using firehose_get, or interactively from either the Broad GDAC website or TCGA Data Coordination Center Portal.