This pipeline computes the correlation between significant arm-level copy number variations (cnvs) and molecular subtypes.
Testing the association between copy number variation 80 arm-level events and 8 molecular subtypes across 127 patients, 14 significant findings detected with P value < 0.05 and Q value < 0.25.
-
19p gain cnv correlated to 'CN_CNMF'.
-
2p loss cnv correlated to 'METHLYATION_CNMF', 'MRNASEQ_CNMF', and 'MIRSEQ_MATURE_CHIERARCHICAL'.
-
10p loss cnv correlated to 'METHLYATION_CNMF' and 'MRNASEQ_CNMF'.
-
10q loss cnv correlated to 'CN_CNMF', 'METHLYATION_CNMF', 'MRNASEQ_CNMF', and 'MRNASEQ_CHIERARCHICAL'.
-
16q loss cnv correlated to 'CN_CNMF', 'METHLYATION_CNMF', and 'MIRSEQ_CNMF'.
-
xq loss cnv correlated to 'METHLYATION_CNMF'.
Table 1. Get Full Table Overview of the association between significant copy number variation of 80 arm-level events and 8 molecular subtypes. Shown in the table are P values (Q values). Thresholded by P value < 0.05 and Q value < 0.25, 14 significant findings detected.
|
Clinical Features |
CN CNMF |
METHLYATION CNMF |
MRNASEQ CNMF |
MRNASEQ CHIERARCHICAL |
MIRSEQ CNMF |
MIRSEQ CHIERARCHICAL |
MIRSEQ MATURE CNMF |
MIRSEQ MATURE CHIERARCHICAL |
||
| nCNV (%) | nWild-Type | Fisher's exact test | Fisher's exact test | Fisher's exact test | Fisher's exact test | Fisher's exact test | Fisher's exact test | Fisher's exact test | Fisher's exact test | |
| 10q loss | 66 (52%) | 61 |
6.97e-08 (4.46e-05) |
4.82e-07 (0.000307) |
3.03e-07 (0.000193) |
3.52e-05 (0.0223) |
0.00277 (1.00) |
0.00231 (1.00) |
0.00123 (0.748) |
0.000543 (0.337) |
| 2p loss | 39 (31%) | 88 |
0.000511 (0.318) |
0.000114 (0.072) |
8.53e-05 (0.0539) |
0.000478 (0.298) |
0.00313 (1.00) |
0.00217 (1.00) |
0.00523 (1.00) |
0.000119 (0.0749) |
| 16q loss | 64 (50%) | 63 |
1.87e-05 (0.0118) |
3.35e-06 (0.00213) |
0.000961 (0.592) |
0.00153 (0.923) |
0.000212 (0.133) |
0.00427 (1.00) |
0.00651 (1.00) |
0.0011 (0.672) |
| 10p loss | 56 (44%) | 71 |
0.00146 (0.886) |
0.000171 (0.107) |
0.000257 (0.161) |
0.0234 (1.00) |
0.0527 (1.00) |
0.0898 (1.00) |
0.225 (1.00) |
0.107 (1.00) |
| 19p gain | 36 (28%) | 91 |
1.65e-05 (0.0105) |
0.139 (1.00) |
0.606 (1.00) |
0.353 (1.00) |
0.45 (1.00) |
0.515 (1.00) |
0.757 (1.00) |
0.755 (1.00) |
| xq loss | 48 (38%) | 79 |
0.0321 (1.00) |
2.95e-07 (0.000189) |
0.0547 (1.00) |
0.00136 (0.83) |
0.325 (1.00) |
0.251 (1.00) |
0.115 (1.00) |
0.0783 (1.00) |
| 1p gain | 27 (21%) | 100 |
0.000662 (0.411) |
0.00737 (1.00) |
0.146 (1.00) |
0.671 (1.00) |
0.302 (1.00) |
1 (1.00) |
0.552 (1.00) |
0.212 (1.00) |
| 1q gain | 28 (22%) | 99 |
0.000789 (0.488) |
0.06 (1.00) |
0.0544 (1.00) |
0.0856 (1.00) |
0.383 (1.00) |
0.222 (1.00) |
0.21 (1.00) |
0.0193 (1.00) |
| 2p gain | 10 (8%) | 117 |
0.058 (1.00) |
0.00772 (1.00) |
0.174 (1.00) |
0.079 (1.00) |
0.0947 (1.00) |
0.308 (1.00) |
0.0434 (1.00) |
0.168 (1.00) |
| 2q gain | 7 (6%) | 120 |
0.148 (1.00) |
0.127 (1.00) |
0.484 (1.00) |
0.205 (1.00) |
0.184 (1.00) |
0.514 (1.00) |
0.151 (1.00) |
0.308 (1.00) |
| 3p gain | 12 (9%) | 115 |
0.00957 (1.00) |
0.347 (1.00) |
0.0608 (1.00) |
0.146 (1.00) |
0.17 (1.00) |
0.356 (1.00) |
0.407 (1.00) |
0.00443 (1.00) |
| 3q gain | 11 (9%) | 116 |
0.0196 (1.00) |
0.924 (1.00) |
0.0943 (1.00) |
0.38 (1.00) |
0.542 (1.00) |
0.438 (1.00) |
0.307 (1.00) |
0.00817 (1.00) |
| 4p gain | 25 (20%) | 102 |
0.0798 (1.00) |
0.12 (1.00) |
0.461 (1.00) |
1 (1.00) |
0.32 (1.00) |
0.227 (1.00) |
0.424 (1.00) |
0.548 (1.00) |
| 4q gain | 20 (16%) | 107 |
0.555 (1.00) |
0.501 (1.00) |
0.863 (1.00) |
1 (1.00) |
0.967 (1.00) |
0.424 (1.00) |
0.681 (1.00) |
1 (1.00) |
| 5p gain | 42 (33%) | 85 |
0.00102 (0.629) |
0.327 (1.00) |
0.0695 (1.00) |
1 (1.00) |
0.155 (1.00) |
0.617 (1.00) |
0.0453 (1.00) |
0.128 (1.00) |
| 5q gain | 34 (27%) | 93 |
0.0386 (1.00) |
0.337 (1.00) |
0.285 (1.00) |
1 (1.00) |
0.187 (1.00) |
0.673 (1.00) |
0.209 (1.00) |
0.708 (1.00) |
| 6p gain | 24 (19%) | 103 |
0.0178 (1.00) |
0.000405 (0.253) |
0.034 (1.00) |
0.0265 (1.00) |
0.0378 (1.00) |
0.511 (1.00) |
0.0158 (1.00) |
0.548 (1.00) |
| 6q gain | 24 (19%) | 103 |
0.0132 (1.00) |
0.00337 (1.00) |
0.0391 (1.00) |
0.0161 (1.00) |
0.327 (1.00) |
0.0932 (1.00) |
0.0346 (1.00) |
0.196 (1.00) |
| 7p gain | 34 (27%) | 93 |
0.0371 (1.00) |
0.337 (1.00) |
0.0727 (1.00) |
0.353 (1.00) |
0.772 (1.00) |
0.696 (1.00) |
0.688 (1.00) |
1 (1.00) |
| 7q gain | 29 (23%) | 98 |
0.0636 (1.00) |
0.555 (1.00) |
0.554 (1.00) |
0.189 (1.00) |
0.516 (1.00) |
0.465 (1.00) |
0.209 (1.00) |
1 (1.00) |
| 8p gain | 27 (21%) | 100 |
0.158 (1.00) |
0.935 (1.00) |
0.336 (1.00) |
1 (1.00) |
0.354 (1.00) |
0.33 (1.00) |
0.623 (1.00) |
0.461 (1.00) |
| 8q gain | 33 (26%) | 94 |
0.0643 (1.00) |
0.333 (1.00) |
0.0387 (1.00) |
0.79 (1.00) |
0.101 (1.00) |
0.329 (1.00) |
0.472 (1.00) |
0.109 (1.00) |
| 9p gain | 24 (19%) | 103 |
0.184 (1.00) |
0.0203 (1.00) |
0.23 (1.00) |
0.249 (1.00) |
0.15 (1.00) |
0.626 (1.00) |
0.266 (1.00) |
0.441 (1.00) |
| 9q gain | 30 (24%) | 97 |
0.0378 (1.00) |
0.0978 (1.00) |
0.274 (1.00) |
0.0925 (1.00) |
0.267 (1.00) |
0.648 (1.00) |
0.0595 (1.00) |
0.428 (1.00) |
| 10p gain | 12 (9%) | 115 |
0.0697 (1.00) |
0.218 (1.00) |
0.712 (1.00) |
0.459 (1.00) |
0.241 (1.00) |
0.292 (1.00) |
0.294 (1.00) |
0.332 (1.00) |
| 10q gain | 6 (5%) | 121 |
0.487 (1.00) |
0.0859 (1.00) |
0.305 (1.00) |
0.185 (1.00) |
0.223 (1.00) |
0.64 (1.00) |
0.0406 (1.00) |
1 (1.00) |
| 11p gain | 8 (6%) | 119 |
0.23 (1.00) |
0.661 (1.00) |
0.15 (1.00) |
1 (1.00) |
0.183 (1.00) |
0.218 (1.00) |
0.283 (1.00) |
0.255 (1.00) |
| 11q gain | 8 (6%) | 119 |
0.65 (1.00) |
0.468 (1.00) |
0.228 (1.00) |
0.616 (1.00) |
0.266 (1.00) |
0.292 (1.00) |
0.626 (1.00) |
0.332 (1.00) |
| 12p gain | 15 (12%) | 112 |
0.608 (1.00) |
0.396 (1.00) |
0.703 (1.00) |
0.165 (1.00) |
0.041 (1.00) |
1 (1.00) |
0.228 (1.00) |
0.671 (1.00) |
| 12q gain | 9 (7%) | 118 |
0.829 (1.00) |
0.566 (1.00) |
0.384 (1.00) |
0.799 (1.00) |
0.331 (1.00) |
1 (1.00) |
0.772 (1.00) |
0.728 (1.00) |
| 13q gain | 6 (5%) | 121 |
0.375 (1.00) |
0.24 (1.00) |
0.112 (1.00) |
0.0475 (1.00) |
0.523 (1.00) |
0.0106 (1.00) |
0.0984 (1.00) |
0.155 (1.00) |
| 14q gain | 24 (19%) | 103 |
0.184 (1.00) |
0.105 (1.00) |
0.317 (1.00) |
0.78 (1.00) |
0.481 (1.00) |
1 (1.00) |
0.895 (1.00) |
0.693 (1.00) |
| 15q gain | 32 (25%) | 95 |
0.00415 (1.00) |
0.436 (1.00) |
0.00681 (1.00) |
0.0408 (1.00) |
0.0498 (1.00) |
0.0292 (1.00) |
0.0683 (1.00) |
0.00529 (1.00) |
| 16p gain | 18 (14%) | 109 |
0.023 (1.00) |
0.627 (1.00) |
0.724 (1.00) |
1 (1.00) |
0.68 (1.00) |
0.206 (1.00) |
1 (1.00) |
0.47 (1.00) |
| 16q gain | 6 (5%) | 121 |
0.0732 (1.00) |
0.281 (1.00) |
0.861 (1.00) |
0.484 (1.00) |
0.83 (1.00) |
1 (1.00) |
0.491 (1.00) |
0.685 (1.00) |
| 17p gain | 26 (20%) | 101 |
0.00137 (0.834) |
0.0206 (1.00) |
0.513 (1.00) |
0.444 (1.00) |
0.369 (1.00) |
0.269 (1.00) |
0.255 (1.00) |
0.178 (1.00) |
| 17q gain | 23 (18%) | 104 |
0.0733 (1.00) |
0.0501 (1.00) |
0.173 (1.00) |
0.616 (1.00) |
0.461 (1.00) |
0.319 (1.00) |
1 (1.00) |
0.239 (1.00) |
| 18p gain | 20 (16%) | 107 |
0.00836 (1.00) |
0.024 (1.00) |
0.826 (1.00) |
0.82 (1.00) |
0.398 (1.00) |
0.424 (1.00) |
0.908 (1.00) |
0.225 (1.00) |
| 18q gain | 18 (14%) | 109 |
0.226 (1.00) |
0.307 (1.00) |
0.67 (1.00) |
1 (1.00) |
0.763 (1.00) |
0.371 (1.00) |
1 (1.00) |
1 (1.00) |
| 19q gain | 26 (20%) | 101 |
0.000402 (0.251) |
0.369 (1.00) |
0.813 (1.00) |
0.379 (1.00) |
0.434 (1.00) |
0.826 (1.00) |
0.192 (1.00) |
1 (1.00) |
| 20p gain | 32 (25%) | 95 |
0.128 (1.00) |
0.192 (1.00) |
0.732 (1.00) |
0.539 (1.00) |
0.569 (1.00) |
0.695 (1.00) |
0.306 (1.00) |
0.733 (1.00) |
| 20q gain | 40 (31%) | 87 |
0.0964 (1.00) |
0.00914 (1.00) |
1 (1.00) |
0.212 (1.00) |
0.221 (1.00) |
1 (1.00) |
0.0986 (1.00) |
0.451 (1.00) |
| 21q gain | 31 (24%) | 96 |
0.00839 (1.00) |
0.00155 (0.934) |
0.407 (1.00) |
0.279 (1.00) |
0.2 (1.00) |
0.85 (1.00) |
0.287 (1.00) |
0.275 (1.00) |
| 22q gain | 30 (24%) | 97 |
0.0214 (1.00) |
0.836 (1.00) |
0.428 (1.00) |
0.392 (1.00) |
0.201 (1.00) |
0.228 (1.00) |
0.139 (1.00) |
0.322 (1.00) |
| xq gain | 15 (12%) | 112 |
0.00767 (1.00) |
0.0636 (1.00) |
0.827 (1.00) |
1 (1.00) |
0.0737 (1.00) |
1 (1.00) |
0.124 (1.00) |
1 (1.00) |
| 1p loss | 15 (12%) | 112 |
0.485 (1.00) |
0.362 (1.00) |
0.0509 (1.00) |
0.849 (1.00) |
0.477 (1.00) |
0.348 (1.00) |
0.748 (1.00) |
1 (1.00) |
| 1q loss | 15 (12%) | 112 |
0.404 (1.00) |
0.242 (1.00) |
0.683 (1.00) |
0.818 (1.00) |
0.876 (1.00) |
0.693 (1.00) |
0.733 (1.00) |
0.528 (1.00) |
| 2q loss | 31 (24%) | 96 |
0.0516 (1.00) |
0.315 (1.00) |
0.684 (1.00) |
0.721 (1.00) |
0.712 (1.00) |
0.469 (1.00) |
0.829 (1.00) |
0.109 (1.00) |
| 3p loss | 25 (20%) | 102 |
0.0113 (1.00) |
0.00496 (1.00) |
0.00529 (1.00) |
0.00308 (1.00) |
0.0447 (1.00) |
0.00838 (1.00) |
0.0042 (1.00) |
0.00273 (1.00) |
| 3q loss | 30 (24%) | 97 |
0.0273 (1.00) |
0.00276 (1.00) |
0.0103 (1.00) |
0.00252 (1.00) |
0.131 (1.00) |
0.00642 (1.00) |
0.00993 (1.00) |
0.002 (1.00) |
| 4p loss | 21 (17%) | 106 |
0.0219 (1.00) |
0.00294 (1.00) |
0.132 (1.00) |
0.387 (1.00) |
0.159 (1.00) |
0.589 (1.00) |
0.895 (1.00) |
0.618 (1.00) |
| 4q loss | 22 (17%) | 105 |
0.0109 (1.00) |
0.00116 (0.709) |
0.0779 (1.00) |
0.855 (1.00) |
0.264 (1.00) |
0.826 (1.00) |
1 (1.00) |
1 (1.00) |
| 5p loss | 12 (9%) | 115 |
0.86 (1.00) |
0.236 (1.00) |
0.207 (1.00) |
0.332 (1.00) |
0.865 (1.00) |
0.312 (1.00) |
0.529 (1.00) |
0.189 (1.00) |
| 5q loss | 15 (12%) | 112 |
0.269 (1.00) |
0.274 (1.00) |
0.0465 (1.00) |
0.27 (1.00) |
1 (1.00) |
0.366 (1.00) |
0.589 (1.00) |
0.388 (1.00) |
| 6p loss | 27 (21%) | 100 |
0.407 (1.00) |
0.0147 (1.00) |
0.0799 (1.00) |
0.0516 (1.00) |
0.0843 (1.00) |
0.33 (1.00) |
0.123 (1.00) |
0.461 (1.00) |
| 6q loss | 17 (13%) | 110 |
0.0692 (1.00) |
0.00626 (1.00) |
0.0411 (1.00) |
0.175 (1.00) |
0.0536 (1.00) |
0.299 (1.00) |
0.282 (1.00) |
0.25 (1.00) |
| 7p loss | 20 (16%) | 107 |
0.289 (1.00) |
0.0361 (1.00) |
0.119 (1.00) |
0.387 (1.00) |
0.486 (1.00) |
1 (1.00) |
0.878 (1.00) |
0.195 (1.00) |
| 7q loss | 19 (15%) | 108 |
0.292 (1.00) |
0.184 (1.00) |
0.119 (1.00) |
0.387 (1.00) |
0.846 (1.00) |
1 (1.00) |
0.641 (1.00) |
0.195 (1.00) |
| 8p loss | 26 (20%) | 101 |
0.818 (1.00) |
0.157 (1.00) |
0.245 (1.00) |
0.357 (1.00) |
0.231 (1.00) |
0.00634 (1.00) |
0.551 (1.00) |
0.309 (1.00) |
| 8q loss | 16 (13%) | 111 |
0.219 (1.00) |
0.587 (1.00) |
0.549 (1.00) |
0.418 (1.00) |
0.78 (1.00) |
0.115 (1.00) |
0.589 (1.00) |
0.388 (1.00) |
| 9p loss | 39 (31%) | 88 |
0.0975 (1.00) |
0.327 (1.00) |
0.876 (1.00) |
0.0984 (1.00) |
0.127 (1.00) |
0.255 (1.00) |
0.0954 (1.00) |
0.238 (1.00) |
| 9q loss | 26 (20%) | 101 |
0.351 (1.00) |
0.174 (1.00) |
0.432 (1.00) |
0.379 (1.00) |
0.149 (1.00) |
0.551 (1.00) |
0.118 (1.00) |
0.178 (1.00) |
| 11p loss | 45 (35%) | 82 |
0.000796 (0.492) |
0.00393 (1.00) |
0.549 (1.00) |
0.144 (1.00) |
0.821 (1.00) |
0.211 (1.00) |
0.378 (1.00) |
0.184 (1.00) |
| 11q loss | 39 (31%) | 88 |
0.00105 (0.646) |
0.00815 (1.00) |
0.632 (1.00) |
0.0648 (1.00) |
0.186 (1.00) |
0.056 (1.00) |
0.0366 (1.00) |
0.0446 (1.00) |
| 12p loss | 28 (22%) | 99 |
0.054 (1.00) |
0.00703 (1.00) |
0.828 (1.00) |
0.821 (1.00) |
0.571 (1.00) |
0.312 (1.00) |
0.742 (1.00) |
0.579 (1.00) |
| 12q loss | 27 (21%) | 100 |
0.0061 (1.00) |
0.00737 (1.00) |
1 (1.00) |
0.678 (1.00) |
0.969 (1.00) |
0.356 (1.00) |
0.667 (1.00) |
0.592 (1.00) |
| 13q loss | 65 (51%) | 62 |
0.00042 (0.262) |
0.00186 (1.00) |
0.66 (1.00) |
0.167 (1.00) |
0.78 (1.00) |
0.87 (1.00) |
0.791 (1.00) |
1 (1.00) |
| 14q loss | 37 (29%) | 90 |
0.456 (1.00) |
0.689 (1.00) |
0.00683 (1.00) |
0.367 (1.00) |
0.185 (1.00) |
0.886 (1.00) |
0.528 (1.00) |
0.409 (1.00) |
| 15q loss | 20 (16%) | 107 |
0.0801 (1.00) |
0.0386 (1.00) |
0.0199 (1.00) |
0.0668 (1.00) |
0.0149 (1.00) |
0.0625 (1.00) |
0.0666 (1.00) |
0.0944 (1.00) |
| 16p loss | 35 (28%) | 92 |
0.00788 (1.00) |
0.000816 (0.503) |
0.709 (1.00) |
0.531 (1.00) |
0.283 (1.00) |
1 (1.00) |
0.762 (1.00) |
0.305 (1.00) |
| 17p loss | 25 (20%) | 102 |
0.163 (1.00) |
0.319 (1.00) |
0.317 (1.00) |
0.732 (1.00) |
0.438 (1.00) |
0.62 (1.00) |
0.303 (1.00) |
0.426 (1.00) |
| 17q loss | 23 (18%) | 104 |
0.00119 (0.73) |
0.258 (1.00) |
0.00427 (1.00) |
0.11 (1.00) |
0.089 (1.00) |
0.0956 (1.00) |
0.185 (1.00) |
0.0371 (1.00) |
| 18p loss | 30 (24%) | 97 |
0.257 (1.00) |
0.0464 (1.00) |
0.408 (1.00) |
0.721 (1.00) |
0.891 (1.00) |
1 (1.00) |
0.951 (1.00) |
1 (1.00) |
| 18q loss | 32 (25%) | 95 |
0.0133 (1.00) |
0.0134 (1.00) |
0.835 (1.00) |
0.599 (1.00) |
0.775 (1.00) |
0.842 (1.00) |
0.642 (1.00) |
0.833 (1.00) |
| 19p loss | 9 (7%) | 118 |
0.0427 (1.00) |
0.0568 (1.00) |
0.484 (1.00) |
1 (1.00) |
0.941 (1.00) |
0.754 (1.00) |
1 (1.00) |
1 (1.00) |
| 19q loss | 17 (13%) | 110 |
0.173 (1.00) |
0.00841 (1.00) |
0.939 (1.00) |
0.76 (1.00) |
0.846 (1.00) |
0.653 (1.00) |
0.641 (1.00) |
0.713 (1.00) |
| 20p loss | 22 (17%) | 105 |
0.344 (1.00) |
0.241 (1.00) |
0.234 (1.00) |
0.858 (1.00) |
0.728 (1.00) |
0.272 (1.00) |
0.821 (1.00) |
0.683 (1.00) |
| 20q loss | 10 (8%) | 117 |
0.0279 (1.00) |
0.772 (1.00) |
0.275 (1.00) |
0.653 (1.00) |
0.42 (1.00) |
0.0427 (1.00) |
0.772 (1.00) |
0.308 (1.00) |
| 21q loss | 24 (19%) | 103 |
0.073 (1.00) |
0.173 (1.00) |
0.371 (1.00) |
0.379 (1.00) |
0.0659 (1.00) |
0.0935 (1.00) |
0.416 (1.00) |
0.386 (1.00) |
| 22q loss | 38 (30%) | 89 |
0.0145 (1.00) |
0.00146 (0.887) |
0.0333 (1.00) |
0.227 (1.00) |
0.724 (1.00) |
0.866 (1.00) |
0.747 (1.00) |
0.736 (1.00) |
P value = 1.65e-05 (Fisher's exact test), Q value = 0.011
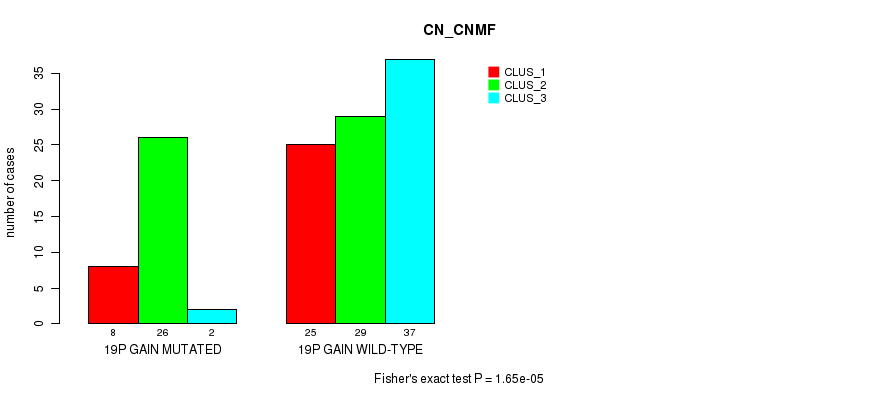
Table S1. Gene #34: '19p gain' versus Molecular Subtype #1: 'CN_CNMF'
| nPatients | CLUS_1 | CLUS_2 | CLUS_3 |
|---|---|---|---|
| ALL | 33 | 55 | 39 |
| 19P GAIN MUTATED | 8 | 26 | 2 |
| 19P GAIN WILD-TYPE | 25 | 29 | 37 |
Figure S1. Get High-res Image Gene #34: '19p gain' versus Molecular Subtype #1: 'CN_CNMF'
P value = 0.000114 (Fisher's exact test), Q value = 0.072
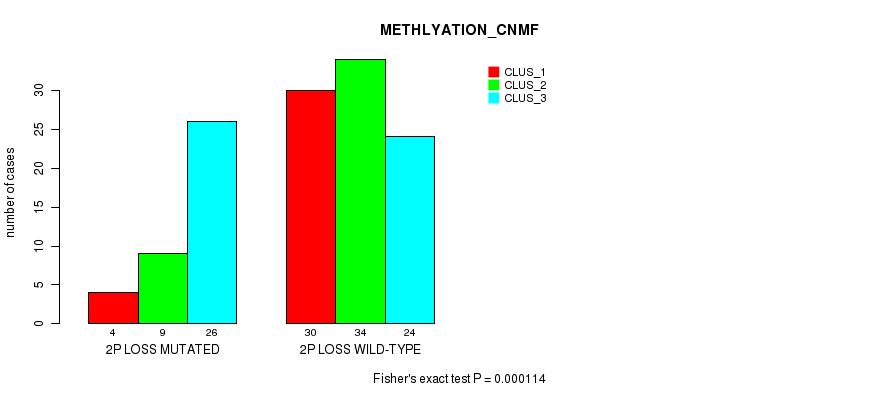
Table S2. Gene #43: '2p loss' versus Molecular Subtype #2: 'METHLYATION_CNMF'
| nPatients | CLUS_1 | CLUS_2 | CLUS_3 |
|---|---|---|---|
| ALL | 34 | 43 | 50 |
| 2P LOSS MUTATED | 4 | 9 | 26 |
| 2P LOSS WILD-TYPE | 30 | 34 | 24 |
Figure S2. Get High-res Image Gene #43: '2p loss' versus Molecular Subtype #2: 'METHLYATION_CNMF'
P value = 8.53e-05 (Fisher's exact test), Q value = 0.054
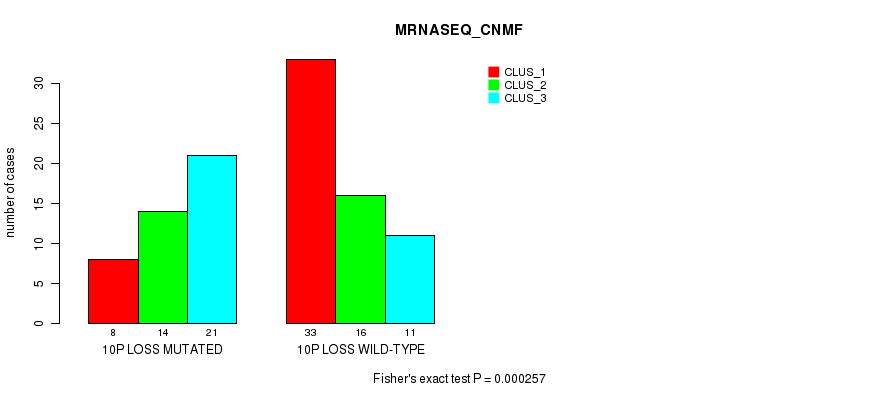
Table S3. Gene #43: '2p loss' versus Molecular Subtype #3: 'MRNASEQ_CNMF'
| nPatients | CLUS_1 | CLUS_2 | CLUS_3 |
|---|---|---|---|
| ALL | 41 | 30 | 32 |
| 2P LOSS MUTATED | 8 | 7 | 21 |
| 2P LOSS WILD-TYPE | 33 | 23 | 11 |
Figure S3. Get High-res Image Gene #43: '2p loss' versus Molecular Subtype #3: 'MRNASEQ_CNMF'

P value = 0.000119 (Fisher's exact test), Q value = 0.075
Table S4. Gene #43: '2p loss' versus Molecular Subtype #8: 'MIRSEQ_MATURE_CHIERARCHICAL'
| nPatients | CLUS_1 | CLUS_2 | CLUS_3 |
|---|---|---|---|
| ALL | 1 | 46 | 50 |
| 2P LOSS MUTATED | 1 | 6 | 24 |
| 2P LOSS WILD-TYPE | 0 | 40 | 26 |
Figure S4. Get High-res Image Gene #43: '2p loss' versus Molecular Subtype #8: 'MIRSEQ_MATURE_CHIERARCHICAL'

P value = 0.000171 (Fisher's exact test), Q value = 0.11
Table S5. Gene #59: '10p loss' versus Molecular Subtype #2: 'METHLYATION_CNMF'
| nPatients | CLUS_1 | CLUS_2 | CLUS_3 |
|---|---|---|---|
| ALL | 34 | 43 | 50 |
| 10P LOSS MUTATED | 5 | 23 | 28 |
| 10P LOSS WILD-TYPE | 29 | 20 | 22 |
Figure S5. Get High-res Image Gene #59: '10p loss' versus Molecular Subtype #2: 'METHLYATION_CNMF'

P value = 0.000257 (Fisher's exact test), Q value = 0.16
Table S6. Gene #59: '10p loss' versus Molecular Subtype #3: 'MRNASEQ_CNMF'
| nPatients | CLUS_1 | CLUS_2 | CLUS_3 |
|---|---|---|---|
| ALL | 41 | 30 | 32 |
| 10P LOSS MUTATED | 8 | 14 | 21 |
| 10P LOSS WILD-TYPE | 33 | 16 | 11 |
Figure S6. Get High-res Image Gene #59: '10p loss' versus Molecular Subtype #3: 'MRNASEQ_CNMF'
P value = 6.97e-08 (Fisher's exact test), Q value = 4.5e-05
Table S7. Gene #60: '10q loss' versus Molecular Subtype #1: 'CN_CNMF'
| nPatients | CLUS_1 | CLUS_2 | CLUS_3 |
|---|---|---|---|
| ALL | 33 | 55 | 39 |
| 10Q LOSS MUTATED | 5 | 42 | 19 |
| 10Q LOSS WILD-TYPE | 28 | 13 | 20 |
Figure S7. Get High-res Image Gene #60: '10q loss' versus Molecular Subtype #1: 'CN_CNMF'

P value = 4.82e-07 (Fisher's exact test), Q value = 0.00031
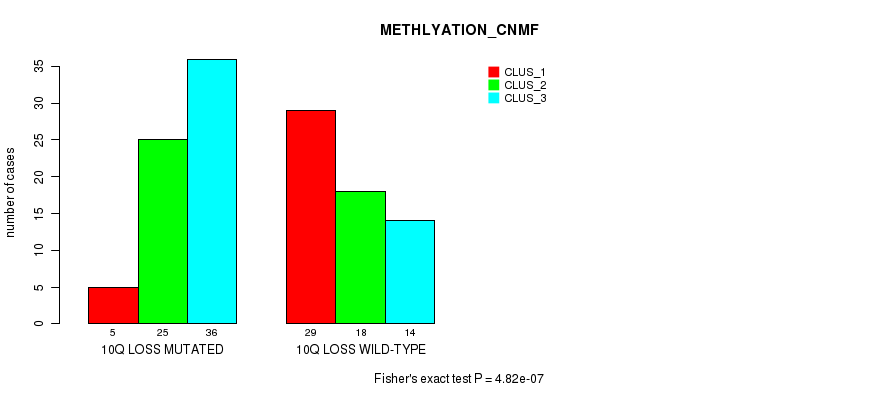
Table S8. Gene #60: '10q loss' versus Molecular Subtype #2: 'METHLYATION_CNMF'
| nPatients | CLUS_1 | CLUS_2 | CLUS_3 |
|---|---|---|---|
| ALL | 34 | 43 | 50 |
| 10Q LOSS MUTATED | 5 | 25 | 36 |
| 10Q LOSS WILD-TYPE | 29 | 18 | 14 |
Figure S8. Get High-res Image Gene #60: '10q loss' versus Molecular Subtype #2: 'METHLYATION_CNMF'
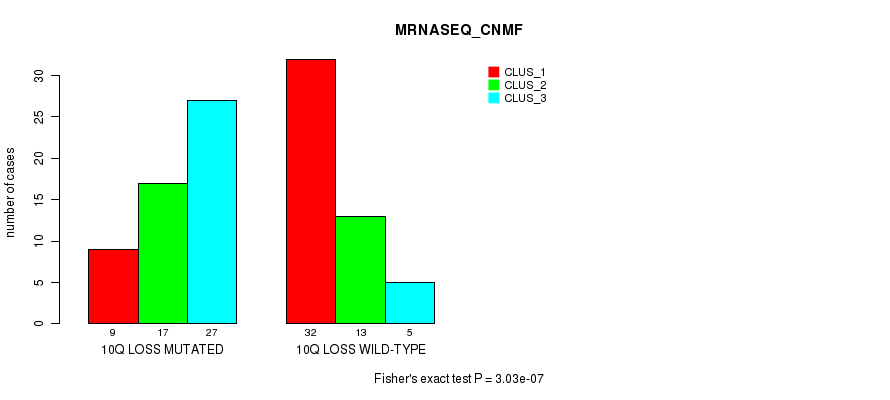
P value = 3.03e-07 (Fisher's exact test), Q value = 0.00019
Table S9. Gene #60: '10q loss' versus Molecular Subtype #3: 'MRNASEQ_CNMF'
| nPatients | CLUS_1 | CLUS_2 | CLUS_3 |
|---|---|---|---|
| ALL | 41 | 30 | 32 |
| 10Q LOSS MUTATED | 9 | 17 | 27 |
| 10Q LOSS WILD-TYPE | 32 | 13 | 5 |
Figure S9. Get High-res Image Gene #60: '10q loss' versus Molecular Subtype #3: 'MRNASEQ_CNMF'
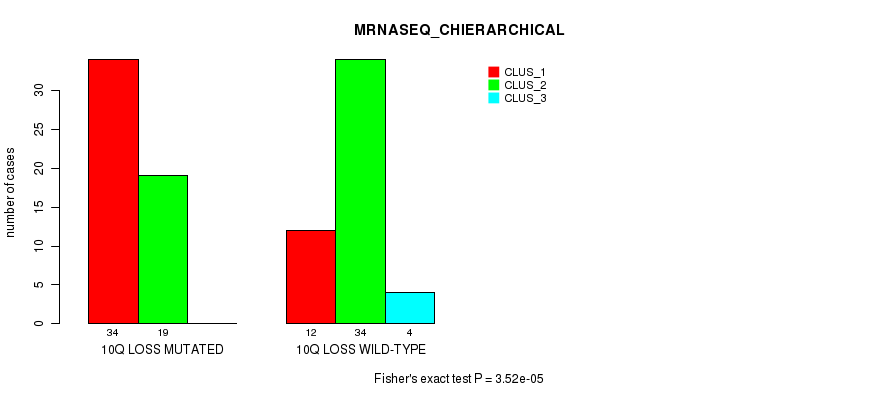
P value = 3.52e-05 (Fisher's exact test), Q value = 0.022
Table S10. Gene #60: '10q loss' versus Molecular Subtype #4: 'MRNASEQ_CHIERARCHICAL'
| nPatients | CLUS_1 | CLUS_2 | CLUS_3 |
|---|---|---|---|
| ALL | 46 | 53 | 4 |
| 10Q LOSS MUTATED | 34 | 19 | 0 |
| 10Q LOSS WILD-TYPE | 12 | 34 | 4 |
Figure S10. Get High-res Image Gene #60: '10q loss' versus Molecular Subtype #4: 'MRNASEQ_CHIERARCHICAL'
P value = 1.87e-05 (Fisher's exact test), Q value = 0.012
Table S11. Gene #69: '16q loss' versus Molecular Subtype #1: 'CN_CNMF'
| nPatients | CLUS_1 | CLUS_2 | CLUS_3 |
|---|---|---|---|
| ALL | 33 | 55 | 39 |
| 16Q LOSS MUTATED | 8 | 40 | 16 |
| 16Q LOSS WILD-TYPE | 25 | 15 | 23 |
Figure S11. Get High-res Image Gene #69: '16q loss' versus Molecular Subtype #1: 'CN_CNMF'

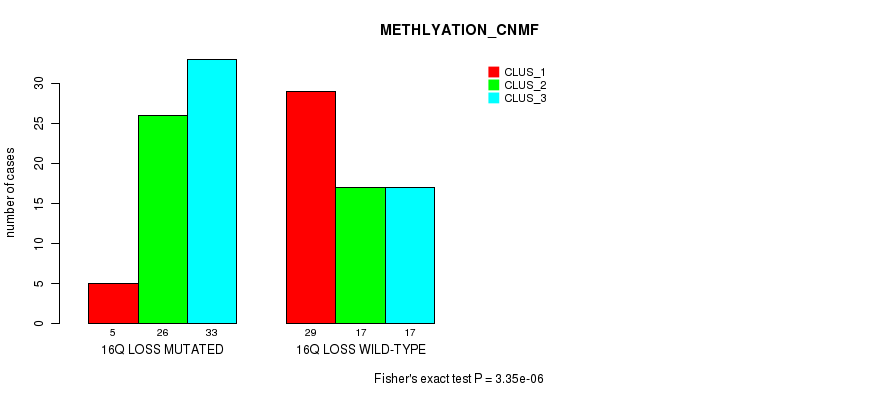
P value = 3.35e-06 (Fisher's exact test), Q value = 0.0021
Table S12. Gene #69: '16q loss' versus Molecular Subtype #2: 'METHLYATION_CNMF'
| nPatients | CLUS_1 | CLUS_2 | CLUS_3 |
|---|---|---|---|
| ALL | 34 | 43 | 50 |
| 16Q LOSS MUTATED | 5 | 26 | 33 |
| 16Q LOSS WILD-TYPE | 29 | 17 | 17 |
Figure S12. Get High-res Image Gene #69: '16q loss' versus Molecular Subtype #2: 'METHLYATION_CNMF'
P value = 0.000212 (Fisher's exact test), Q value = 0.13
Table S13. Gene #69: '16q loss' versus Molecular Subtype #5: 'MIRSEQ_CNMF'
| nPatients | CLUS_1 | CLUS_2 | CLUS_3 | CLUS_4 |
|---|---|---|---|---|
| ALL | 10 | 40 | 14 | 33 |
| 16Q LOSS MUTATED | 6 | 13 | 4 | 26 |
| 16Q LOSS WILD-TYPE | 4 | 27 | 10 | 7 |
Figure S13. Get High-res Image Gene #69: '16q loss' versus Molecular Subtype #5: 'MIRSEQ_CNMF'

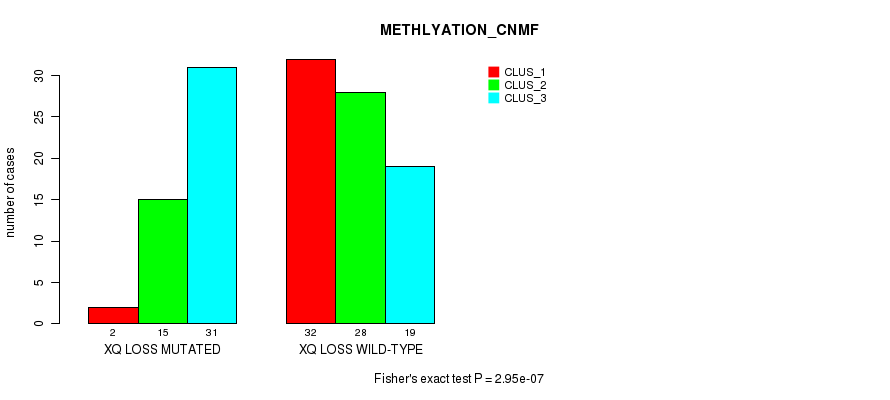
P value = 2.95e-07 (Fisher's exact test), Q value = 0.00019
Table S14. Gene #80: 'xq loss' versus Molecular Subtype #2: 'METHLYATION_CNMF'
| nPatients | CLUS_1 | CLUS_2 | CLUS_3 |
|---|---|---|---|
| ALL | 34 | 43 | 50 |
| XQ LOSS MUTATED | 2 | 15 | 31 |
| XQ LOSS WILD-TYPE | 32 | 28 | 19 |
Figure S14. Get High-res Image Gene #80: 'xq loss' versus Molecular Subtype #2: 'METHLYATION_CNMF'
-
Copy number data file = transformed.cor.cli.txt
-
Molecular subtypes file = SARC-TP.transferedmergedcluster.txt
-
Number of patients = 127
-
Number of significantly arm-level cnvs = 80
-
Number of molecular subtypes = 8
-
Exclude genes that fewer than K tumors have mutations, K = 3
For binary or multi-class clinical features (nominal or ordinal), two-tailed Fisher's exact tests (Fisher 1922) were used to estimate the P values using the 'fisher.test' function in R
For multiple hypothesis correction, Q value is the False Discovery Rate (FDR) analogue of the P value (Benjamini and Hochberg 1995), defined as the minimum FDR at which the test may be called significant. We used the 'Benjamini and Hochberg' method of 'p.adjust' function in R to convert P values into Q values.
In addition to the links below, the full results of the analysis summarized in this report can also be downloaded programmatically using firehose_get, or interactively from either the Broad GDAC website or TCGA Data Coordination Center Portal.