This pipeline uses various statistical tests to identify genes whose promoter methylation levels correlated to selected clinical features.
Testing the association between 20424 genes and 5 clinical features across 364 samples, statistically thresholded by Q value < 0.05, 4 clinical features related to at least one genes.
-
220 genes correlated to 'AGE'.
-
ANGPT4 , ALS2CL , GPR158 , HDAC11 , PLA2G15 , ...
-
2974 genes correlated to 'HISTOLOGICAL.TYPE'.
-
APBB1IP , SSTR1 , CARD11 , PPIH , CRYAB__1 , ...
-
15 genes correlated to 'RADIATIONS.RADIATION.REGIMENINDICATION'.
-
MAP2K2 , FIZ1 , ZNF524 , C17ORF28 , C14ORF93 , ...
-
22 genes correlated to 'COMPLETENESS.OF.RESECTION'.
-
TNFRSF19 , ALOX12 , MYRIP , POLR1A__1 , LACTB2 , ...
-
No genes correlated to 'Time to Death'
Complete statistical result table is provided in Supplement Table 1
Table 1. Get Full Table This table shows the clinical features, statistical methods used, and the number of genes that are significantly associated with each clinical feature at Q value < 0.05.
| Clinical feature | Statistical test | Significant genes | Associated with | Associated with | ||
|---|---|---|---|---|---|---|
| Time to Death | Cox regression test | N=0 | ||||
| AGE | Spearman correlation test | N=220 | older | N=65 | younger | N=155 |
| HISTOLOGICAL TYPE | ANOVA test | N=2974 | ||||
| RADIATIONS RADIATION REGIMENINDICATION | t test | N=15 | yes | N=14 | no | N=1 |
| COMPLETENESS OF RESECTION | ANOVA test | N=22 |
Table S1. Basic characteristics of clinical feature: 'Time to Death'
| Time to Death | Duration (Months) | 0-191.8 (median=16.9) |
| censored | N = 319 | |
| death | N = 42 | |
| Significant markers | N = 0 |
Table S2. Basic characteristics of clinical feature: 'AGE'
| AGE | Mean (SD) | 63.96 (11) |
| Significant markers | N = 220 | |
| pos. correlated | 65 | |
| neg. correlated | 155 |
Table S3. Get Full Table List of top 10 genes significantly correlated to 'AGE' by Spearman correlation test
| SpearmanCorr | corrP | Q | |
|---|---|---|---|
| ANGPT4 | 0.3519 | 5.069e-12 | 1.04e-07 |
| ALS2CL | -0.3437 | 1.665e-11 | 3.4e-07 |
| GPR158 | -0.336 | 4.987e-11 | 1.02e-06 |
| HDAC11 | -0.3305 | 1.07e-10 | 2.18e-06 |
| PLA2G15 | -0.3284 | 1.41e-10 | 2.88e-06 |
| ADAMTS15 | -0.3269 | 1.727e-10 | 3.53e-06 |
| NOS2 | -0.3258 | 2.014e-10 | 4.11e-06 |
| ITPK1 | -0.3186 | 5.267e-10 | 1.08e-05 |
| NCRNA00203 | -0.3186 | 5.267e-10 | 1.08e-05 |
| PLUNC | 0.3184 | 5.397e-10 | 1.1e-05 |
Figure S1. Get High-res Image As an example, this figure shows the association of ANGPT4 to 'AGE'. P value = 5.07e-12 with Spearman correlation analysis. The straight line presents the best linear regression.
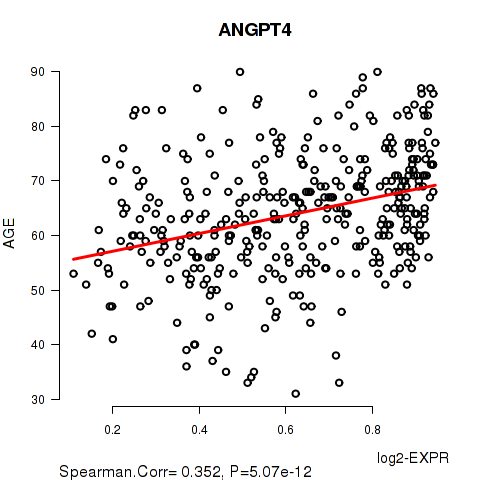
Table S4. Basic characteristics of clinical feature: 'HISTOLOGICAL.TYPE'
| HISTOLOGICAL.TYPE | Labels | N |
| ENDOMETRIOID ENDOMETRIAL ADENOCARCINOMA | 268 | |
| MIXED SEROUS AND ENDOMETRIOID | 18 | |
| SEROUS ENDOMETRIAL ADENOCARCINOMA | 78 | |
| Significant markers | N = 2974 |
Table S5. Get Full Table List of top 10 genes differentially expressed by 'HISTOLOGICAL.TYPE'
| ANOVA_P | Q | |
|---|---|---|
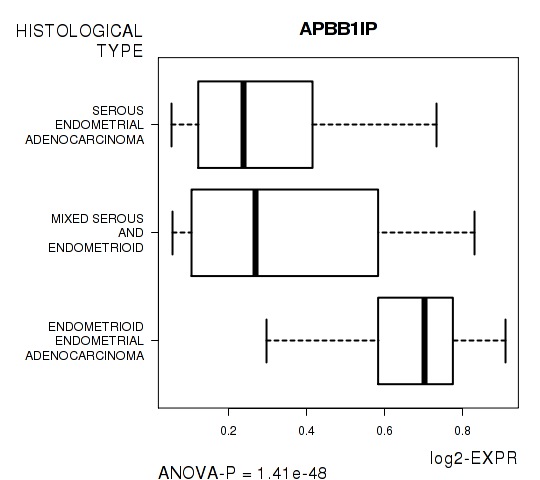
| APBB1IP | 1.409e-48 | 2.88e-44 |
| SSTR1 | 5.391e-44 | 1.1e-39 |
| CARD11 | 9.268e-44 | 1.89e-39 |
| PPIH | 2.985e-43 | 6.1e-39 |
| CRYAB__1 | 8.038e-41 | 1.64e-36 |
| HSPB2__1 | 8.038e-41 | 1.64e-36 |
| ADAMTS16 | 1.278e-40 | 2.61e-36 |
| CRYAB | 5.399e-40 | 1.1e-35 |
| HSPB2 | 5.399e-40 | 1.1e-35 |
| PRKCB | 1.023e-38 | 2.09e-34 |
Figure S2. Get High-res Image As an example, this figure shows the association of APBB1IP to 'HISTOLOGICAL.TYPE'. P value = 1.41e-48 with ANOVA analysis.
15 genes related to 'RADIATIONS.RADIATION.REGIMENINDICATION'.
Table S6. Basic characteristics of clinical feature: 'RADIATIONS.RADIATION.REGIMENINDICATION'
| RADIATIONS.RADIATION.REGIMENINDICATION | Labels | N |
| NO | 84 | |
| YES | 280 | |
| Significant markers | N = 15 | |
| Higher in YES | 14 | |
| Higher in NO | 1 |
Table S7. Get Full Table List of top 10 genes differentially expressed by 'RADIATIONS.RADIATION.REGIMENINDICATION'
| T(pos if higher in 'YES') | ttestP | Q | AUC | |
|---|---|---|---|---|
| MAP2K2 | 5.89 | 2.539e-08 | 0.000519 | 0.7009 |
| FIZ1 | 5.79 | 4.595e-08 | 0.000938 | 0.6995 |
| ZNF524 | 5.79 | 4.595e-08 | 0.000938 | 0.6995 |
| C17ORF28 | 5.42 | 2.145e-07 | 0.00438 | 0.6852 |
| C14ORF93 | 5.31 | 3.7e-07 | 0.00755 | 0.6955 |
| GIPR | 5.31 | 4.819e-07 | 0.00984 | 0.6875 |
| PEF1 | 5.13 | 6.365e-07 | 0.013 | 0.6584 |
| RGPD4 | 5.23 | 7.252e-07 | 0.0148 | 0.6743 |
| MST1 | 4.99 | 1.305e-06 | 0.0267 | 0.6496 |
| RNF123__1 | 4.99 | 1.305e-06 | 0.0267 | 0.6496 |
Figure S3. Get High-res Image As an example, this figure shows the association of MAP2K2 to 'RADIATIONS.RADIATION.REGIMENINDICATION'. P value = 2.54e-08 with T-test analysis.

Table S8. Basic characteristics of clinical feature: 'COMPLETENESS.OF.RESECTION'
| COMPLETENESS.OF.RESECTION | Labels | N |
| R0 | 241 | |
| R1 | 18 | |
| R2 | 12 | |
| RX | 26 | |
| Significant markers | N = 22 |
Table S9. Get Full Table List of top 10 genes differentially expressed by 'COMPLETENESS.OF.RESECTION'
| ANOVA_P | Q | |
|---|---|---|
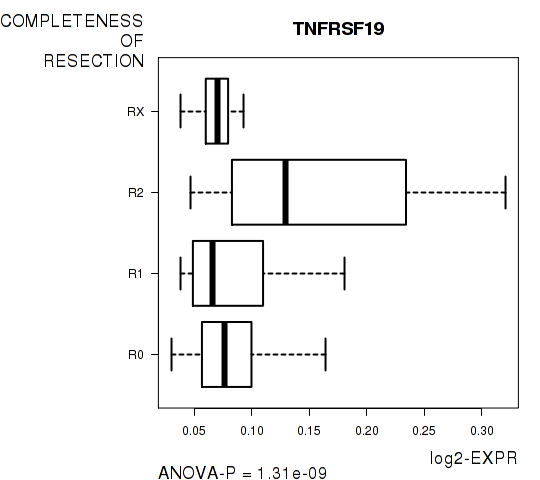
| TNFRSF19 | 1.313e-09 | 2.68e-05 |
| ALOX12 | 5.848e-09 | 0.000119 |
| MYRIP | 1.839e-08 | 0.000376 |
| POLR1A__1 | 6.581e-07 | 0.0134 |
| LACTB2 | 1.253e-06 | 0.0256 |
| XKR9 | 1.253e-06 | 0.0256 |
| CRYBA2 | 1.283e-06 | 0.0262 |
| TANC1 | 1.534e-06 | 0.0313 |
| EWSR1 | 1.56e-06 | 0.0318 |
| RHBDD3 | 1.56e-06 | 0.0318 |
Figure S4. Get High-res Image As an example, this figure shows the association of TNFRSF19 to 'COMPLETENESS.OF.RESECTION'. P value = 1.31e-09 with ANOVA analysis.
-
Expresson data file = UCEC-TP.meth.by_min_clin_corr.data.txt
-
Clinical data file = UCEC-TP.merged_data.txt
-
Number of patients = 364
-
Number of genes = 20424
-
Number of clinical features = 5
For survival clinical features, Wald's test in univariate Cox regression analysis with proportional hazards model (Andersen and Gill 1982) was used to estimate the P values using the 'coxph' function in R. Kaplan-Meier survival curves were plot using the four quartile subgroups of patients based on expression levels
For continuous numerical clinical features, Spearman's rank correlation coefficients (Spearman 1904) and two-tailed P values were estimated using 'cor.test' function in R
For multi-class clinical features (ordinal or nominal), one-way analysis of variance (Howell 2002) was applied to compare the log2-expression levels between different clinical classes using 'anova' function in R
For two-class clinical features, two-tailed Student's t test with unequal variance (Lehmann and Romano 2005) was applied to compare the log2-expression levels between the two clinical classes using 't.test' function in R
For multiple hypothesis correction, Q value is the False Discovery Rate (FDR) analogue of the P value (Benjamini and Hochberg 1995), defined as the minimum FDR at which the test may be called significant. We used the 'Benjamini and Hochberg' method of 'p.adjust' function in R to convert P values into Q values.
In addition to the links below, the full results of the analysis summarized in this report can also be downloaded programmatically using firehose_get, or interactively from either the Broad GDAC website or TCGA Data Coordination Center Portal.