This pipeline uses various statistical tests to identify mRNAs whose expression levels correlated to selected clinical features.
Testing the association between 18555 genes and 5 clinical features across 471 samples, statistically thresholded by Q value < 0.05, 5 clinical features related to at least one genes.
-
6 genes correlated to 'Time to Death'.
-
SRD5A1|6715 , CD3EAP|10849 , JMJD7-PLA2G4B|8681 , MGAT4A|11320 , SCGB2A1|4246 , ...
-
375 genes correlated to 'AGE'.
-
DIO2|1734 , FAM107A|11170 , MGAT4A|11320 , PTCH1|5727 , S100A1|6271 , ...
-
3882 genes correlated to 'HISTOLOGICAL.TYPE'.
-
L1CAM|3897 , KIAA1324|57535 , CLDN6|9074 , FOXA2|3170 , HIF3A|64344 , ...
-
91 genes correlated to 'RADIATIONS.RADIATION.REGIMENINDICATION'.
-
RPL23AP82|284942 , ANXA2P3|305 , ANXA2P1|303 , UBE2MP1|606551 , PGAM4|441531 , ...
-
9 genes correlated to 'COMPLETENESS.OF.RESECTION'.
-
FRMD1|79981 , ST3GAL4|6484 , TMEM171|134285 , SLC7A10|56301 , MAML3|55534 , ...
Complete statistical result table is provided in Supplement Table 1
Table 1. Get Full Table This table shows the clinical features, statistical methods used, and the number of genes that are significantly associated with each clinical feature at Q value < 0.05.
| Clinical feature | Statistical test | Significant genes | Associated with | Associated with | ||
|---|---|---|---|---|---|---|
| Time to Death | Cox regression test | N=6 | shorter survival | N=3 | longer survival | N=3 |
| AGE | Spearman correlation test | N=375 | older | N=223 | younger | N=152 |
| HISTOLOGICAL TYPE | ANOVA test | N=3882 | ||||
| RADIATIONS RADIATION REGIMENINDICATION | t test | N=91 | yes | N=9 | no | N=82 |
| COMPLETENESS OF RESECTION | ANOVA test | N=9 |
Table S1. Basic characteristics of clinical feature: 'Time to Death'
| Time to Death | Duration (Months) | 0-191.8 (median=21) |
| censored | N = 411 | |
| death | N = 57 | |
| Significant markers | N = 6 | |
| associated with shorter survival | 3 | |
| associated with longer survival | 3 |
Table S2. Get Full Table List of 6 genes significantly associated with 'Time to Death' by Cox regression test
| HazardRatio | Wald_P | Q | C_index | |
|---|---|---|---|---|
| SRD5A1|6715 | 2.7 | 3.725e-08 | 0.00069 | 0.668 |
| CD3EAP|10849 | 2.7 | 5.85e-08 | 0.0011 | 0.669 |
| JMJD7-PLA2G4B|8681 | 0.46 | 7.167e-07 | 0.013 | 0.312 |
| MGAT4A|11320 | 1.67 | 1.741e-06 | 0.032 | 0.68 |
| SCGB2A1|4246 | 0.85 | 2.271e-06 | 0.042 | 0.308 |
| KIAA1324|57535 | 0.86 | 2.689e-06 | 0.05 | 0.334 |
Figure S1. Get High-res Image As an example, this figure shows the association of SRD5A1|6715 to 'Time to Death'. four curves present the cumulative survival rates of 4 quartile subsets of patients. P value = 3.72e-08 with univariate Cox regression analysis using continuous log-2 expression values.
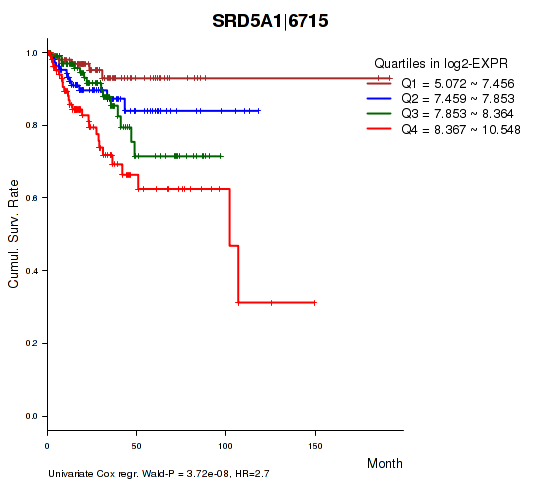
Table S3. Basic characteristics of clinical feature: 'AGE'
| AGE | Mean (SD) | 63.71 (11) |
| Significant markers | N = 375 | |
| pos. correlated | 223 | |
| neg. correlated | 152 |
Table S4. Get Full Table List of top 10 genes significantly correlated to 'AGE' by Spearman correlation test
| SpearmanCorr | corrP | Q | |
|---|---|---|---|
| DIO2|1734 | -0.3792 | 1.614e-17 | 3e-13 |
| FAM107A|11170 | 0.3543 | 2.413e-15 | 4.48e-11 |
| MGAT4A|11320 | 0.328 | 2.98e-13 | 5.53e-09 |
| PTCH1|5727 | -0.3276 | 3.193e-13 | 5.92e-09 |
| S100A1|6271 | 0.3205 | 1.086e-12 | 2.02e-08 |
| NR2F6|2063 | 0.3191 | 1.373e-12 | 2.55e-08 |
| HIF3A|64344 | 0.3205 | 1.6e-12 | 2.97e-08 |
| DLC1|10395 | -0.3156 | 2.507e-12 | 4.65e-08 |
| PTGS1|5742 | 0.315 | 2.744e-12 | 5.09e-08 |
| DUSP9|1852 | 0.3246 | 4.677e-12 | 8.67e-08 |
Figure S2. Get High-res Image As an example, this figure shows the association of DIO2|1734 to 'AGE'. P value = 1.61e-17 with Spearman correlation analysis. The straight line presents the best linear regression.
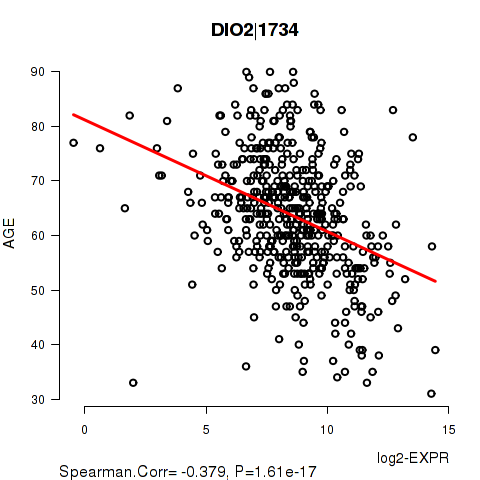
Table S5. Basic characteristics of clinical feature: 'HISTOLOGICAL.TYPE'
| HISTOLOGICAL.TYPE | Labels | N |
| ENDOMETRIOID ENDOMETRIAL ADENOCARCINOMA | 360 | |
| MIXED SEROUS AND ENDOMETRIOID | 17 | |
| SEROUS ENDOMETRIAL ADENOCARCINOMA | 94 | |
| Significant markers | N = 3882 |
Table S6. Get Full Table List of top 10 genes differentially expressed by 'HISTOLOGICAL.TYPE'
| ANOVA_P | Q | |
|---|---|---|
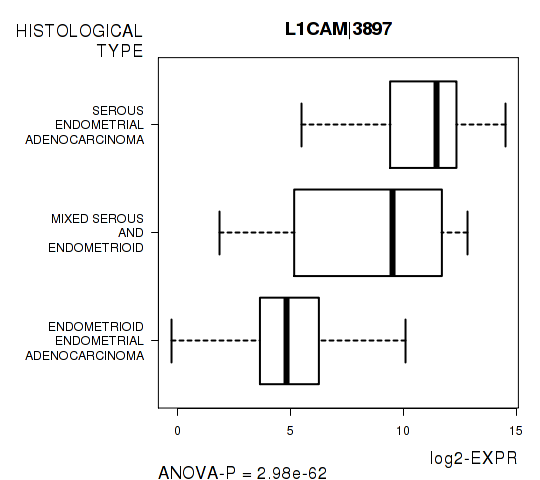
| L1CAM|3897 | 2.98e-62 | 5.53e-58 |
| KIAA1324|57535 | 1.15e-55 | 2.13e-51 |
| CLDN6|9074 | 7.919e-50 | 1.47e-45 |
| FOXA2|3170 | 8.832e-48 | 1.64e-43 |
| HIF3A|64344 | 4.26e-47 | 7.9e-43 |
| SLC6A12|6539 | 1.234e-43 | 2.29e-39 |
| TFF3|7033 | 7.254e-42 | 1.35e-37 |
| CDKN1A|1026 | 1.067e-41 | 1.98e-37 |
| SPDEF|25803 | 3.031e-41 | 5.62e-37 |
| IL20RA|53832 | 1.871e-39 | 3.47e-35 |
Figure S3. Get High-res Image As an example, this figure shows the association of L1CAM|3897 to 'HISTOLOGICAL.TYPE'. P value = 2.98e-62 with ANOVA analysis.
91 genes related to 'RADIATIONS.RADIATION.REGIMENINDICATION'.
Table S7. Basic characteristics of clinical feature: 'RADIATIONS.RADIATION.REGIMENINDICATION'
| RADIATIONS.RADIATION.REGIMENINDICATION | Labels | N |
| NO | 134 | |
| YES | 337 | |
| Significant markers | N = 91 | |
| Higher in YES | 9 | |
| Higher in NO | 82 |
Table S8. Get Full Table List of top 10 genes differentially expressed by 'RADIATIONS.RADIATION.REGIMENINDICATION'
| T(pos if higher in 'YES') | ttestP | Q | AUC | |
|---|---|---|---|---|
| RPL23AP82|284942 | -7.18 | 3.855e-12 | 7.15e-08 | 0.6904 |
| ANXA2P3|305 | -7.12 | 4.904e-12 | 9.1e-08 | 0.6474 |
| ANXA2P1|303 | -6.95 | 1.696e-11 | 3.15e-07 | 0.6546 |
| UBE2MP1|606551 | -6.89 | 2.346e-11 | 4.35e-07 | 0.6532 |
| PGAM4|441531 | -6.86 | 2.512e-11 | 4.66e-07 | 0.654 |
| LOC407835|407835 | -6.85 | 2.863e-11 | 5.31e-07 | 0.6475 |
| POTEE|445582 | -6.53 | 1.909e-10 | 3.54e-06 | 0.6533 |
| UBE2NL|389898 | -6.49 | 2.597e-10 | 4.82e-06 | 0.6496 |
| TPI1P3|728402 | -6.39 | 4.536e-10 | 8.41e-06 | 0.6523 |
| EDARADD|128178 | -6.23 | 1.237e-09 | 2.29e-05 | 0.6529 |
Figure S4. Get High-res Image As an example, this figure shows the association of RPL23AP82|284942 to 'RADIATIONS.RADIATION.REGIMENINDICATION'. P value = 3.85e-12 with T-test analysis.
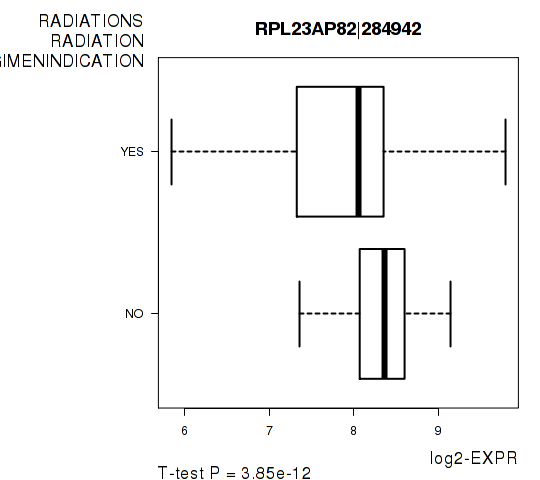
Table S9. Basic characteristics of clinical feature: 'COMPLETENESS.OF.RESECTION'
| COMPLETENESS.OF.RESECTION | Labels | N |
| R0 | 325 | |
| R1 | 23 | |
| R2 | 16 | |
| RX | 27 | |
| Significant markers | N = 9 |
Table S10. Get Full Table List of 9 genes differentially expressed by 'COMPLETENESS.OF.RESECTION'
| ANOVA_P | Q | |
|---|---|---|
| FRMD1|79981 | 2.198e-07 | 0.00408 |
| ST3GAL4|6484 | 3.1e-07 | 0.00575 |
| TMEM171|134285 | 4.768e-07 | 0.00885 |
| SLC7A10|56301 | 4.963e-07 | 0.00921 |
| MAML3|55534 | 5.63e-07 | 0.0104 |
| NYX|60506 | 8.146e-07 | 0.0151 |
| SVOP|55530 | 1.29e-06 | 0.0239 |
| CIRBP|1153 | 1.58e-06 | 0.0293 |
| SLC39A5|283375 | 2.332e-06 | 0.0432 |
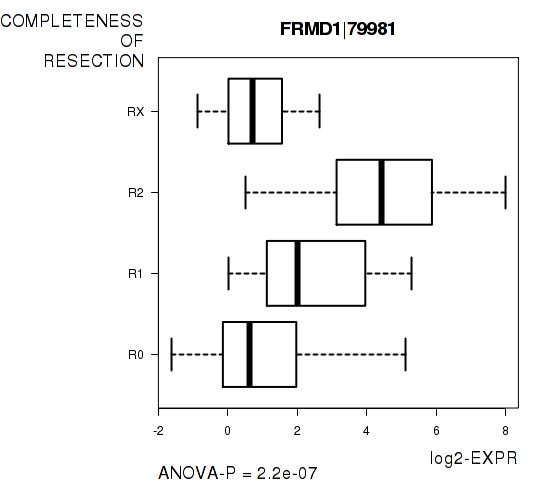
Figure S5. Get High-res Image As an example, this figure shows the association of FRMD1|79981 to 'COMPLETENESS.OF.RESECTION'. P value = 2.2e-07 with ANOVA analysis.
-
Expresson data file = UCEC-TP.uncv2.mRNAseq_RSEM_normalized_log2.txt
-
Clinical data file = UCEC-TP.merged_data.txt
-
Number of patients = 471
-
Number of genes = 18555
-
Number of clinical features = 5
For survival clinical features, Wald's test in univariate Cox regression analysis with proportional hazards model (Andersen and Gill 1982) was used to estimate the P values using the 'coxph' function in R. Kaplan-Meier survival curves were plot using the four quartile subgroups of patients based on expression levels
For continuous numerical clinical features, Spearman's rank correlation coefficients (Spearman 1904) and two-tailed P values were estimated using 'cor.test' function in R
For multi-class clinical features (ordinal or nominal), one-way analysis of variance (Howell 2002) was applied to compare the log2-expression levels between different clinical classes using 'anova' function in R
For two-class clinical features, two-tailed Student's t test with unequal variance (Lehmann and Romano 2005) was applied to compare the log2-expression levels between the two clinical classes using 't.test' function in R
For multiple hypothesis correction, Q value is the False Discovery Rate (FDR) analogue of the P value (Benjamini and Hochberg 1995), defined as the minimum FDR at which the test may be called significant. We used the 'Benjamini and Hochberg' method of 'p.adjust' function in R to convert P values into Q values.
In addition to the links below, the full results of the analysis summarized in this report can also be downloaded programmatically using firehose_get, or interactively from either the Broad GDAC website or TCGA Data Coordination Center Portal.