This pipeline computes the correlation between significant copy number variation (cnv focal) genes and selected clinical features.
Testing the association between copy number variation 61 focal events and 2 clinical features across 32 patients, one significant finding detected with Q value < 0.25.
-
amp_xp11.21 cnv correlated to 'AGE'.
Table 1. Get Full Table Overview of the association between significant copy number variation of 61 focal events and 2 clinical features. Shown in the table are P values (Q values). Thresholded by Q value < 0.25, one significant finding detected.
|
Clinical Features |
Time to Death |
AGE | ||
| nCNV (%) | nWild-Type | logrank test | t-test | |
| amp xp11 21 | 15 (47%) | 17 |
0.529 (1.00) |
0.00104 (0.126) |
| amp 1q22 | 22 (69%) | 10 |
0.724 (1.00) |
0.48 (1.00) |
| amp 2p14 | 15 (47%) | 17 |
0.0521 (1.00) |
0.928 (1.00) |
| amp 2q13 | 15 (47%) | 17 |
0.465 (1.00) |
0.96 (1.00) |
| amp 3p25 1 | 12 (38%) | 20 |
0.288 (1.00) |
0.625 (1.00) |
| amp 3q26 2 | 21 (66%) | 11 |
0.362 (1.00) |
0.377 (1.00) |
| amp 4p16 3 | 15 (47%) | 17 |
0.175 (1.00) |
0.347 (1.00) |
| amp 5p13 2 | 15 (47%) | 17 |
0.0518 (1.00) |
0.292 (1.00) |
| amp 6p24 2 | 20 (62%) | 12 |
0.246 (1.00) |
0.212 (1.00) |
| amp 8p11 21 | 18 (56%) | 14 |
0.269 (1.00) |
0.0826 (1.00) |
| amp 8q11 23 | 21 (66%) | 11 |
0.222 (1.00) |
0.0652 (1.00) |
| amp 8q24 21 | 23 (72%) | 9 |
0.755 (1.00) |
0.886 (1.00) |
| amp 8q24 21 | 21 (66%) | 11 |
0.989 (1.00) |
0.768 (1.00) |
| amp 10q22 2 | 15 (47%) | 17 |
0.435 (1.00) |
0.43 (1.00) |
| amp 11q13 1 | 10 (31%) | 22 |
0.0559 (1.00) |
0.944 (1.00) |
| amp 12q12 | 13 (41%) | 19 |
0.936 (1.00) |
0.448 (1.00) |
| amp 12q15 | 9 (28%) | 23 |
0.123 (1.00) |
0.24 (1.00) |
| amp 13q31 3 | 15 (47%) | 17 |
0.874 (1.00) |
0.416 (1.00) |
| amp 16p11 2 | 13 (41%) | 19 |
0.144 (1.00) |
0.02 (1.00) |
| amp 17q12 | 18 (56%) | 14 |
0.326 (1.00) |
0.518 (1.00) |
| amp 17q25 1 | 16 (50%) | 16 |
0.813 (1.00) |
0.153 (1.00) |
| amp 19p13 2 | 6 (19%) | 26 |
0.37 (1.00) |
0.634 (1.00) |
| amp 19q12 | 25 (78%) | 7 |
0.916 (1.00) |
0.832 (1.00) |
| amp 20q11 21 | 29 (91%) | 3 |
0.603 (1.00) |
0.071 (1.00) |
| del 1p36 21 | 9 (28%) | 23 |
0.486 (1.00) |
0.145 (1.00) |
| del 2q22 1 | 7 (22%) | 25 |
0.135 (1.00) |
0.86 (1.00) |
| del 3p21 1 | 20 (62%) | 12 |
0.335 (1.00) |
0.359 (1.00) |
| del 3p14 1 | 15 (47%) | 17 |
0.112 (1.00) |
0.976 (1.00) |
| del 3q13 31 | 14 (44%) | 18 |
0.564 (1.00) |
0.328 (1.00) |
| del 4q22 1 | 23 (72%) | 9 |
0.67 (1.00) |
0.519 (1.00) |
| del 4q34 3 | 24 (75%) | 8 |
0.148 (1.00) |
0.624 (1.00) |
| del 5q11 2 | 13 (41%) | 19 |
0.457 (1.00) |
0.218 (1.00) |
| del 6q26 | 8 (25%) | 24 |
0.2 (1.00) |
0.588 (1.00) |
| del 7q11 22 | 7 (22%) | 25 |
0.557 (1.00) |
0.198 (1.00) |
| del 7q36 2 | 12 (38%) | 20 |
0.0165 (1.00) |
0.12 (1.00) |
| del 8p21 3 | 18 (56%) | 14 |
0.774 (1.00) |
0.604 (1.00) |
| del 9p23 | 16 (50%) | 16 |
0.763 (1.00) |
0.0203 (1.00) |
| del 9q21 13 | 20 (62%) | 12 |
0.88 (1.00) |
0.733 (1.00) |
| del 9q33 3 | 19 (59%) | 13 |
0.405 (1.00) |
0.454 (1.00) |
| del 10q21 1 | 9 (28%) | 23 |
0.699 (1.00) |
0.88 (1.00) |
| del 10q23 31 | 10 (31%) | 22 |
0.354 (1.00) |
0.132 (1.00) |
| del 11p15 5 | 11 (34%) | 21 |
0.132 (1.00) |
0.824 (1.00) |
| del 11q14 1 | 17 (53%) | 15 |
0.718 (1.00) |
0.755 (1.00) |
| del 11q24 2 | 18 (56%) | 14 |
0.378 (1.00) |
0.733 (1.00) |
| del 12q23 1 | 12 (38%) | 20 |
0.249 (1.00) |
0.0554 (1.00) |
| del 12q24 31 | 13 (41%) | 19 |
0.194 (1.00) |
0.478 (1.00) |
| del 13q12 11 | 18 (56%) | 14 |
0.752 (1.00) |
0.35 (1.00) |
| del 13q14 2 | 17 (53%) | 15 |
0.945 (1.00) |
0.649 (1.00) |
| del 14q21 1 | 18 (56%) | 14 |
0.126 (1.00) |
0.474 (1.00) |
| del 15q15 1 | 25 (78%) | 7 |
0.819 (1.00) |
0.892 (1.00) |
| del 16p13 3 | 19 (59%) | 13 |
0.5 (1.00) |
0.897 (1.00) |
| del 16q23 1 | 23 (72%) | 9 |
0.199 (1.00) |
0.174 (1.00) |
| del 17p13 1 | 26 (81%) | 6 |
0.768 (1.00) |
0.0705 (1.00) |
| del 17q21 32 | 11 (34%) | 21 |
0.00245 (0.296) |
0.629 (1.00) |
| del 18q22 2 | 15 (47%) | 17 |
0.381 (1.00) |
0.959 (1.00) |
| del 19p13 3 | 29 (91%) | 3 |
0.64 (1.00) |
0.366 (1.00) |
| del 19q13 33 | 11 (34%) | 21 |
0.338 (1.00) |
0.506 (1.00) |
| del 20p12 1 | 5 (16%) | 27 |
0.793 (1.00) |
0.896 (1.00) |
| del 22q13 31 | 24 (75%) | 8 |
0.736 (1.00) |
0.229 (1.00) |
| del xp21 1 | 14 (44%) | 18 |
0.275 (1.00) |
0.424 (1.00) |
| del xq25 | 13 (41%) | 19 |
0.766 (1.00) |
0.483 (1.00) |
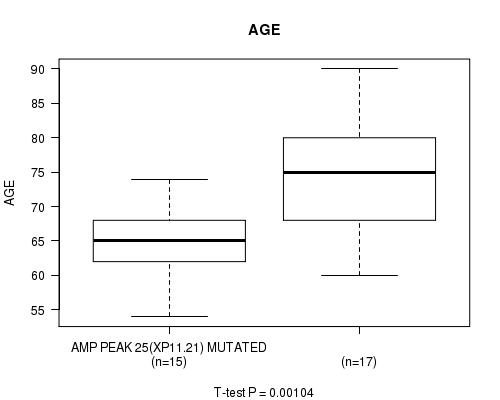
P value = 0.00104 (t-test), Q value = 0.13
Table S1. Gene #24: 'amp_xp11.21' versus Clinical Feature #2: 'AGE'
| nPatients | Mean (Std.Dev) | |
|---|---|---|
| ALL | 32 | 69.8 (8.5) |
| AMP PEAK 25(XP11.21) MUTATED | 15 | 64.9 (5.1) |
| AMP PEAK 25(XP11.21) WILD-TYPE | 17 | 74.1 (8.7) |
Figure S1. Get High-res Image Gene #24: 'amp_xp11.21' versus Clinical Feature #2: 'AGE'
-
Copy number data file = transformed.cor.cli.txt
-
Clinical data file = UCS-TP.merged_data.txt
-
Number of patients = 32
-
Number of significantly focal cnvs = 61
-
Number of selected clinical features = 2
-
Exclude genes that fewer than K tumors have mutations, K = 3
For survival clinical features, the Kaplan-Meier survival curves of tumors with and without gene mutations were plotted and the statistical significance P values were estimated by logrank test (Bland and Altman 2004) using the 'survdiff' function in R
For continuous numerical clinical features, two-tailed Student's t test with unequal variance (Lehmann and Romano 2005) was applied to compare the clinical values between tumors with and without gene mutations using 't.test' function in R
For multiple hypothesis correction, Q value is the False Discovery Rate (FDR) analogue of the P value (Benjamini and Hochberg 1995), defined as the minimum FDR at which the test may be called significant. We used the 'Benjamini and Hochberg' method of 'p.adjust' function in R to convert P values into Q values.
In addition to the links below, the full results of the analysis summarized in this report can also be downloaded programmatically using firehose_get, or interactively from either the Broad GDAC website or TCGA Data Coordination Center Portal.