This pipeline uses various statistical tests to identify genes whose promoter methylation levels correlated to selected clinical features.
Testing the association between 19519 genes and 6 clinical features across 34 samples, statistically thresholded by Q value < 0.05, 2 clinical features related to at least one genes.
-
81 genes correlated to 'PATHOLOGY.N.STAGE'.
-
SLC35D2 , SSH3 , SEMA3E , MMRN2__1 , SNCG__1 , ...
-
2 genes correlated to 'GENDER'.
-
MGC23284 , MVD
-
No genes correlated to 'Time to Death', 'AGE', 'NEOPLASM.DISEASESTAGE', and 'PATHOLOGY.T.STAGE'.
Complete statistical result table is provided in Supplement Table 1
Table 1. Get Full Table This table shows the clinical features, statistical methods used, and the number of genes that are significantly associated with each clinical feature at Q value < 0.05.
| Clinical feature | Statistical test | Significant genes | Associated with | Associated with | ||
|---|---|---|---|---|---|---|
| Time to Death | Cox regression test | N=0 | ||||
| AGE | Spearman correlation test | N=0 | ||||
| NEOPLASM DISEASESTAGE | ANOVA test | N=0 | ||||
| PATHOLOGY T STAGE | Spearman correlation test | N=0 | ||||
| PATHOLOGY N STAGE | t test | N=81 | class1 | N=76 | class0 | N=5 |
| GENDER | t test | N=2 | male | N=2 | female | N=0 |
Table S1. Basic characteristics of clinical feature: 'Time to Death'
| Time to Death | Duration (Months) | 6.9-121.2 (median=29.8) |
| censored | N = 26 | |
| death | N = 8 | |
| Significant markers | N = 0 |
Table S2. Basic characteristics of clinical feature: 'AGE'
| AGE | Mean (SD) | 50.82 (14) |
| Significant markers | N = 0 |
Table S3. Basic characteristics of clinical feature: 'NEOPLASM.DISEASESTAGE'
| NEOPLASM.DISEASESTAGE | Labels | N |
| STAGE I | 4 | |
| STAGE II | 13 | |
| STAGE III | 4 | |
| STAGE IV | 8 | |
| Significant markers | N = 0 |
Table S4. Basic characteristics of clinical feature: 'PATHOLOGY.T.STAGE'
| PATHOLOGY.T.STAGE | Mean (SD) | 2.55 (1.1) |
| N | ||
| 1 | 4 | |
| 2 | 14 | |
| 3 | 2 | |
| 4 | 9 | |
| Significant markers | N = 0 |
Table S5. Basic characteristics of clinical feature: 'PATHOLOGY.N.STAGE'
| PATHOLOGY.N.STAGE | Labels | N |
| class0 | 26 | |
| class1 | 4 | |
| Significant markers | N = 81 | |
| Higher in class1 | 76 | |
| Higher in class0 | 5 |
Table S6. Get Full Table List of top 10 genes differentially expressed by 'PATHOLOGY.N.STAGE'
| T(pos if higher in 'class1') | ttestP | Q | AUC | |
|---|---|---|---|---|
| SLC35D2 | 15.52 | 9.401e-15 | 1.83e-10 | 0.9808 |
| SSH3 | 11.86 | 2.022e-12 | 3.95e-08 | 0.9712 |
| SEMA3E | 9.98 | 9.999e-11 | 1.95e-06 | 0.9519 |
| MMRN2__1 | 9.41 | 4.65e-10 | 9.07e-06 | 0.9615 |
| SNCG__1 | 9.41 | 4.65e-10 | 9.07e-06 | 0.9615 |
| CHST14 | 9.35 | 5.529e-10 | 1.08e-05 | 0.9615 |
| CSN2 | 9.31 | 7.508e-10 | 1.47e-05 | 0.9519 |
| ARHGAP21 | 12.34 | 7.921e-10 | 1.55e-05 | 0.9712 |
| SH3PXD2A | 9.2 | 8.88e-10 | 1.73e-05 | 0.9423 |
| PPP1R9B | 10.7 | 9.601e-10 | 1.87e-05 | 0.9615 |
Figure S1. Get High-res Image As an example, this figure shows the association of SLC35D2 to 'PATHOLOGY.N.STAGE'. P value = 9.4e-15 with T-test analysis.
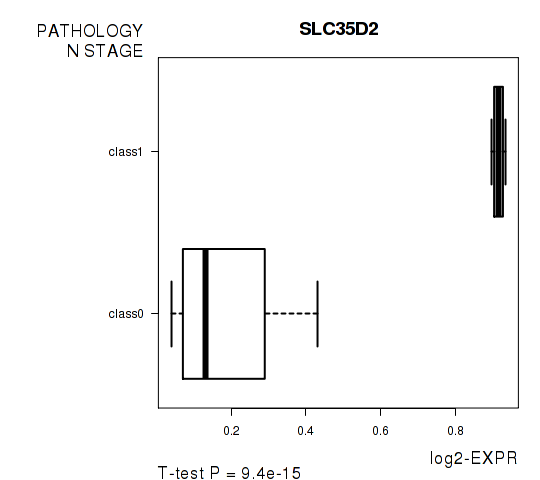
Table S7. Basic characteristics of clinical feature: 'GENDER'
| GENDER | Labels | N |
| FEMALE | 17 | |
| MALE | 17 | |
| Significant markers | N = 2 | |
| Higher in MALE | 2 | |
| Higher in FEMALE | 0 |
Table S8. Get Full Table List of 2 genes differentially expressed by 'GENDER'
| T(pos if higher in 'MALE') | ttestP | Q | AUC | |
|---|---|---|---|---|
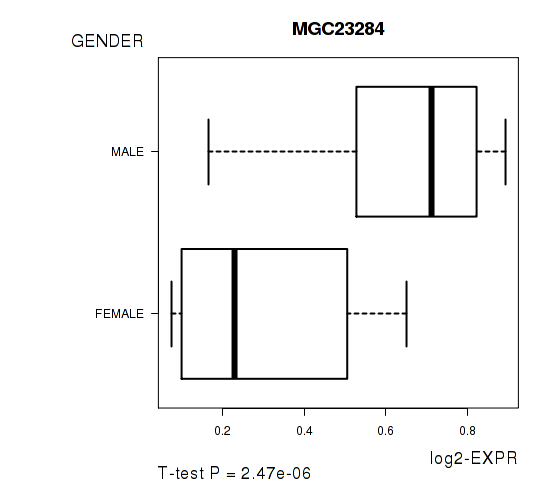
| MGC23284 | 5.72 | 2.47e-06 | 0.0482 | 0.8997 |
| MVD | 5.72 | 2.47e-06 | 0.0482 | 0.8997 |
Figure S2. Get High-res Image As an example, this figure shows the association of MGC23284 to 'GENDER'. P value = 2.47e-06 with T-test analysis.
-
Expresson data file = ACC-TP.meth.by_min_clin_corr.data.txt
-
Clinical data file = ACC-TP.merged_data.txt
-
Number of patients = 34
-
Number of genes = 19519
-
Number of clinical features = 6
For survival clinical features, Wald's test in univariate Cox regression analysis with proportional hazards model (Andersen and Gill 1982) was used to estimate the P values using the 'coxph' function in R. Kaplan-Meier survival curves were plot using the four quartile subgroups of patients based on expression levels
For continuous numerical clinical features, Spearman's rank correlation coefficients (Spearman 1904) and two-tailed P values were estimated using 'cor.test' function in R
For multi-class clinical features (ordinal or nominal), one-way analysis of variance (Howell 2002) was applied to compare the log2-expression levels between different clinical classes using 'anova' function in R
For two-class clinical features, two-tailed Student's t test with unequal variance (Lehmann and Romano 2005) was applied to compare the log2-expression levels between the two clinical classes using 't.test' function in R
For multiple hypothesis correction, Q value is the False Discovery Rate (FDR) analogue of the P value (Benjamini and Hochberg 1995), defined as the minimum FDR at which the test may be called significant. We used the 'Benjamini and Hochberg' method of 'p.adjust' function in R to convert P values into Q values.
In addition to the links below, the full results of the analysis summarized in this report can also be downloaded programmatically using firehose_get, or interactively from either the Broad GDAC website or TCGA Data Coordination Center Portal.