This pipeline uses various statistical tests to identify mRNAs whose expression levels correlated to selected clinical features.
Testing the association between 17733 genes and 6 clinical features across 34 samples, statistically thresholded by Q value < 0.05, 4 clinical features related to at least one genes.
-
1 gene correlated to 'NEOPLASM.DISEASESTAGE'.
-
CBFB|865
-
3 genes correlated to 'PATHOLOGY.T.STAGE'.
-
CBFB|865 , CHTF18|63922 , POLD1|5424
-
18 genes correlated to 'PATHOLOGY.N.STAGE'.
-
FKTN|2218 , FAM105B|90268 , GTPBP10|85865 , RNF31|55072 , C3ORF19|51244 , ...
-
12 genes correlated to 'GENDER'.
-
XIST|7503 , TSIX|9383 , RPS4Y1|6192 , PRKY|5616 , DDX3Y|8653 , ...
-
No genes correlated to 'Time to Death', and 'AGE'.
Complete statistical result table is provided in Supplement Table 1
Table 1. Get Full Table This table shows the clinical features, statistical methods used, and the number of genes that are significantly associated with each clinical feature at Q value < 0.05.
| Clinical feature | Statistical test | Significant genes | Associated with | Associated with | ||
|---|---|---|---|---|---|---|
| Time to Death | Cox regression test | N=0 | ||||
| AGE | Spearman correlation test | N=0 | ||||
| NEOPLASM DISEASESTAGE | ANOVA test | N=1 | ||||
| PATHOLOGY T STAGE | Spearman correlation test | N=3 | higher stage | N=3 | lower stage | N=0 |
| PATHOLOGY N STAGE | t test | N=18 | class1 | N=13 | class0 | N=5 |
| GENDER | t test | N=12 | male | N=10 | female | N=2 |
Table S1. Basic characteristics of clinical feature: 'Time to Death'
| Time to Death | Duration (Months) | 6.9-121.2 (median=29.8) |
| censored | N = 26 | |
| death | N = 8 | |
| Significant markers | N = 0 |
Table S2. Basic characteristics of clinical feature: 'AGE'
| AGE | Mean (SD) | 50.82 (14) |
| Significant markers | N = 0 |
Table S3. Basic characteristics of clinical feature: 'NEOPLASM.DISEASESTAGE'
| NEOPLASM.DISEASESTAGE | Labels | N |
| STAGE I | 4 | |
| STAGE II | 13 | |
| STAGE III | 4 | |
| STAGE IV | 8 | |
| Significant markers | N = 1 |
Table S4. Get Full Table List of one gene differentially expressed by 'NEOPLASM.DISEASESTAGE'
| ANOVA_P | Q | |
|---|---|---|
| CBFB|865 | 2.635e-06 | 0.0467 |
Figure S1. Get High-res Image As an example, this figure shows the association of CBFB|865 to 'NEOPLASM.DISEASESTAGE'. P value = 2.64e-06 with ANOVA analysis.
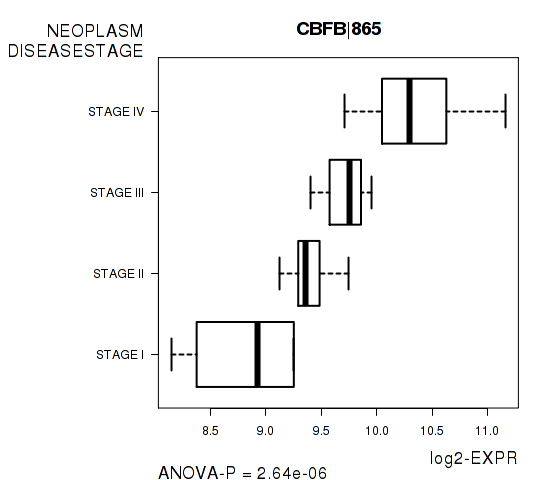
Table S5. Basic characteristics of clinical feature: 'PATHOLOGY.T.STAGE'
| PATHOLOGY.T.STAGE | Mean (SD) | 2.55 (1.1) |
| N | ||
| 1 | 4 | |
| 2 | 14 | |
| 3 | 2 | |
| 4 | 9 | |
| Significant markers | N = 3 | |
| pos. correlated | 3 | |
| neg. correlated | 0 |
Table S6. Get Full Table List of 3 genes significantly correlated to 'PATHOLOGY.T.STAGE' by Spearman correlation test
| SpearmanCorr | corrP | Q | |
|---|---|---|---|
| CBFB|865 | 0.8406 | 1.153e-08 | 0.000204 |
| CHTF18|63922 | 0.7677 | 1.174e-06 | 0.0208 |
| POLD1|5424 | 0.7543 | 2.285e-06 | 0.0405 |
Figure S2. Get High-res Image As an example, this figure shows the association of CBFB|865 to 'PATHOLOGY.T.STAGE'. P value = 1.15e-08 with Spearman correlation analysis.
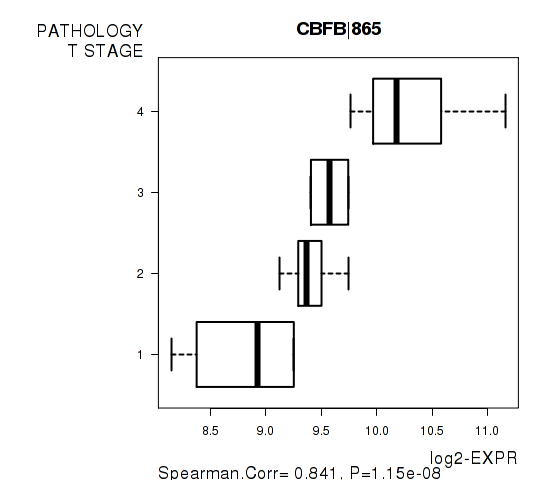
Table S7. Basic characteristics of clinical feature: 'PATHOLOGY.N.STAGE'
| PATHOLOGY.N.STAGE | Labels | N |
| class0 | 26 | |
| class1 | 4 | |
| Significant markers | N = 18 | |
| Higher in class1 | 13 | |
| Higher in class0 | 5 |
Table S8. Get Full Table List of top 10 genes differentially expressed by 'PATHOLOGY.N.STAGE'
| T(pos if higher in 'class1') | ttestP | Q | AUC | |
|---|---|---|---|---|
| FKTN|2218 | 7.88 | 1.39e-08 | 0.000233 | 0.9038 |
| FAM105B|90268 | 8.07 | 3.705e-08 | 0.000622 | 0.9904 |
| GTPBP10|85865 | 7.23 | 8.11e-08 | 0.00136 | 0.9423 |
| RNF31|55072 | 8.24 | 2.022e-07 | 0.00339 | 0.9904 |
| C3ORF19|51244 | -6.35 | 7.393e-07 | 0.0124 | 0.9423 |
| JKAMP|51528 | 7.17 | 7.728e-07 | 0.013 | 0.9519 |
| C6ORF108|10591 | -6.24 | 1.002e-06 | 0.0168 | 0.8654 |
| UTP15|84135 | 6.49 | 1.002e-06 | 0.0168 | 0.9231 |
| ABLIM2|84448 | 6.32 | 1.055e-06 | 0.0177 | 0.9712 |
| MAGED4B|81557 | 7.26 | 1.183e-06 | 0.0198 | 0.9583 |
Figure S3. Get High-res Image As an example, this figure shows the association of FKTN|2218 to 'PATHOLOGY.N.STAGE'. P value = 1.39e-08 with T-test analysis.
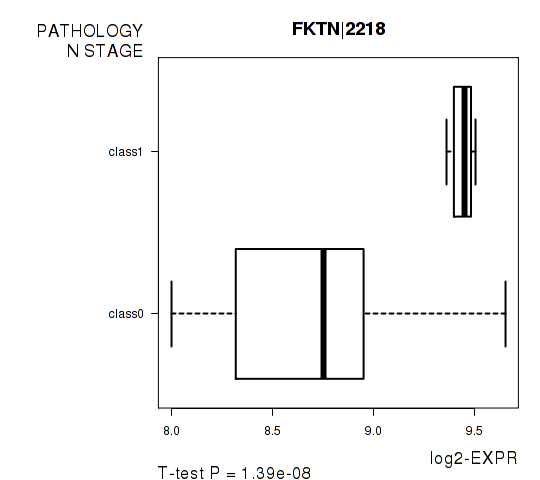
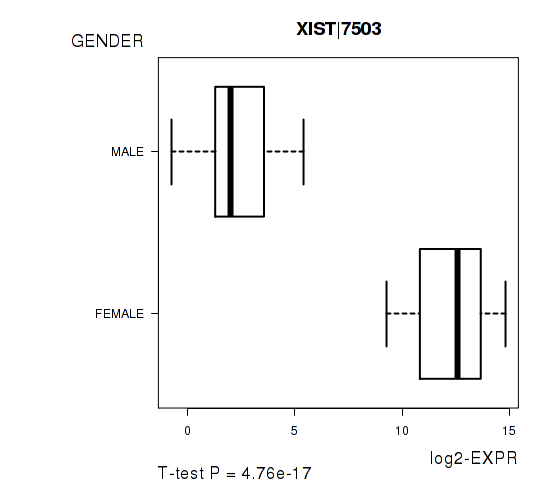
Table S9. Basic characteristics of clinical feature: 'GENDER'
| GENDER | Labels | N |
| FEMALE | 17 | |
| MALE | 17 | |
| Significant markers | N = 12 | |
| Higher in MALE | 10 | |
| Higher in FEMALE | 2 |
Table S10. Get Full Table List of top 10 genes differentially expressed by 'GENDER'
| T(pos if higher in 'MALE') | ttestP | Q | AUC | |
|---|---|---|---|---|
| XIST|7503 | -16.4 | 4.761e-17 | 8.43e-13 | 1 |
| TSIX|9383 | -17.3 | 2.678e-15 | 4.74e-11 | 1 |
| RPS4Y1|6192 | 14.02 | 2.415e-13 | 4.27e-09 | 1 |
| PRKY|5616 | 14.84 | 1.211e-12 | 2.14e-08 | 1 |
| DDX3Y|8653 | 14.44 | 1.875e-12 | 3.32e-08 | 1 |
| KDM5D|8284 | 14.32 | 7.014e-12 | 1.24e-07 | 1 |
| EIF1AY|9086 | 13.17 | 4.278e-10 | 7.57e-06 | 1 |
| USP9Y|8287 | 12.19 | 7.551e-10 | 1.34e-05 | 1 |
| ZFY|7544 | 9.64 | 3.652e-09 | 6.46e-05 | 1 |
| TTTY15|64595 | 10.04 | 1.008e-08 | 0.000178 | 1 |
Figure S4. Get High-res Image As an example, this figure shows the association of XIST|7503 to 'GENDER'. P value = 4.76e-17 with T-test analysis.
-
Expresson data file = ACC-TP.uncv2.mRNAseq_RSEM_normalized_log2.txt
-
Clinical data file = ACC-TP.merged_data.txt
-
Number of patients = 34
-
Number of genes = 17733
-
Number of clinical features = 6
For survival clinical features, Wald's test in univariate Cox regression analysis with proportional hazards model (Andersen and Gill 1982) was used to estimate the P values using the 'coxph' function in R. Kaplan-Meier survival curves were plot using the four quartile subgroups of patients based on expression levels
For continuous numerical clinical features, Spearman's rank correlation coefficients (Spearman 1904) and two-tailed P values were estimated using 'cor.test' function in R
For multi-class clinical features (ordinal or nominal), one-way analysis of variance (Howell 2002) was applied to compare the log2-expression levels between different clinical classes using 'anova' function in R
For two-class clinical features, two-tailed Student's t test with unequal variance (Lehmann and Romano 2005) was applied to compare the log2-expression levels between the two clinical classes using 't.test' function in R
For multiple hypothesis correction, Q value is the False Discovery Rate (FDR) analogue of the P value (Benjamini and Hochberg 1995), defined as the minimum FDR at which the test may be called significant. We used the 'Benjamini and Hochberg' method of 'p.adjust' function in R to convert P values into Q values.
In addition to the links below, the full results of the analysis summarized in this report can also be downloaded programmatically using firehose_get, or interactively from either the Broad GDAC website or TCGA Data Coordination Center Portal.