This pipeline uses various statistical tests to identify miRs whose expression levels correlated to selected clinical features.
Testing the association between 518 miRs and 6 clinical features across 34 samples, statistically thresholded by Q value < 0.05, 2 clinical features related to at least one miRs.
-
1 miR correlated to 'AGE'.
-
HSA-MIR-556
-
2 miRs correlated to 'PATHOLOGY.N.STAGE'.
-
HSA-MIR-766 , HSA-MIR-95
-
No miRs correlated to 'Time to Death', 'NEOPLASM.DISEASESTAGE', 'PATHOLOGY.T.STAGE', and 'GENDER'.
Complete statistical result table is provided in Supplement Table 1
Table 1. Get Full Table This table shows the clinical features, statistical methods used, and the number of miRs that are significantly associated with each clinical feature at Q value < 0.05.
| Clinical feature | Statistical test | Significant miRs | Associated with | Associated with | ||
|---|---|---|---|---|---|---|
| Time to Death | Cox regression test | N=0 | ||||
| AGE | Spearman correlation test | N=1 | older | N=1 | younger | N=0 |
| NEOPLASM DISEASESTAGE | ANOVA test | N=0 | ||||
| PATHOLOGY T STAGE | Spearman correlation test | N=0 | ||||
| PATHOLOGY N STAGE | t test | N=2 | class1 | N=2 | class0 | N=0 |
| GENDER | t test | N=0 |
Table S1. Basic characteristics of clinical feature: 'Time to Death'
| Time to Death | Duration (Months) | 6.9-121.2 (median=29.8) |
| censored | N = 26 | |
| death | N = 8 | |
| Significant markers | N = 0 |
Table S2. Basic characteristics of clinical feature: 'AGE'
| AGE | Mean (SD) | 50.82 (14) |
| Significant markers | N = 1 | |
| pos. correlated | 1 | |
| neg. correlated | 0 |
Table S3. Get Full Table List of one miR significantly correlated to 'AGE' by Spearman correlation test
| SpearmanCorr | corrP | Q | |
|---|---|---|---|
| HSA-MIR-556 | 0.7991 | 2.379e-05 | 0.0123 |
Figure S1. Get High-res Image As an example, this figure shows the association of HSA-MIR-556 to 'AGE'. P value = 2.38e-05 with Spearman correlation analysis. The straight line presents the best linear regression.
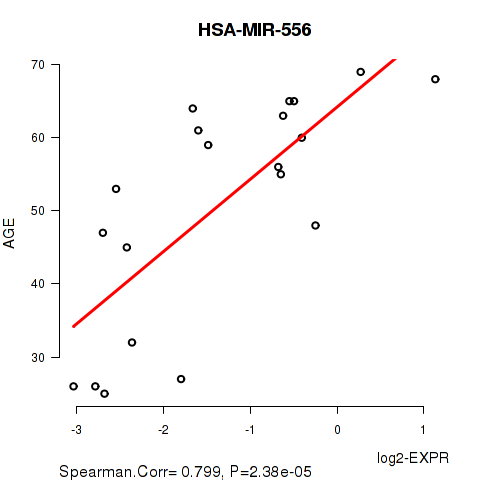
Table S4. Basic characteristics of clinical feature: 'NEOPLASM.DISEASESTAGE'
| NEOPLASM.DISEASESTAGE | Labels | N |
| STAGE I | 4 | |
| STAGE II | 13 | |
| STAGE III | 4 | |
| STAGE IV | 8 | |
| Significant markers | N = 0 |
Table S5. Basic characteristics of clinical feature: 'PATHOLOGY.T.STAGE'
| PATHOLOGY.T.STAGE | Mean (SD) | 2.55 (1.1) |
| N | ||
| 1 | 4 | |
| 2 | 14 | |
| 3 | 2 | |
| 4 | 9 | |
| Significant markers | N = 0 |
Table S6. Basic characteristics of clinical feature: 'PATHOLOGY.N.STAGE'
| PATHOLOGY.N.STAGE | Labels | N |
| class0 | 26 | |
| class1 | 4 | |
| Significant markers | N = 2 | |
| Higher in class1 | 2 | |
| Higher in class0 | 0 |
Table S7. Get Full Table List of 2 miRs differentially expressed by 'PATHOLOGY.N.STAGE'
| T(pos if higher in 'class1') | ttestP | Q | AUC | |
|---|---|---|---|---|
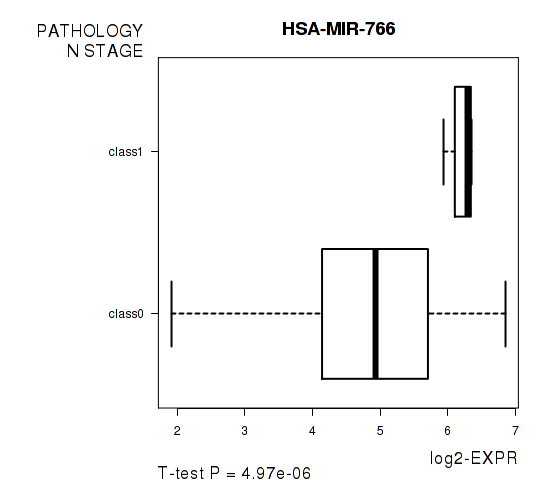
| HSA-MIR-766 | 5.69 | 4.966e-06 | 0.00218 | 0.9231 |
| HSA-MIR-95 | 5.14 | 9.735e-05 | 0.0427 | 0.9038 |
Figure S2. Get High-res Image As an example, this figure shows the association of HSA-MIR-766 to 'PATHOLOGY.N.STAGE'. P value = 4.97e-06 with T-test analysis.
-
Expresson data file = ACC-TP.miRseq_RPKM_log2.txt
-
Clinical data file = ACC-TP.merged_data.txt
-
Number of patients = 34
-
Number of miRs = 518
-
Number of clinical features = 6
For survival clinical features, Wald's test in univariate Cox regression analysis with proportional hazards model (Andersen and Gill 1982) was used to estimate the P values using the 'coxph' function in R. Kaplan-Meier survival curves were plot using the four quartile subgroups of patients based on expression levels
For continuous numerical clinical features, Spearman's rank correlation coefficients (Spearman 1904) and two-tailed P values were estimated using 'cor.test' function in R
For multi-class clinical features (ordinal or nominal), one-way analysis of variance (Howell 2002) was applied to compare the log2-expression levels between different clinical classes using 'anova' function in R
For two-class clinical features, two-tailed Student's t test with unequal variance (Lehmann and Romano 2005) was applied to compare the log2-expression levels between the two clinical classes using 't.test' function in R
For multiple hypothesis correction, Q value is the False Discovery Rate (FDR) analogue of the P value (Benjamini and Hochberg 1995), defined as the minimum FDR at which the test may be called significant. We used the 'Benjamini and Hochberg' method of 'p.adjust' function in R to convert P values into Q values.
In addition to the links below, the full results of the analysis summarized in this report can also be downloaded programmatically using firehose_get, or interactively from either the Broad GDAC website or TCGA Data Coordination Center Portal.