This pipeline computes the correlation between significantly recurrent gene mutations and selected clinical features.
Testing the association between mutation status of 23 genes and 11 clinical features across 128 patients, 3 significant findings detected with Q value < 0.25.
-
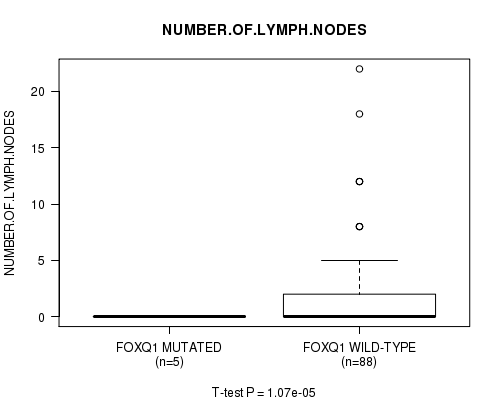
FOXQ1 mutation correlated to 'NUMBER.OF.LYMPH.NODES'.
-
TXNIP mutation correlated to 'KARNOFSKY.PERFORMANCE.SCORE'.
-
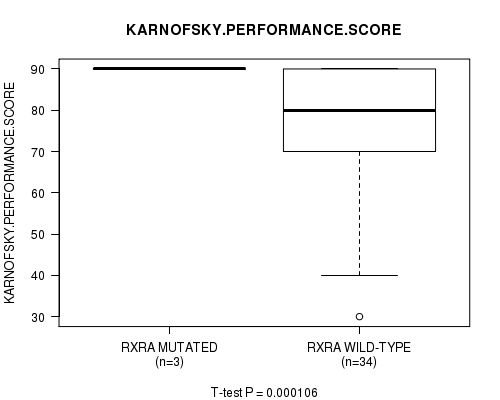
RXRA mutation correlated to 'KARNOFSKY.PERFORMANCE.SCORE'.
Table 1. Get Full Table Overview of the association between mutation status of 23 genes and 11 clinical features. Shown in the table are P values (Q values). Thresholded by Q value < 0.25, 3 significant findings detected.
|
Clinical Features |
Time to Death |
AGE |
NEOPLASM DISEASESTAGE |
PATHOLOGY T STAGE |
PATHOLOGY N STAGE |
PATHOLOGY M STAGE |
GENDER |
KARNOFSKY PERFORMANCE SCORE |
NUMBERPACKYEARSSMOKED |
NUMBER OF LYMPH NODES |
GLEASON SCORE |
||
| nMutated (%) | nWild-Type | logrank test | t-test | Fisher's exact test | Fisher's exact test | Fisher's exact test | Fisher's exact test | Fisher's exact test | t-test | t-test | t-test | t-test | |
| FOXQ1 | 7 (5%) | 121 |
0.04 (1.00) |
0.748 (1.00) |
0.0756 (1.00) |
0.284 (1.00) |
0.361 (1.00) |
0.0636 (1.00) |
0.679 (1.00) |
0.122 (1.00) |
1.07e-05 (0.00249) |
||
| TXNIP | 9 (7%) | 119 |
0.915 (1.00) |
0.563 (1.00) |
0.843 (1.00) |
1 (1.00) |
0.178 (1.00) |
0.488 (1.00) |
1 (1.00) |
0.000106 (0.0246) |
0.798 (1.00) |
0.997 (1.00) |
|
| RXRA | 12 (9%) | 116 |
0.908 (1.00) |
0.0635 (1.00) |
0.564 (1.00) |
0.604 (1.00) |
0.928 (1.00) |
0.401 (1.00) |
1 (1.00) |
0.000106 (0.0246) |
0.733 (1.00) |
0.972 (1.00) |
|
| PIK3CA | 26 (20%) | 102 |
0.0798 (1.00) |
0.859 (1.00) |
0.734 (1.00) |
0.766 (1.00) |
0.0775 (1.00) |
0.228 (1.00) |
0.803 (1.00) |
0.978 (1.00) |
0.518 (1.00) |
0.00426 (0.979) |
0.854 (1.00) |
| TP53 | 64 (50%) | 64 |
0.88 (1.00) |
0.899 (1.00) |
0.226 (1.00) |
0.572 (1.00) |
0.196 (1.00) |
0.44 (1.00) |
0.839 (1.00) |
0.111 (1.00) |
0.653 (1.00) |
0.191 (1.00) |
0.183 (1.00) |
| CDKN1A | 17 (13%) | 111 |
0.619 (1.00) |
0.147 (1.00) |
0.731 (1.00) |
0.367 (1.00) |
0.171 (1.00) |
0.634 (1.00) |
0.236 (1.00) |
0.201 (1.00) |
0.999 (1.00) |
0.192 (1.00) |
0.672 (1.00) |
| RB1 | 17 (13%) | 111 |
0.0536 (1.00) |
0.559 (1.00) |
1 (1.00) |
1 (1.00) |
0.583 (1.00) |
0.299 (1.00) |
0.559 (1.00) |
0.114 (1.00) |
0.0257 (1.00) |
0.802 (1.00) |
0.269 (1.00) |
| ARID1A | 32 (25%) | 96 |
0.435 (1.00) |
0.663 (1.00) |
0.19 (1.00) |
0.288 (1.00) |
0.564 (1.00) |
0.56 (1.00) |
0.643 (1.00) |
0.433 (1.00) |
0.894 (1.00) |
0.954 (1.00) |
0.158 (1.00) |
| MLL2 | 34 (27%) | 94 |
0.0145 (1.00) |
0.648 (1.00) |
0.0234 (1.00) |
0.155 (1.00) |
0.339 (1.00) |
0.0667 (1.00) |
1 (1.00) |
0.713 (1.00) |
0.281 (1.00) |
0.294 (1.00) |
0.697 (1.00) |
| FBXW7 | 13 (10%) | 115 |
0.124 (1.00) |
0.0865 (1.00) |
0.0822 (1.00) |
0.602 (1.00) |
0.271 (1.00) |
0.16 (1.00) |
0.309 (1.00) |
0.926 (1.00) |
0.664 (1.00) |
0.963 (1.00) |
0.764 (1.00) |
| KDM6A | 31 (24%) | 97 |
0.784 (1.00) |
0.554 (1.00) |
0.0876 (1.00) |
0.485 (1.00) |
0.0752 (1.00) |
0.774 (1.00) |
0.635 (1.00) |
0.462 (1.00) |
0.709 (1.00) |
0.265 (1.00) |
0.252 (1.00) |
| ELF3 | 11 (9%) | 117 |
0.481 (1.00) |
0.559 (1.00) |
0.0562 (1.00) |
0.812 (1.00) |
0.0842 (1.00) |
0.826 (1.00) |
0.465 (1.00) |
0.943 (1.00) |
0.455 (1.00) |
0.289 (1.00) |
|
| FGFR3 | 15 (12%) | 113 |
0.09 (1.00) |
0.233 (1.00) |
0.85 (1.00) |
0.646 (1.00) |
0.416 (1.00) |
0.00434 (0.994) |
0.354 (1.00) |
0.824 (1.00) |
0.954 (1.00) |
0.149 (1.00) |
0.945 (1.00) |
| STAG2 | 14 (11%) | 114 |
0.181 (1.00) |
0.168 (1.00) |
0.0787 (1.00) |
0.3 (1.00) |
0.356 (1.00) |
0.00763 (1.00) |
1 (1.00) |
0.604 (1.00) |
0.378 (1.00) |
0.388 (1.00) |
0.62 (1.00) |
| NFE2L2 | 10 (8%) | 118 |
0.389 (1.00) |
0.772 (1.00) |
0.171 (1.00) |
0.193 (1.00) |
0.92 (1.00) |
0.345 (1.00) |
0.12 (1.00) |
0.806 (1.00) |
0.107 (1.00) |
||
| CDKN2A | 7 (5%) | 121 |
0.475 (1.00) |
0.437 (1.00) |
0.0597 (1.00) |
1 (1.00) |
0.784 (1.00) |
1 (1.00) |
1 (1.00) |
0.215 (1.00) |
0.548 (1.00) |
||
| KLF5 | 9 (7%) | 119 |
0.734 (1.00) |
0.92 (1.00) |
0.552 (1.00) |
0.458 (1.00) |
0.441 (1.00) |
0.614 (1.00) |
0.0427 (1.00) |
0.995 (1.00) |
0.51 (1.00) |
||
| ASXL2 | 9 (7%) | 119 |
0.932 (1.00) |
0.203 (1.00) |
0.561 (1.00) |
0.445 (1.00) |
0.0991 (1.00) |
0.803 (1.00) |
1 (1.00) |
0.307 (1.00) |
0.502 (1.00) |
0.945 (1.00) |
|
| TSC1 | 10 (8%) | 118 |
0.542 (1.00) |
0.541 (1.00) |
0.392 (1.00) |
0.118 (1.00) |
0.364 (1.00) |
0.345 (1.00) |
1 (1.00) |
0.515 (1.00) |
0.773 (1.00) |
0.252 (1.00) |
|
| ERCC2 | 16 (12%) | 112 |
0.581 (1.00) |
0.355 (1.00) |
0.764 (1.00) |
0.448 (1.00) |
0.583 (1.00) |
0.608 (1.00) |
0.759 (1.00) |
0.0875 (1.00) |
0.14 (1.00) |
0.577 (1.00) |
0.227 (1.00) |
| EP300 | 21 (16%) | 107 |
0.953 (1.00) |
0.961 (1.00) |
0.851 (1.00) |
0.815 (1.00) |
0.943 (1.00) |
0.625 (1.00) |
0.591 (1.00) |
0.00503 (1.00) |
0.863 (1.00) |
0.251 (1.00) |
0.508 (1.00) |
| FOXA1 | 7 (5%) | 121 |
0.759 (1.00) |
0.647 (1.00) |
0.0851 (1.00) |
0.412 (1.00) |
0.0109 (1.00) |
0.0163 (1.00) |
0.065 (1.00) |
0.299 (1.00) |
|||
| PHLDA3 | 4 (3%) | 124 |
0.36 (1.00) |
0.971 (1.00) |
0.691 (1.00) |
1 (1.00) |
0.517 (1.00) |
0.258 (1.00) |
0.26 (1.00) |
P value = 1.07e-05 (t-test), Q value = 0.0025
Table S1. Gene #11: 'FOXQ1 MUTATION STATUS' versus Clinical Feature #10: 'NUMBER.OF.LYMPH.NODES'
| nPatients | Mean (Std.Dev) | |
|---|---|---|
| ALL | 93 | 1.8 (3.8) |
| FOXQ1 MUTATED | 5 | 0.0 (0.0) |
| FOXQ1 WILD-TYPE | 88 | 1.9 (3.9) |
Figure S1. Get High-res Image Gene #11: 'FOXQ1 MUTATION STATUS' versus Clinical Feature #10: 'NUMBER.OF.LYMPH.NODES'
P value = 0.000106 (t-test), Q value = 0.025
Table S2. Gene #19: 'TXNIP MUTATION STATUS' versus Clinical Feature #8: 'KARNOFSKY.PERFORMANCE.SCORE'
| nPatients | Mean (Std.Dev) | |
|---|---|---|
| ALL | 37 | 78.4 (16.4) |
| TXNIP MUTATED | 3 | 90.0 (0.0) |
| TXNIP WILD-TYPE | 34 | 77.4 (16.8) |
Figure S2. Get High-res Image Gene #19: 'TXNIP MUTATION STATUS' versus Clinical Feature #8: 'KARNOFSKY.PERFORMANCE.SCORE'

P value = 0.000106 (t-test), Q value = 0.025
Table S3. Gene #21: 'RXRA MUTATION STATUS' versus Clinical Feature #8: 'KARNOFSKY.PERFORMANCE.SCORE'
| nPatients | Mean (Std.Dev) | |
|---|---|---|
| ALL | 37 | 78.4 (16.4) |
| RXRA MUTATED | 3 | 90.0 (0.0) |
| RXRA WILD-TYPE | 34 | 77.4 (16.8) |
Figure S3. Get High-res Image Gene #21: 'RXRA MUTATION STATUS' versus Clinical Feature #8: 'KARNOFSKY.PERFORMANCE.SCORE'
-
Mutation data file = transformed.cor.cli.txt
-
Clinical data file = BLCA-TP.merged_data.txt
-
Number of patients = 128
-
Number of significantly mutated genes = 23
-
Number of selected clinical features = 11
-
Exclude genes that fewer than K tumors have mutations, K = 3
For survival clinical features, the Kaplan-Meier survival curves of tumors with and without gene mutations were plotted and the statistical significance P values were estimated by logrank test (Bland and Altman 2004) using the 'survdiff' function in R
For continuous numerical clinical features, two-tailed Student's t test with unequal variance (Lehmann and Romano 2005) was applied to compare the clinical values between tumors with and without gene mutations using 't.test' function in R
For binary or multi-class clinical features (nominal or ordinal), two-tailed Fisher's exact tests (Fisher 1922) were used to estimate the P values using the 'fisher.test' function in R
For multiple hypothesis correction, Q value is the False Discovery Rate (FDR) analogue of the P value (Benjamini and Hochberg 1995), defined as the minimum FDR at which the test may be called significant. We used the 'Benjamini and Hochberg' method of 'p.adjust' function in R to convert P values into Q values.
In addition to the links below, the full results of the analysis summarized in this report can also be downloaded programmatically using firehose_get, or interactively from either the Broad GDAC website or TCGA Data Coordination Center Portal.