This pipeline computes the correlation between significant arm-level copy number variations (cnvs) and molecular subtypes.
Testing the association between copy number variation 80 arm-level events and 8 molecular subtypes across 192 patients, 9 significant findings detected with P value < 0.05 and Q value < 0.25.
-
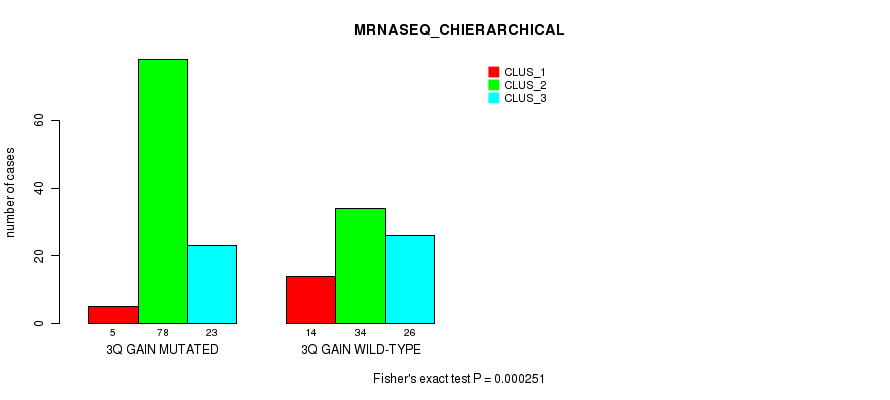
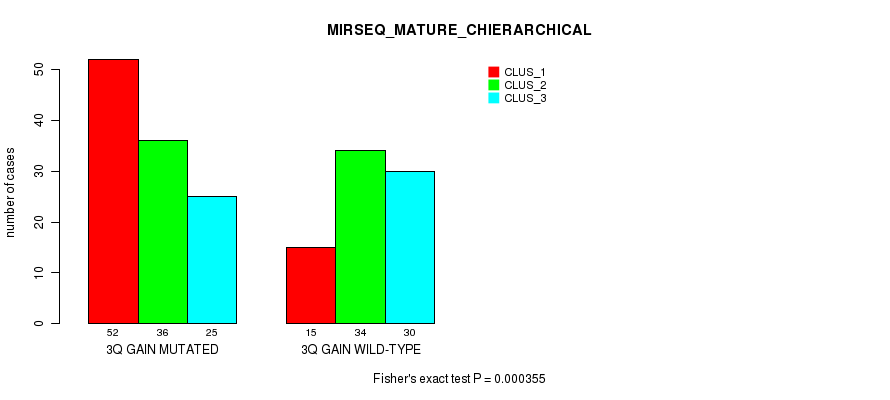
3q gain cnv correlated to 'MRNASEQ_CHIERARCHICAL' and 'MIRSEQ_MATURE_CHIERARCHICAL'.
-
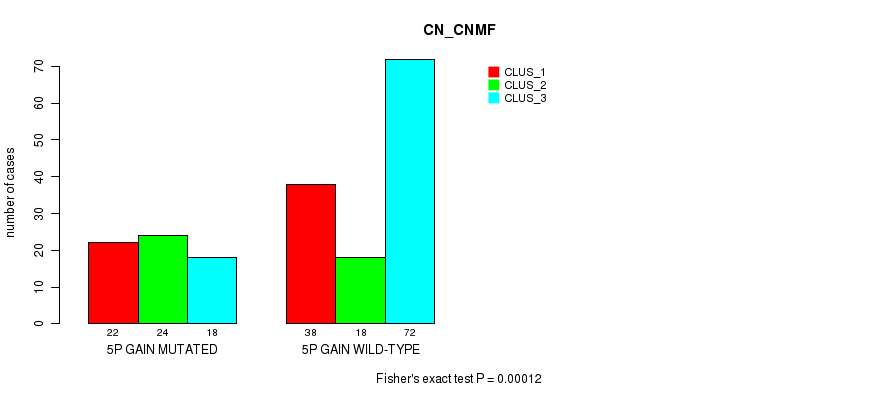
5p gain cnv correlated to 'CN_CNMF'.
-
11q gain cnv correlated to 'MRNASEQ_CHIERARCHICAL'.
-
19q gain cnv correlated to 'CN_CNMF'.
-
4p loss cnv correlated to 'CN_CNMF'.
-
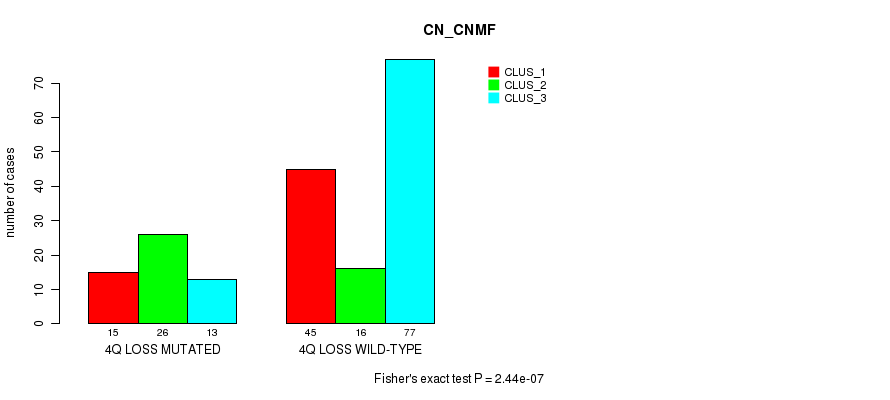
4q loss cnv correlated to 'CN_CNMF'.
-
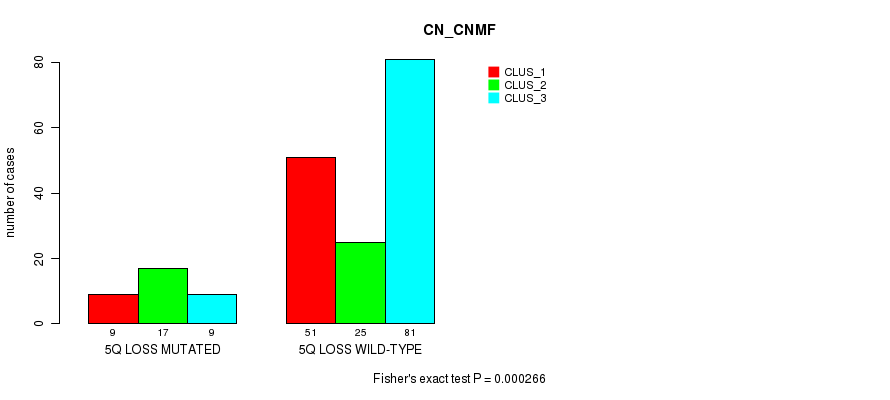
5q loss cnv correlated to 'CN_CNMF'.
-
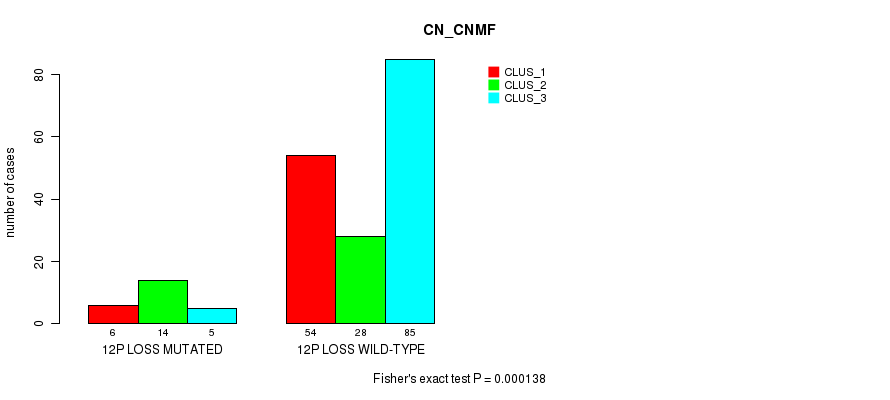
12p loss cnv correlated to 'CN_CNMF'.
Table 1. Get Full Table Overview of the association between significant copy number variation of 80 arm-level events and 8 molecular subtypes. Shown in the table are P values (Q values). Thresholded by P value < 0.05 and Q value < 0.25, 9 significant findings detected.
|
Clinical Features |
CN CNMF |
METHLYATION CNMF |
MRNASEQ CNMF |
MRNASEQ CHIERARCHICAL |
MIRSEQ CNMF |
MIRSEQ CHIERARCHICAL |
MIRSEQ MATURE CNMF |
MIRSEQ MATURE CHIERARCHICAL |
||
| nCNV (%) | nWild-Type | Fisher's exact test | Chi-square test | Fisher's exact test | Fisher's exact test | Fisher's exact test | Fisher's exact test | Fisher's exact test | Fisher's exact test | |
| 3q gain | 113 (59%) | 79 |
0.00263 (1.00) |
0.00121 (0.748) |
0.0022 (1.00) |
0.000251 (0.159) |
0.0946 (1.00) |
0.00267 (1.00) |
0.11 (1.00) |
0.000355 (0.224) |
| 5p gain | 64 (33%) | 128 |
0.00012 (0.0768) |
0.136 (1.00) |
0.231 (1.00) |
0.0124 (1.00) |
0.202 (1.00) |
0.0959 (1.00) |
0.169 (1.00) |
0.202 (1.00) |
| 11q gain | 7 (4%) | 185 |
0.0305 (1.00) |
0.287 (1.00) |
0.0113 (1.00) |
0.000142 (0.0903) |
0.235 (1.00) |
0.0584 (1.00) |
0.236 (1.00) |
0.503 (1.00) |
| 19q gain | 45 (23%) | 147 |
0.000261 (0.165) |
0.0487 (1.00) |
0.352 (1.00) |
0.281 (1.00) |
0.274 (1.00) |
0.403 (1.00) |
0.126 (1.00) |
1 (1.00) |
| 4p loss | 77 (40%) | 115 |
8.17e-07 (0.000522) |
0.0564 (1.00) |
0.0735 (1.00) |
0.00103 (0.64) |
0.0553 (1.00) |
0.0411 (1.00) |
0.173 (1.00) |
0.0102 (1.00) |
| 4q loss | 54 (28%) | 138 |
2.44e-07 (0.000156) |
0.12 (1.00) |
0.496 (1.00) |
0.00892 (1.00) |
0.529 (1.00) |
0.404 (1.00) |
0.619 (1.00) |
0.891 (1.00) |
| 5q loss | 35 (18%) | 157 |
0.000266 (0.169) |
0.218 (1.00) |
0.394 (1.00) |
0.875 (1.00) |
0.393 (1.00) |
0.911 (1.00) |
0.502 (1.00) |
0.944 (1.00) |
| 12p loss | 25 (13%) | 167 |
0.000138 (0.088) |
0.17 (1.00) |
0.107 (1.00) |
0.224 (1.00) |
0.164 (1.00) |
0.0292 (1.00) |
0.141 (1.00) |
0.097 (1.00) |
| 1p gain | 57 (30%) | 135 |
0.477 (1.00) |
0.00799 (1.00) |
0.032 (1.00) |
0.125 (1.00) |
0.914 (1.00) |
0.0822 (1.00) |
0.543 (1.00) |
0.131 (1.00) |
| 1q gain | 90 (47%) | 102 |
0.0401 (1.00) |
0.126 (1.00) |
0.188 (1.00) |
0.181 (1.00) |
0.792 (1.00) |
0.34 (1.00) |
0.975 (1.00) |
0.236 (1.00) |
| 2p gain | 40 (21%) | 152 |
0.0126 (1.00) |
0.00611 (1.00) |
0.0629 (1.00) |
0.0364 (1.00) |
0.183 (1.00) |
0.00235 (1.00) |
0.373 (1.00) |
0.0335 (1.00) |
| 2q gain | 25 (13%) | 167 |
0.00378 (1.00) |
0.0556 (1.00) |
0.000637 (0.4) |
0.0007 (0.439) |
0.158 (1.00) |
0.0114 (1.00) |
0.206 (1.00) |
0.0641 (1.00) |
| 3p gain | 48 (25%) | 144 |
0.753 (1.00) |
0.0146 (1.00) |
0.00842 (1.00) |
0.416 (1.00) |
0.0371 (1.00) |
0.0365 (1.00) |
0.108 (1.00) |
0.134 (1.00) |
| 4p gain | 6 (3%) | 186 |
1 (1.00) |
0.648 (1.00) |
0.762 (1.00) |
1 (1.00) |
0.88 (1.00) |
0.517 (1.00) |
0.88 (1.00) |
0.674 (1.00) |
| 4q gain | 7 (4%) | 185 |
0.784 (1.00) |
0.446 (1.00) |
0.796 (1.00) |
0.501 (1.00) |
0.893 (1.00) |
0.799 (1.00) |
0.895 (1.00) |
0.71 (1.00) |
| 5q gain | 28 (15%) | 164 |
0.0639 (1.00) |
0.563 (1.00) |
0.909 (1.00) |
0.844 (1.00) |
0.436 (1.00) |
0.535 (1.00) |
0.232 (1.00) |
0.935 (1.00) |
| 6p gain | 35 (18%) | 157 |
0.584 (1.00) |
0.0341 (1.00) |
0.215 (1.00) |
0.126 (1.00) |
0.318 (1.00) |
0.258 (1.00) |
0.624 (1.00) |
0.918 (1.00) |
| 6q gain | 22 (11%) | 170 |
0.725 (1.00) |
0.315 (1.00) |
0.288 (1.00) |
0.329 (1.00) |
0.553 (1.00) |
0.295 (1.00) |
0.811 (1.00) |
0.613 (1.00) |
| 7p gain | 23 (12%) | 169 |
0.0322 (1.00) |
0.0617 (1.00) |
0.116 (1.00) |
0.426 (1.00) |
0.0131 (1.00) |
0.0813 (1.00) |
0.0113 (1.00) |
0.0467 (1.00) |
| 7q gain | 21 (11%) | 171 |
0.044 (1.00) |
0.593 (1.00) |
0.755 (1.00) |
0.592 (1.00) |
0.0171 (1.00) |
0.528 (1.00) |
0.0415 (1.00) |
0.304 (1.00) |
| 8p gain | 29 (15%) | 163 |
0.904 (1.00) |
0.0858 (1.00) |
0.0138 (1.00) |
0.472 (1.00) |
0.902 (1.00) |
0.644 (1.00) |
0.731 (1.00) |
0.918 (1.00) |
| 8q gain | 50 (26%) | 142 |
0.381 (1.00) |
0.1 (1.00) |
0.299 (1.00) |
0.331 (1.00) |
0.0684 (1.00) |
0.0527 (1.00) |
0.546 (1.00) |
0.154 (1.00) |
| 9p gain | 30 (16%) | 162 |
0.588 (1.00) |
0.105 (1.00) |
0.575 (1.00) |
0.00458 (1.00) |
0.267 (1.00) |
0.299 (1.00) |
0.831 (1.00) |
0.183 (1.00) |
| 9q gain | 30 (16%) | 162 |
0.704 (1.00) |
0.0148 (1.00) |
0.0477 (1.00) |
0.000522 (0.329) |
0.0184 (1.00) |
0.0147 (1.00) |
0.529 (1.00) |
0.0164 (1.00) |
| 10p gain | 14 (7%) | 178 |
0.294 (1.00) |
0.742 (1.00) |
0.778 (1.00) |
0.914 (1.00) |
0.877 (1.00) |
0.885 (1.00) |
1 (1.00) |
0.886 (1.00) |
| 10q gain | 9 (5%) | 183 |
0.907 (1.00) |
0.85 (1.00) |
0.934 (1.00) |
0.88 (1.00) |
0.0781 (1.00) |
1 (1.00) |
0.128 (1.00) |
0.58 (1.00) |
| 11p gain | 6 (3%) | 186 |
0.669 (1.00) |
0.666 (1.00) |
0.0863 (1.00) |
0.00653 (1.00) |
0.88 (1.00) |
0.0799 (1.00) |
0.88 (1.00) |
0.877 (1.00) |
| 12p gain | 30 (16%) | 162 |
0.54 (1.00) |
0.358 (1.00) |
0.0137 (1.00) |
0.582 (1.00) |
0.0674 (1.00) |
0.496 (1.00) |
0.0104 (1.00) |
0.55 (1.00) |
| 12q gain | 30 (16%) | 162 |
0.3 (1.00) |
0.448 (1.00) |
0.00445 (1.00) |
0.582 (1.00) |
0.346 (1.00) |
0.652 (1.00) |
0.0951 (1.00) |
0.845 (1.00) |
| 13q gain | 16 (8%) | 176 |
0.444 (1.00) |
0.486 (1.00) |
0.348 (1.00) |
0.3 (1.00) |
0.061 (1.00) |
0.252 (1.00) |
0.0661 (1.00) |
0.423 (1.00) |
| 14q gain | 27 (14%) | 165 |
0.273 (1.00) |
0.3 (1.00) |
0.142 (1.00) |
0.581 (1.00) |
0.116 (1.00) |
0.014 (1.00) |
0.122 (1.00) |
0.129 (1.00) |
| 15q gain | 34 (18%) | 158 |
0.921 (1.00) |
0.41 (1.00) |
0.654 (1.00) |
0.261 (1.00) |
0.216 (1.00) |
1 (1.00) |
0.136 (1.00) |
0.96 (1.00) |
| 16p gain | 26 (14%) | 166 |
0.0681 (1.00) |
0.205 (1.00) |
0.437 (1.00) |
0.324 (1.00) |
0.0115 (1.00) |
0.24 (1.00) |
0.0981 (1.00) |
0.324 (1.00) |
| 16q gain | 23 (12%) | 169 |
0.27 (1.00) |
0.00842 (1.00) |
0.52 (1.00) |
0.395 (1.00) |
0.00102 (0.633) |
0.0289 (1.00) |
0.00181 (1.00) |
0.141 (1.00) |
| 17p gain | 14 (7%) | 178 |
0.0237 (1.00) |
0.0955 (1.00) |
0.551 (1.00) |
0.416 (1.00) |
0.721 (1.00) |
0.62 (1.00) |
0.776 (1.00) |
0.822 (1.00) |
| 17q gain | 31 (16%) | 161 |
0.00922 (1.00) |
0.131 (1.00) |
0.376 (1.00) |
0.193 (1.00) |
0.138 (1.00) |
0.0693 (1.00) |
0.128 (1.00) |
0.166 (1.00) |
| 18p gain | 25 (13%) | 167 |
0.485 (1.00) |
0.35 (1.00) |
0.131 (1.00) |
0.503 (1.00) |
0.726 (1.00) |
0.283 (1.00) |
0.779 (1.00) |
0.605 (1.00) |
| 18q gain | 14 (7%) | 178 |
0.548 (1.00) |
0.0258 (1.00) |
0.0154 (1.00) |
1 (1.00) |
0.349 (1.00) |
0.781 (1.00) |
0.723 (1.00) |
0.76 (1.00) |
| 19p gain | 29 (15%) | 163 |
0.0862 (1.00) |
0.567 (1.00) |
0.441 (1.00) |
0.782 (1.00) |
0.0735 (1.00) |
0.946 (1.00) |
0.041 (1.00) |
1 (1.00) |
| 20p gain | 66 (34%) | 126 |
0.00164 (1.00) |
0.0533 (1.00) |
0.191 (1.00) |
0.13 (1.00) |
0.645 (1.00) |
0.122 (1.00) |
0.203 (1.00) |
0.233 (1.00) |
| 20q gain | 74 (39%) | 118 |
0.00577 (1.00) |
0.0738 (1.00) |
0.533 (1.00) |
0.197 (1.00) |
0.387 (1.00) |
0.0887 (1.00) |
0.213 (1.00) |
0.0621 (1.00) |
| 21q gain | 27 (14%) | 165 |
0.791 (1.00) |
0.321 (1.00) |
0.159 (1.00) |
0.435 (1.00) |
1 (1.00) |
0.23 (1.00) |
0.872 (1.00) |
0.0644 (1.00) |
| 22q gain | 23 (12%) | 169 |
0.924 (1.00) |
0.0996 (1.00) |
0.0101 (1.00) |
0.448 (1.00) |
0.866 (1.00) |
0.765 (1.00) |
0.936 (1.00) |
0.394 (1.00) |
| xq gain | 26 (14%) | 166 |
0.146 (1.00) |
0.55 (1.00) |
0.182 (1.00) |
0.18 (1.00) |
0.0552 (1.00) |
0.0446 (1.00) |
0.12 (1.00) |
0.119 (1.00) |
| 1p loss | 7 (4%) | 185 |
0.0124 (1.00) |
0.348 (1.00) |
0.0577 (1.00) |
0.547 (1.00) |
0.495 (1.00) |
0.0315 (1.00) |
0.629 (1.00) |
0.447 (1.00) |
| 1q loss | 7 (4%) | 185 |
0.000702 (0.44) |
0.132 (1.00) |
0.0403 (1.00) |
0.169 (1.00) |
0.296 (1.00) |
0.125 (1.00) |
0.265 (1.00) |
0.232 (1.00) |
| 2p loss | 11 (6%) | 181 |
0.925 (1.00) |
0.886 (1.00) |
0.971 (1.00) |
0.236 (1.00) |
0.925 (1.00) |
0.734 (1.00) |
0.861 (1.00) |
0.686 (1.00) |
| 2q loss | 22 (11%) | 170 |
0.835 (1.00) |
0.11 (1.00) |
0.142 (1.00) |
0.286 (1.00) |
0.436 (1.00) |
0.607 (1.00) |
0.768 (1.00) |
0.533 (1.00) |
| 3p loss | 47 (24%) | 145 |
0.0796 (1.00) |
0.00387 (1.00) |
0.0259 (1.00) |
0.000544 (0.342) |
0.00949 (1.00) |
0.000857 (0.535) |
0.00471 (1.00) |
0.000886 (0.552) |
| 3q loss | 8 (4%) | 184 |
0.00206 (1.00) |
0.11 (1.00) |
0.132 (1.00) |
0.324 (1.00) |
0.9 (1.00) |
0.174 (1.00) |
0.9 (1.00) |
0.433 (1.00) |
| 5p loss | 13 (7%) | 179 |
0.128 (1.00) |
0.139 (1.00) |
0.836 (1.00) |
0.9 (1.00) |
0.876 (1.00) |
1 (1.00) |
0.82 (1.00) |
0.938 (1.00) |
| 6p loss | 29 (15%) | 163 |
0.656 (1.00) |
0.38 (1.00) |
0.118 (1.00) |
0.264 (1.00) |
0.531 (1.00) |
0.478 (1.00) |
0.888 (1.00) |
0.237 (1.00) |
| 6q loss | 47 (24%) | 145 |
0.13 (1.00) |
0.463 (1.00) |
0.174 (1.00) |
0.501 (1.00) |
0.7 (1.00) |
0.334 (1.00) |
0.514 (1.00) |
0.314 (1.00) |
| 7p loss | 18 (9%) | 174 |
0.364 (1.00) |
0.0821 (1.00) |
0.00361 (1.00) |
0.0538 (1.00) |
0.356 (1.00) |
0.0721 (1.00) |
0.191 (1.00) |
0.331 (1.00) |
| 7q loss | 29 (15%) | 163 |
0.0305 (1.00) |
0.615 (1.00) |
0.108 (1.00) |
0.281 (1.00) |
0.187 (1.00) |
0.0467 (1.00) |
0.218 (1.00) |
0.199 (1.00) |
| 8p loss | 51 (27%) | 141 |
0.011 (1.00) |
0.224 (1.00) |
0.18 (1.00) |
0.793 (1.00) |
0.539 (1.00) |
0.0589 (1.00) |
0.353 (1.00) |
0.0878 (1.00) |
| 8q loss | 17 (9%) | 175 |
0.672 (1.00) |
0.342 (1.00) |
0.0248 (1.00) |
0.0193 (1.00) |
0.195 (1.00) |
0.0447 (1.00) |
0.0418 (1.00) |
0.0936 (1.00) |
| 9p loss | 35 (18%) | 157 |
0.000474 (0.299) |
0.857 (1.00) |
0.579 (1.00) |
0.258 (1.00) |
1 (1.00) |
0.53 (1.00) |
0.971 (1.00) |
1 (1.00) |
| 9q loss | 29 (15%) | 163 |
0.00878 (1.00) |
0.214 (1.00) |
0.00639 (1.00) |
0.0373 (1.00) |
0.487 (1.00) |
0.124 (1.00) |
0.303 (1.00) |
0.215 (1.00) |
| 10p loss | 41 (21%) | 151 |
0.0446 (1.00) |
0.163 (1.00) |
0.191 (1.00) |
0.232 (1.00) |
0.919 (1.00) |
0.501 (1.00) |
0.713 (1.00) |
0.693 (1.00) |
| 10q loss | 45 (23%) | 147 |
0.0406 (1.00) |
0.383 (1.00) |
0.416 (1.00) |
0.21 (1.00) |
0.873 (1.00) |
0.759 (1.00) |
0.764 (1.00) |
0.688 (1.00) |
| 11p loss | 58 (30%) | 134 |
0.0312 (1.00) |
0.00878 (1.00) |
0.0475 (1.00) |
0.125 (1.00) |
0.0845 (1.00) |
0.104 (1.00) |
0.00971 (1.00) |
0.11 (1.00) |
| 11q loss | 73 (38%) | 119 |
0.00148 (0.911) |
0.324 (1.00) |
0.456 (1.00) |
0.372 (1.00) |
0.765 (1.00) |
0.451 (1.00) |
0.386 (1.00) |
0.368 (1.00) |
| 12q loss | 8 (4%) | 184 |
0.0307 (1.00) |
0.342 (1.00) |
1 (1.00) |
1 (1.00) |
0.672 (1.00) |
0.281 (1.00) |
0.604 (1.00) |
0.392 (1.00) |
| 13q loss | 49 (26%) | 143 |
0.0357 (1.00) |
0.00743 (1.00) |
0.0515 (1.00) |
0.00275 (1.00) |
0.00715 (1.00) |
0.115 (1.00) |
0.0051 (1.00) |
0.0708 (1.00) |
| 14q loss | 22 (11%) | 170 |
0.00759 (1.00) |
0.523 (1.00) |
0.109 (1.00) |
0.00866 (1.00) |
0.125 (1.00) |
0.223 (1.00) |
0.00885 (1.00) |
0.077 (1.00) |
| 15q loss | 25 (13%) | 167 |
0.328 (1.00) |
0.151 (1.00) |
0.456 (1.00) |
0.354 (1.00) |
0.949 (1.00) |
0.312 (1.00) |
0.716 (1.00) |
0.732 (1.00) |
| 16p loss | 24 (12%) | 168 |
0.362 (1.00) |
0.355 (1.00) |
0.196 (1.00) |
0.166 (1.00) |
0.122 (1.00) |
0.0614 (1.00) |
0.0548 (1.00) |
0.26 (1.00) |
| 16q loss | 30 (16%) | 162 |
0.704 (1.00) |
0.0039 (1.00) |
0.0262 (1.00) |
0.0561 (1.00) |
0.0376 (1.00) |
0.00355 (1.00) |
0.000722 (0.451) |
0.0467 (1.00) |
| 17p loss | 56 (29%) | 136 |
0.00235 (1.00) |
0.256 (1.00) |
0.0818 (1.00) |
0.0624 (1.00) |
0.0672 (1.00) |
0.156 (1.00) |
0.191 (1.00) |
0.031 (1.00) |
| 17q loss | 19 (10%) | 173 |
0.101 (1.00) |
0.00911 (1.00) |
0.0209 (1.00) |
0.0355 (1.00) |
0.0786 (1.00) |
0.00843 (1.00) |
0.0729 (1.00) |
0.0811 (1.00) |
| 18p loss | 35 (18%) | 157 |
0.263 (1.00) |
0.191 (1.00) |
0.0304 (1.00) |
0.11 (1.00) |
0.295 (1.00) |
0.0391 (1.00) |
0.013 (1.00) |
0.0827 (1.00) |
| 18q loss | 48 (25%) | 144 |
0.051 (1.00) |
0.0101 (1.00) |
0.00112 (0.697) |
0.00924 (1.00) |
0.153 (1.00) |
0.00201 (1.00) |
0.00533 (1.00) |
0.0378 (1.00) |
| 19p loss | 36 (19%) | 156 |
0.0374 (1.00) |
0.0125 (1.00) |
0.00285 (1.00) |
0.35 (1.00) |
0.465 (1.00) |
0.00317 (1.00) |
0.282 (1.00) |
0.07 (1.00) |
| 19q loss | 16 (8%) | 176 |
0.517 (1.00) |
0.423 (1.00) |
0.541 (1.00) |
0.454 (1.00) |
0.287 (1.00) |
0.0874 (1.00) |
0.0726 (1.00) |
0.0568 (1.00) |
| 20p loss | 14 (7%) | 178 |
0.373 (1.00) |
0.34 (1.00) |
0.56 (1.00) |
0.416 (1.00) |
0.469 (1.00) |
0.152 (1.00) |
0.224 (1.00) |
0.6 (1.00) |
| 20q loss | 5 (3%) | 187 |
1 (1.00) |
0.398 (1.00) |
0.647 (1.00) |
1 (1.00) |
0.635 (1.00) |
0.525 (1.00) |
0.742 (1.00) |
1 (1.00) |
| 21q loss | 28 (15%) | 164 |
0.00845 (1.00) |
0.188 (1.00) |
0.369 (1.00) |
0.00144 (0.892) |
0.776 (1.00) |
0.333 (1.00) |
0.784 (1.00) |
0.603 (1.00) |
| 22q loss | 42 (22%) | 150 |
0.167 (1.00) |
0.0869 (1.00) |
0.0829 (1.00) |
0.0397 (1.00) |
0.892 (1.00) |
0.199 (1.00) |
0.478 (1.00) |
0.239 (1.00) |
| xq loss | 39 (20%) | 153 |
0.021 (1.00) |
0.253 (1.00) |
0.158 (1.00) |
0.108 (1.00) |
0.314 (1.00) |
0.2 (1.00) |
0.15 (1.00) |
0.0139 (1.00) |
P value = 0.000251 (Fisher's exact test), Q value = 0.16
Table S1. Gene #6: '3q gain' versus Molecular Subtype #4: 'MRNASEQ_CHIERARCHICAL'
| nPatients | CLUS_1 | CLUS_2 | CLUS_3 |
|---|---|---|---|
| ALL | 19 | 112 | 49 |
| 3Q GAIN MUTATED | 5 | 78 | 23 |
| 3Q GAIN WILD-TYPE | 14 | 34 | 26 |
Figure S1. Get High-res Image Gene #6: '3q gain' versus Molecular Subtype #4: 'MRNASEQ_CHIERARCHICAL'
P value = 0.000355 (Fisher's exact test), Q value = 0.22
Table S2. Gene #6: '3q gain' versus Molecular Subtype #8: 'MIRSEQ_MATURE_CHIERARCHICAL'
| nPatients | CLUS_1 | CLUS_2 | CLUS_3 |
|---|---|---|---|
| ALL | 67 | 70 | 55 |
| 3Q GAIN MUTATED | 52 | 36 | 25 |
| 3Q GAIN WILD-TYPE | 15 | 34 | 30 |
Figure S2. Get High-res Image Gene #6: '3q gain' versus Molecular Subtype #8: 'MIRSEQ_MATURE_CHIERARCHICAL'
P value = 0.00012 (Fisher's exact test), Q value = 0.077
Table S3. Gene #9: '5p gain' versus Molecular Subtype #1: 'CN_CNMF'
| nPatients | CLUS_1 | CLUS_2 | CLUS_3 |
|---|---|---|---|
| ALL | 60 | 42 | 90 |
| 5P GAIN MUTATED | 22 | 24 | 18 |
| 5P GAIN WILD-TYPE | 38 | 18 | 72 |
Figure S3. Get High-res Image Gene #9: '5p gain' versus Molecular Subtype #1: 'CN_CNMF'
P value = 0.000142 (Fisher's exact test), Q value = 0.09
Table S4. Gene #22: '11q gain' versus Molecular Subtype #4: 'MRNASEQ_CHIERARCHICAL'
| nPatients | CLUS_1 | CLUS_2 | CLUS_3 |
|---|---|---|---|
| ALL | 19 | 112 | 49 |
| 11Q GAIN MUTATED | 4 | 0 | 3 |
| 11Q GAIN WILD-TYPE | 15 | 112 | 46 |
Figure S4. Get High-res Image Gene #22: '11q gain' versus Molecular Subtype #4: 'MRNASEQ_CHIERARCHICAL'

P value = 0.000261 (Fisher's exact test), Q value = 0.17
Table S5. Gene #35: '19q gain' versus Molecular Subtype #1: 'CN_CNMF'
| nPatients | CLUS_1 | CLUS_2 | CLUS_3 |
|---|---|---|---|
| ALL | 60 | 42 | 90 |
| 19Q GAIN MUTATED | 12 | 20 | 13 |
| 19Q GAIN WILD-TYPE | 48 | 22 | 77 |
Figure S5. Get High-res Image Gene #35: '19q gain' versus Molecular Subtype #1: 'CN_CNMF'

P value = 8.17e-07 (Fisher's exact test), Q value = 0.00052
Table S6. Gene #47: '4p loss' versus Molecular Subtype #1: 'CN_CNMF'
| nPatients | CLUS_1 | CLUS_2 | CLUS_3 |
|---|---|---|---|
| ALL | 60 | 42 | 90 |
| 4P LOSS MUTATED | 28 | 29 | 20 |
| 4P LOSS WILD-TYPE | 32 | 13 | 70 |
Figure S6. Get High-res Image Gene #47: '4p loss' versus Molecular Subtype #1: 'CN_CNMF'

P value = 2.44e-07 (Fisher's exact test), Q value = 0.00016
Table S7. Gene #48: '4q loss' versus Molecular Subtype #1: 'CN_CNMF'
| nPatients | CLUS_1 | CLUS_2 | CLUS_3 |
|---|---|---|---|
| ALL | 60 | 42 | 90 |
| 4Q LOSS MUTATED | 15 | 26 | 13 |
| 4Q LOSS WILD-TYPE | 45 | 16 | 77 |
Figure S7. Get High-res Image Gene #48: '4q loss' versus Molecular Subtype #1: 'CN_CNMF'
P value = 0.000266 (Fisher's exact test), Q value = 0.17
Table S8. Gene #50: '5q loss' versus Molecular Subtype #1: 'CN_CNMF'
| nPatients | CLUS_1 | CLUS_2 | CLUS_3 |
|---|---|---|---|
| ALL | 60 | 42 | 90 |
| 5Q LOSS MUTATED | 9 | 17 | 9 |
| 5Q LOSS WILD-TYPE | 51 | 25 | 81 |
Figure S8. Get High-res Image Gene #50: '5q loss' versus Molecular Subtype #1: 'CN_CNMF'
P value = 0.000138 (Fisher's exact test), Q value = 0.088
Table S9. Gene #63: '12p loss' versus Molecular Subtype #1: 'CN_CNMF'
| nPatients | CLUS_1 | CLUS_2 | CLUS_3 |
|---|---|---|---|
| ALL | 60 | 42 | 90 |
| 12P LOSS MUTATED | 6 | 14 | 5 |
| 12P LOSS WILD-TYPE | 54 | 28 | 85 |
Figure S9. Get High-res Image Gene #63: '12p loss' versus Molecular Subtype #1: 'CN_CNMF'
-
Copy number data file = transformed.cor.cli.txt
-
Molecular subtypes file = CESC-TP.transferedmergedcluster.txt
-
Number of patients = 192
-
Number of significantly arm-level cnvs = 80
-
Number of molecular subtypes = 8
-
Exclude genes that fewer than K tumors have mutations, K = 3
For binary or multi-class clinical features (nominal or ordinal), two-tailed Fisher's exact tests (Fisher 1922) were used to estimate the P values using the 'fisher.test' function in R
For multi-class clinical features (nominal or ordinal), Chi-square tests (Greenwood and Nikulin 1996) were used to estimate the P values using the 'chisq.test' function in R
For multiple hypothesis correction, Q value is the False Discovery Rate (FDR) analogue of the P value (Benjamini and Hochberg 1995), defined as the minimum FDR at which the test may be called significant. We used the 'Benjamini and Hochberg' method of 'p.adjust' function in R to convert P values into Q values.
In addition to the links below, the full results of the analysis summarized in this report can also be downloaded programmatically using firehose_get, or interactively from either the Broad GDAC website or TCGA Data Coordination Center Portal.