This pipeline computes the correlation between significant arm-level copy number variations (cnvs) and selected clinical features.
Testing the association between copy number variation 17 arm-level events and 3 clinical features across 21 patients, one significant finding detected with Q value < 0.25.
-
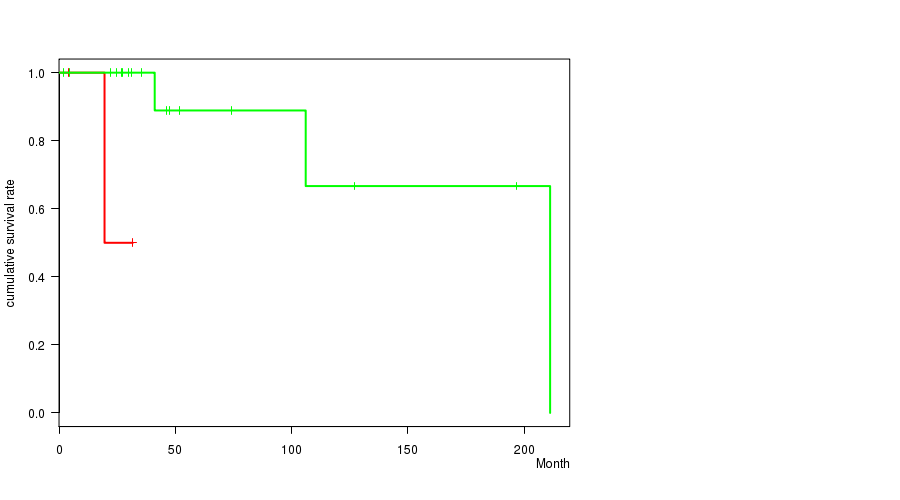
xq loss cnv correlated to 'Time to Death'.
Table 1. Get Full Table Overview of the association between significant copy number variation of 17 arm-level events and 3 clinical features. Shown in the table are P values (Q values). Thresholded by Q value < 0.25, one significant finding detected.
|
Clinical Features |
Time to Death |
AGE | GENDER | ||
| nCNV (%) | nWild-Type | logrank test | t-test | Fisher's exact test | |
| xq loss | 3 (14%) | 18 |
0.00468 (0.239) |
0.91 (1.00) |
0.257 (1.00) |
| 1q gain | 4 (19%) | 17 |
0.405 (1.00) |
0.42 (1.00) |
0.618 (1.00) |
| 3p gain | 3 (14%) | 18 |
0.418 (1.00) |
0.264 (1.00) |
1 (1.00) |
| 3q gain | 4 (19%) | 17 |
0.418 (1.00) |
0.993 (1.00) |
1 (1.00) |
| 7p gain | 7 (33%) | 14 |
0.317 (1.00) |
0.905 (1.00) |
1 (1.00) |
| 7q gain | 6 (29%) | 15 |
0.522 (1.00) |
0.717 (1.00) |
1 (1.00) |
| 11p gain | 3 (14%) | 18 |
0.569 (1.00) |
0.407 (1.00) |
0.257 (1.00) |
| 11q gain | 7 (33%) | 14 |
0.249 (1.00) |
0.273 (1.00) |
0.656 (1.00) |
| 12p gain | 3 (14%) | 18 |
0.724 (1.00) |
0.0499 (1.00) |
1 (1.00) |
| 12q gain | 3 (14%) | 18 |
0.724 (1.00) |
0.0499 (1.00) |
1 (1.00) |
| 16p gain | 3 (14%) | 18 |
0.808 (1.00) |
0.844 (1.00) |
1 (1.00) |
| 16q gain | 3 (14%) | 18 |
0.316 (1.00) |
0.606 (1.00) |
0.531 (1.00) |
| 18p gain | 4 (19%) | 17 |
0.389 (1.00) |
0.0811 (1.00) |
1 (1.00) |
| 18q gain | 4 (19%) | 17 |
0.389 (1.00) |
0.0811 (1.00) |
1 (1.00) |
| 21q gain | 5 (24%) | 16 |
0.892 (1.00) |
0.718 (1.00) |
1 (1.00) |
| 15q loss | 4 (19%) | 17 |
0.522 (1.00) |
0.964 (1.00) |
1 (1.00) |
| 16q loss | 3 (14%) | 18 |
0.724 (1.00) |
0.91 (1.00) |
0.257 (1.00) |
P value = 0.00468 (logrank test), Q value = 0.24
Table S1. Gene #17: 'xq loss' versus Clinical Feature #1: 'Time to Death'
| nPatients | nDeath | Duration Range (Median), Month | |
|---|---|---|---|
| ALL | 21 | 4 | 2.0 - 211.2 (31.7) |
| XQ LOSS MUTATED | 3 | 1 | 4.1 - 31.7 (19.6) |
| XQ LOSS WILD-TYPE | 18 | 3 | 2.0 - 211.2 (38.3) |
Figure S1. Get High-res Image Gene #17: 'xq loss' versus Clinical Feature #1: 'Time to Death'
-
Copy number data file = transformed.cor.cli.txt
-
Clinical data file = DLBC-TP.merged_data.txt
-
Number of patients = 21
-
Number of significantly arm-level cnvs = 17
-
Number of selected clinical features = 3
-
Exclude regions that fewer than K tumors have mutations, K = 3
For survival clinical features, the Kaplan-Meier survival curves of tumors with and without gene mutations were plotted and the statistical significance P values were estimated by logrank test (Bland and Altman 2004) using the 'survdiff' function in R
For continuous numerical clinical features, two-tailed Student's t test with unequal variance (Lehmann and Romano 2005) was applied to compare the clinical values between tumors with and without gene mutations using 't.test' function in R
For binary or multi-class clinical features (nominal or ordinal), two-tailed Fisher's exact tests (Fisher 1922) were used to estimate the P values using the 'fisher.test' function in R
For multiple hypothesis correction, Q value is the False Discovery Rate (FDR) analogue of the P value (Benjamini and Hochberg 1995), defined as the minimum FDR at which the test may be called significant. We used the 'Benjamini and Hochberg' method of 'p.adjust' function in R to convert P values into Q values.
In addition to the links below, the full results of the analysis summarized in this report can also be downloaded programmatically using firehose_get, or interactively from either the Broad GDAC website or TCGA Data Coordination Center Portal.