This pipeline uses various statistical tests to identify genes whose promoter methylation levels correlated to selected clinical features.
Testing the association between 19880 genes and 8 clinical features across 57 samples, statistically thresholded by Q value < 0.05, 5 clinical features related to at least one genes.
-
7 genes correlated to 'AGE'.
-
TMEM92 , FAM46A , PRSS3 , ARHGAP26 , SYT14 , ...
-
102 genes correlated to 'NEOPLASM.DISEASESTAGE'.
-
C20ORF177 , PPP1R3D , KRT81 , GADD45B , AIPL1 , ...
-
42 genes correlated to 'PATHOLOGY.M.STAGE'.
-
C20ORF177 , PPP1R3D , TOB2 , CSTF2T , PRKG1 , ...
-
2 genes correlated to 'GENDER'.
-
PTGER4 , SLC23A2
-
1 gene correlated to 'NUMBERPACKYEARSSMOKED'.
-
CKS2
-
No genes correlated to 'Time to Death', 'PATHOLOGY.T.STAGE', and 'PATHOLOGY.N.STAGE'.
Complete statistical result table is provided in Supplement Table 1
Table 1. Get Full Table This table shows the clinical features, statistical methods used, and the number of genes that are significantly associated with each clinical feature at Q value < 0.05.
| Clinical feature | Statistical test | Significant genes | Associated with | Associated with | ||
|---|---|---|---|---|---|---|
| Time to Death | Cox regression test | N=0 | ||||
| AGE | Spearman correlation test | N=7 | older | N=1 | younger | N=6 |
| NEOPLASM DISEASESTAGE | ANOVA test | N=102 | ||||
| PATHOLOGY T STAGE | Spearman correlation test | N=0 | ||||
| PATHOLOGY N STAGE | Spearman correlation test | N=0 | ||||
| PATHOLOGY M STAGE | ANOVA test | N=42 | ||||
| GENDER | t test | N=2 | male | N=2 | female | N=0 |
| NUMBERPACKYEARSSMOKED | Spearman correlation test | N=1 | higher numberpackyearssmoked | N=1 | lower numberpackyearssmoked | N=0 |
Table S1. Basic characteristics of clinical feature: 'Time to Death'
| Time to Death | Duration (Months) | 0-30.7 (median=1.1) |
| censored | N = 41 | |
| death | N = 13 | |
| Significant markers | N = 0 |
Table S2. Basic characteristics of clinical feature: 'AGE'
| AGE | Mean (SD) | 62.09 (12) |
| Significant markers | N = 7 | |
| pos. correlated | 1 | |
| neg. correlated | 6 |
Table S3. Get Full Table List of 7 genes significantly correlated to 'AGE' by Spearman correlation test
| SpearmanCorr | corrP | Q | |
|---|---|---|---|
| TMEM92 | -0.6381 | 9.309e-08 | 0.00185 |
| FAM46A | -0.6168 | 3.232e-07 | 0.00642 |
| PRSS3 | -0.6094 | 4.881e-07 | 0.0097 |
| ARHGAP26 | -0.6012 | 7.606e-07 | 0.0151 |
| SYT14 | 0.5837 | 1.886e-06 | 0.0375 |
| CPVL | -0.5812 | 2.133e-06 | 0.0424 |
| WWC1 | -0.5791 | 2.369e-06 | 0.0471 |
Figure S1. Get High-res Image As an example, this figure shows the association of TMEM92 to 'AGE'. P value = 9.31e-08 with Spearman correlation analysis. The straight line presents the best linear regression.
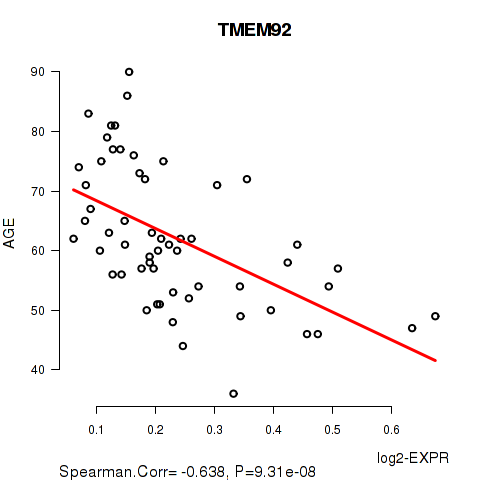
Table S4. Basic characteristics of clinical feature: 'NEOPLASM.DISEASESTAGE'
| NEOPLASM.DISEASESTAGE | Labels | N |
| STAGE I | 1 | |
| STAGE IA | 3 | |
| STAGE IB | 2 | |
| STAGE II | 1 | |
| STAGE IIA | 16 | |
| STAGE IIB | 11 | |
| STAGE III | 5 | |
| STAGE IIIA | 8 | |
| STAGE IIIB | 5 | |
| STAGE IIIC | 2 | |
| STAGE IV | 1 | |
| Significant markers | N = 102 |
Table S5. Get Full Table List of top 10 genes differentially expressed by 'NEOPLASM.DISEASESTAGE'
| ANOVA_P | Q | |
|---|---|---|
| C20ORF177 | 6.314e-60 | 1.26e-55 |
| PPP1R3D | 6.314e-60 | 1.26e-55 |
| KRT81 | 8.164e-47 | 1.62e-42 |
| GADD45B | 5.016e-35 | 9.97e-31 |
| AIPL1 | 7.855e-27 | 1.56e-22 |
| TOB2 | 1.602e-26 | 3.18e-22 |
| CPT2 | 2.633e-24 | 5.23e-20 |
| CSTF2T | 2.527e-23 | 5.02e-19 |
| PRKG1 | 2.527e-23 | 5.02e-19 |
| TMEM85 | 3.887e-22 | 7.72e-18 |
Figure S2. Get High-res Image As an example, this figure shows the association of C20ORF177 to 'NEOPLASM.DISEASESTAGE'. P value = 6.31e-60 with ANOVA analysis.
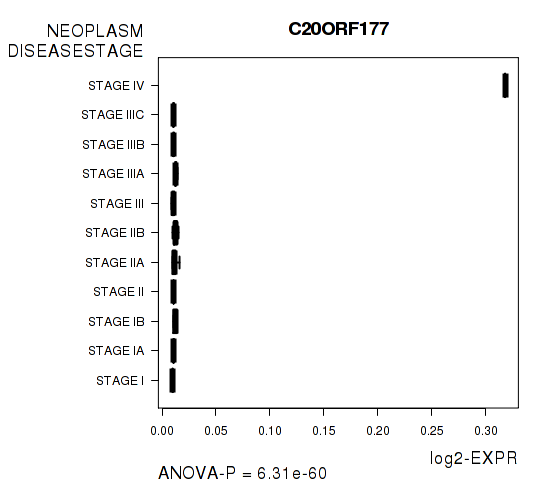
Table S6. Basic characteristics of clinical feature: 'PATHOLOGY.T.STAGE'
| PATHOLOGY.T.STAGE | Mean (SD) | 2.57 (0.76) |
| N | ||
| 1 | 6 | |
| 2 | 15 | |
| 3 | 32 | |
| 4 | 3 | |
| Significant markers | N = 0 |
Table S7. Basic characteristics of clinical feature: 'PATHOLOGY.N.STAGE'
| PATHOLOGY.N.STAGE | Mean (SD) | 0.69 (0.81) |
| N | ||
| 0 | 27 | |
| 1 | 20 | |
| 2 | 6 | |
| 3 | 2 | |
| Significant markers | N = 0 |
Table S8. Basic characteristics of clinical feature: 'PATHOLOGY.M.STAGE'
| PATHOLOGY.M.STAGE | Labels | N |
| M0 | 43 | |
| M1A | 1 | |
| MX | 8 | |
| Significant markers | N = 42 |
Table S9. Get Full Table List of top 10 genes differentially expressed by 'PATHOLOGY.M.STAGE'
| ANOVA_P | Q | |
|---|---|---|
| C20ORF177 | 2.093e-69 | 4.16e-65 |
| PPP1R3D | 2.093e-69 | 4.16e-65 |
| TOB2 | 8.395e-33 | 1.67e-28 |
| CSTF2T | 6.13e-30 | 1.22e-25 |
| PRKG1 | 6.13e-30 | 1.22e-25 |
| TMEM85 | 1.43e-28 | 2.84e-24 |
| ABCE1 | 5.778e-27 | 1.15e-22 |
| ANAPC10 | 5.778e-27 | 1.15e-22 |
| TRAFD1 | 1.443e-18 | 2.87e-14 |
| PROZ | 2.241e-18 | 4.45e-14 |
Figure S3. Get High-res Image As an example, this figure shows the association of C20ORF177 to 'PATHOLOGY.M.STAGE'. P value = 2.09e-69 with ANOVA analysis.
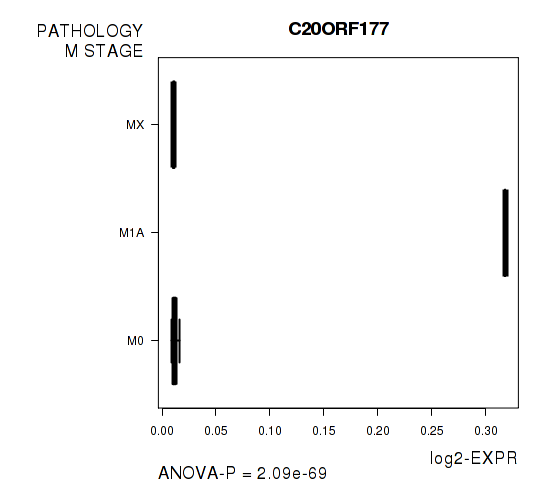
Table S10. Basic characteristics of clinical feature: 'GENDER'
| GENDER | Labels | N |
| FEMALE | 8 | |
| MALE | 49 | |
| Significant markers | N = 2 | |
| Higher in MALE | 2 | |
| Higher in FEMALE | 0 |
Table S11. Get Full Table List of 2 genes differentially expressed by 'GENDER'
| T(pos if higher in 'MALE') | ttestP | Q | AUC | |
|---|---|---|---|---|
| PTGER4 | 6.12 | 6.73e-07 | 0.0134 | 0.824 |
| SLC23A2 | 5.45 | 1.414e-06 | 0.0281 | 0.7679 |
Figure S4. Get High-res Image As an example, this figure shows the association of PTGER4 to 'GENDER'. P value = 6.73e-07 with T-test analysis.
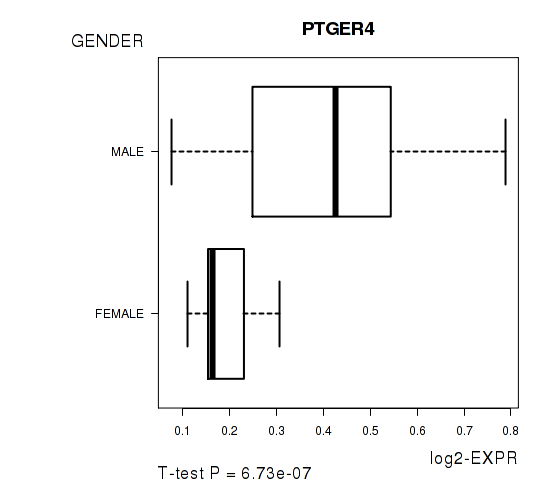
Table S12. Basic characteristics of clinical feature: 'NUMBERPACKYEARSSMOKED'
| NUMBERPACKYEARSSMOKED | Mean (SD) | 35.57 (16) |
| Significant markers | N = 1 | |
| pos. correlated | 1 | |
| neg. correlated | 0 |
Table S13. Get Full Table List of one gene significantly correlated to 'NUMBERPACKYEARSSMOKED' by Spearman correlation test
| SpearmanCorr | corrP | Q | |
|---|---|---|---|
| CKS2 | 0.7236 | 1.95e-06 | 0.0388 |
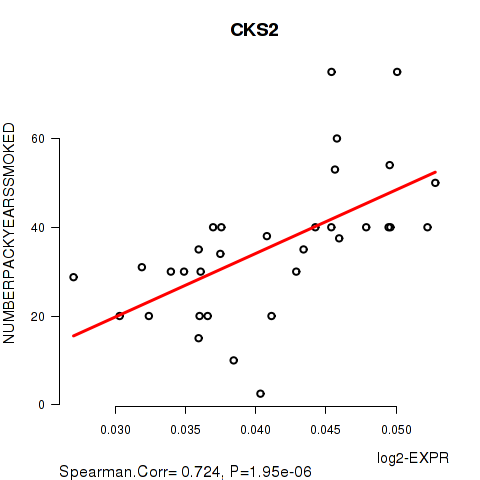
Figure S5. Get High-res Image As an example, this figure shows the association of CKS2 to 'NUMBERPACKYEARSSMOKED'. P value = 1.95e-06 with Spearman correlation analysis. The straight line presents the best linear regression.
-
Expresson data file = ESCA-TP.meth.by_min_clin_corr.data.txt
-
Clinical data file = ESCA-TP.merged_data.txt
-
Number of patients = 57
-
Number of genes = 19880
-
Number of clinical features = 8
For survival clinical features, Wald's test in univariate Cox regression analysis with proportional hazards model (Andersen and Gill 1982) was used to estimate the P values using the 'coxph' function in R. Kaplan-Meier survival curves were plot using the four quartile subgroups of patients based on expression levels
For continuous numerical clinical features, Spearman's rank correlation coefficients (Spearman 1904) and two-tailed P values were estimated using 'cor.test' function in R
For multi-class clinical features (ordinal or nominal), one-way analysis of variance (Howell 2002) was applied to compare the log2-expression levels between different clinical classes using 'anova' function in R
For two-class clinical features, two-tailed Student's t test with unequal variance (Lehmann and Romano 2005) was applied to compare the log2-expression levels between the two clinical classes using 't.test' function in R
For multiple hypothesis correction, Q value is the False Discovery Rate (FDR) analogue of the P value (Benjamini and Hochberg 1995), defined as the minimum FDR at which the test may be called significant. We used the 'Benjamini and Hochberg' method of 'p.adjust' function in R to convert P values into Q values.
In addition to the links below, the full results of the analysis summarized in this report can also be downloaded programmatically using firehose_get, or interactively from either the Broad GDAC website or TCGA Data Coordination Center Portal.