This pipeline uses various statistical tests to identify mRNAs whose expression levels correlated to selected clinical features.
Testing the association between 23891 genes and 8 clinical features across 51 samples, statistically thresholded by Q value < 0.05, 5 clinical features related to at least one genes.
-
21 genes correlated to 'AGE'.
-
CEP97|79598_CALCULATED , DDB2|1643_CALCULATED , KPNA7|402569_CALCULATED , ODZ4|26011|1OF2_CALCULATED , FOXE1|2304_CALCULATED , ...
-
3 genes correlated to 'NEOPLASM.DISEASESTAGE'.
-
CS330190|?|1OF2_CALCULATED , DQ600234|?_CALCULATED , DQ573774|?_CALCULATED
-
13 genes correlated to 'PATHOLOGY.T.STAGE'.
-
AX747838|?_CALCULATED , LOC731275|731275_CALCULATED , KDM6A|7403_CALCULATED , MIR_584|?|5OF49_CALCULATED , UNQ2790|?_CALCULATED , ...
-
1 gene correlated to 'PATHOLOGY.M.STAGE'.
-
TMEM132D|121256_CALCULATED
-
16 genes correlated to 'GENDER'.
-
PRKY|5616_CALCULATED , EIF1AY|9086_CALCULATED , ANKRD5|63926_CALCULATED , USP9Y|8287_CALCULATED , AK126491|?_CALCULATED , ...
-
No genes correlated to 'Time to Death', 'PATHOLOGY.N.STAGE', and 'NUMBERPACKYEARSSMOKED'.
Complete statistical result table is provided in Supplement Table 1
Table 1. Get Full Table This table shows the clinical features, statistical methods used, and the number of genes that are significantly associated with each clinical feature at Q value < 0.05.
| Clinical feature | Statistical test | Significant genes | Associated with | Associated with | ||
|---|---|---|---|---|---|---|
| Time to Death | Cox regression test | N=0 | ||||
| AGE | Spearman correlation test | N=21 | older | N=7 | younger | N=14 |
| NEOPLASM DISEASESTAGE | ANOVA test | N=3 | ||||
| PATHOLOGY T STAGE | Spearman correlation test | N=13 | higher stage | N=0 | lower stage | N=13 |
| PATHOLOGY N STAGE | Spearman correlation test | N=0 | ||||
| PATHOLOGY M STAGE | ANOVA test | N=1 | ||||
| GENDER | t test | N=16 | male | N=7 | female | N=9 |
| NUMBERPACKYEARSSMOKED | Spearman correlation test | N=0 |
Table S1. Basic characteristics of clinical feature: 'Time to Death'
| Time to Death | Duration (Months) | 0-30.7 (median=0.8) |
| censored | N = 36 | |
| death | N = 13 | |
| Significant markers | N = 0 |
Table S2. Basic characteristics of clinical feature: 'AGE'
| AGE | Mean (SD) | 62.71 (12) |
| Significant markers | N = 21 | |
| pos. correlated | 7 | |
| neg. correlated | 14 |
Table S3. Get Full Table List of top 10 genes significantly correlated to 'AGE' by Spearman correlation test
| SpearmanCorr | corrP | Q | |
|---|---|---|---|
| CEP97|79598_CALCULATED | -0.6785 | 4.464e-08 | 0.00107 |
| DDB2|1643_CALCULATED | -0.664 | 1.088e-07 | 0.0026 |
| KPNA7|402569_CALCULATED | 0.6639 | 1.09e-07 | 0.0026 |
| ODZ4|26011|1OF2_CALCULATED | -0.6561 | 1.731e-07 | 0.00413 |
| FOXE1|2304_CALCULATED | -0.6599 | 1.857e-07 | 0.00444 |
| ST6GAL2|84620_CALCULATED | -0.6588 | 1.982e-07 | 0.00474 |
| TNNC2|7125_CALCULATED | 0.653 | 2.069e-07 | 0.00494 |
| LINC00173|100287569_CALCULATED | -0.6474 | 2.841e-07 | 0.00678 |
| RHBDL3|162494_CALCULATED | -0.6416 | 3.902e-07 | 0.00932 |
| C19ORF77|284422_CALCULATED | 0.6404 | 4.181e-07 | 0.00999 |
Figure S1. Get High-res Image As an example, this figure shows the association of CEP97|79598_CALCULATED to 'AGE'. P value = 4.46e-08 with Spearman correlation analysis. The straight line presents the best linear regression.
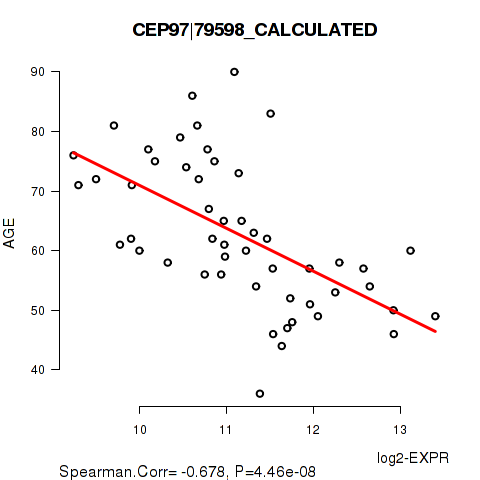
Table S4. Basic characteristics of clinical feature: 'NEOPLASM.DISEASESTAGE'
| NEOPLASM.DISEASESTAGE | Labels | N |
| STAGE I | 1 | |
| STAGE IA | 3 | |
| STAGE IB | 2 | |
| STAGE II | 1 | |
| STAGE IIA | 16 | |
| STAGE IIB | 9 | |
| STAGE III | 5 | |
| STAGE IIIA | 6 | |
| STAGE IIIB | 5 | |
| STAGE IIIC | 1 | |
| STAGE IV | 1 | |
| Significant markers | N = 3 |
Table S5. Get Full Table List of 3 genes differentially expressed by 'NEOPLASM.DISEASESTAGE'
| ANOVA_P | Q | |
|---|---|---|
| CS330190|?|1OF2_CALCULATED | 1.123e-113 | 2.68e-109 |
| DQ600234|?_CALCULATED | 5.273e-112 | 1.26e-107 |
| DQ573774|?_CALCULATED | 4.295e-84 | 1.03e-79 |
Figure S2. Get High-res Image As an example, this figure shows the association of CS330190|?|1OF2_CALCULATED to 'NEOPLASM.DISEASESTAGE'. P value = 1.12e-113 with ANOVA analysis.
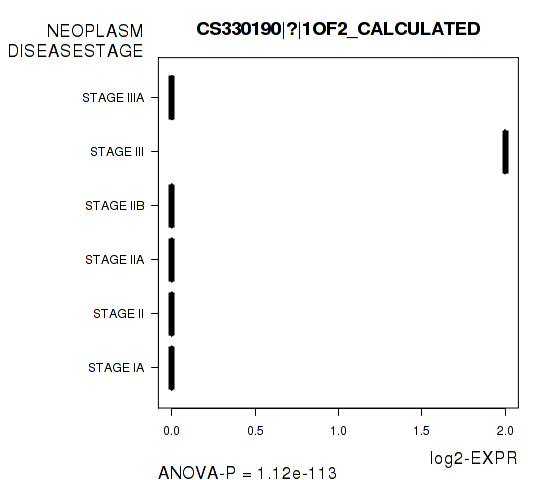
Table S6. Basic characteristics of clinical feature: 'PATHOLOGY.T.STAGE'
| PATHOLOGY.T.STAGE | Mean (SD) | 2.54 (0.76) |
| N | ||
| 1 | 6 | |
| 2 | 13 | |
| 3 | 29 | |
| 4 | 2 | |
| Significant markers | N = 13 | |
| pos. correlated | 0 | |
| neg. correlated | 13 |
Table S7. Get Full Table List of top 10 genes significantly correlated to 'PATHOLOGY.T.STAGE' by Spearman correlation test
| SpearmanCorr | corrP | Q | |
|---|---|---|---|
| AX747838|?_CALCULATED | -0.6977 | 1.795e-08 | 0.000429 |
| LOC731275|731275_CALCULATED | -0.6777 | 6.432e-08 | 0.00154 |
| KDM6A|7403_CALCULATED | -0.6639 | 1.471e-07 | 0.00351 |
| MIR_584|?|5OF49_CALCULATED | -0.7494 | 2.218e-07 | 0.0053 |
| UNQ2790|?_CALCULATED | -0.6447 | 4.356e-07 | 0.0104 |
| INE1|8552_CALCULATED | -0.6401 | 5.586e-07 | 0.0133 |
| VPS54|51542_CALCULATED | -0.639 | 5.904e-07 | 0.0141 |
| CLCN5|1184_CALCULATED | -0.6359 | 6.973e-07 | 0.0167 |
| U6|?|158OF178_CALCULATED | -0.6502 | 7.542e-07 | 0.018 |
| RBP2|5948_CALCULATED | -0.6456 | 1.266e-06 | 0.0302 |
Figure S3. Get High-res Image As an example, this figure shows the association of AX747838|?_CALCULATED to 'PATHOLOGY.T.STAGE'. P value = 1.79e-08 with Spearman correlation analysis.

Table S8. Basic characteristics of clinical feature: 'PATHOLOGY.N.STAGE'
| PATHOLOGY.N.STAGE | Mean (SD) | 0.62 (0.78) |
| N | ||
| 0 | 27 | |
| 1 | 16 | |
| 2 | 6 | |
| 3 | 1 | |
| Significant markers | N = 0 |
Table S9. Basic characteristics of clinical feature: 'PATHOLOGY.M.STAGE'
| PATHOLOGY.M.STAGE | Labels | N |
| M0 | 39 | |
| M1A | 1 | |
| MX | 6 | |
| Significant markers | N = 1 |
Table S10. Get Full Table List of one gene differentially expressed by 'PATHOLOGY.M.STAGE'
| ANOVA_P | Q | |
|---|---|---|
| TMEM132D|121256_CALCULATED | 8.924e-08 | 0.00213 |
Figure S4. Get High-res Image As an example, this figure shows the association of TMEM132D|121256_CALCULATED to 'PATHOLOGY.M.STAGE'. P value = 8.92e-08 with ANOVA analysis.
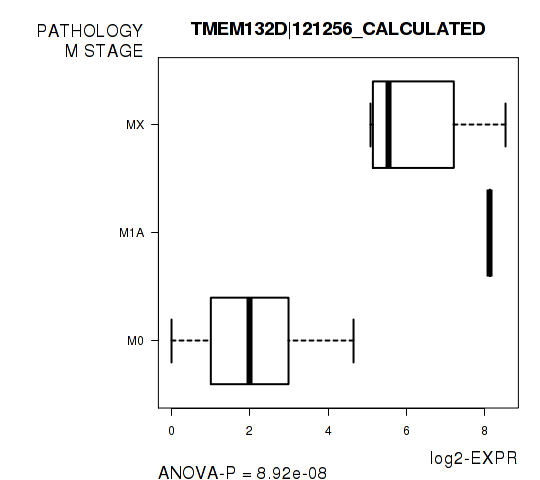
Table S11. Basic characteristics of clinical feature: 'GENDER'
| GENDER | Labels | N |
| FEMALE | 7 | |
| MALE | 44 | |
| Significant markers | N = 16 | |
| Higher in MALE | 7 | |
| Higher in FEMALE | 9 |
Table S12. Get Full Table List of top 10 genes differentially expressed by 'GENDER'
| T(pos if higher in 'MALE') | ttestP | Q | AUC | |
|---|---|---|---|---|
| PRKY|5616_CALCULATED | 21.38 | 6.039e-14 | 1.42e-09 | 1 |
| EIF1AY|9086_CALCULATED | 20.89 | 3.042e-11 | 7.13e-07 | 1 |
| ANKRD5|63926_CALCULATED | -7.76 | 4.894e-10 | 1.15e-05 | 0.8799 |
| USP9Y|8287_CALCULATED | 22.03 | 6.676e-10 | 1.56e-05 | 1 |
| AK126491|?_CALCULATED | 10.03 | 3.029e-09 | 7.1e-05 | 1 |
| ZFY|7544_CALCULATED | 22.08 | 7.671e-09 | 0.00018 | 1 |
| DDX3Y|8653_CALCULATED | 21.38 | 1.142e-08 | 0.000268 | 1 |
| TSIX|9383_CALCULATED | -11.75 | 1.67e-08 | 0.000391 | 0.9652 |
| XIST|7503_CALCULATED | -11.24 | 3.664e-08 | 0.000858 | 0.9679 |
| MCM8|84515_CALCULATED | -6.47 | 5.341e-08 | 0.00125 | 0.8929 |
Figure S5. Get High-res Image As an example, this figure shows the association of PRKY|5616_CALCULATED to 'GENDER'. P value = 6.04e-14 with T-test analysis.

-
Expresson data file = ESCA-TP.mRNAseq_RPKM_log2.txt
-
Clinical data file = ESCA-TP.merged_data.txt
-
Number of patients = 51
-
Number of genes = 23891
-
Number of clinical features = 8
For survival clinical features, Wald's test in univariate Cox regression analysis with proportional hazards model (Andersen and Gill 1982) was used to estimate the P values using the 'coxph' function in R. Kaplan-Meier survival curves were plot using the four quartile subgroups of patients based on expression levels
For continuous numerical clinical features, Spearman's rank correlation coefficients (Spearman 1904) and two-tailed P values were estimated using 'cor.test' function in R
For multi-class clinical features (ordinal or nominal), one-way analysis of variance (Howell 2002) was applied to compare the log2-expression levels between different clinical classes using 'anova' function in R
For two-class clinical features, two-tailed Student's t test with unequal variance (Lehmann and Romano 2005) was applied to compare the log2-expression levels between the two clinical classes using 't.test' function in R
For multiple hypothesis correction, Q value is the False Discovery Rate (FDR) analogue of the P value (Benjamini and Hochberg 1995), defined as the minimum FDR at which the test may be called significant. We used the 'Benjamini and Hochberg' method of 'p.adjust' function in R to convert P values into Q values.
In addition to the links below, the full results of the analysis summarized in this report can also be downloaded programmatically using firehose_get, or interactively from either the Broad GDAC website or TCGA Data Coordination Center Portal.