This pipeline computes the correlation between significant copy number variation (cnv focal) genes and selected clinical features.
Testing the association between copy number variation 71 focal events and 6 clinical features across 560 patients, 17 significant findings detected with Q value < 0.25.
-
amp_7p11.2 cnv correlated to 'Time to Death' and 'AGE'.
-
amp_7q11.21 cnv correlated to 'Time to Death' and 'AGE'.
-
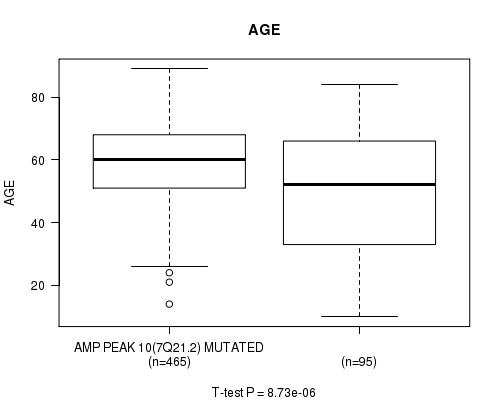
amp_7q21.2 cnv correlated to 'Time to Death' and 'AGE'.
-
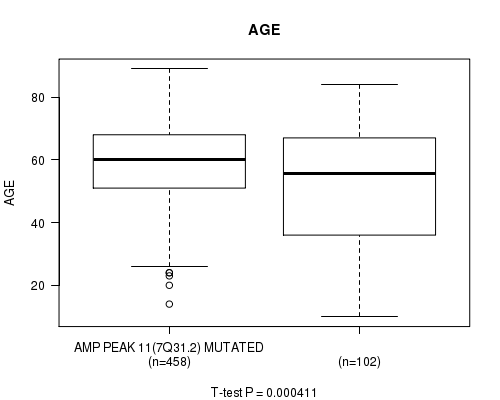
amp_7q31.2 cnv correlated to 'AGE'.
-
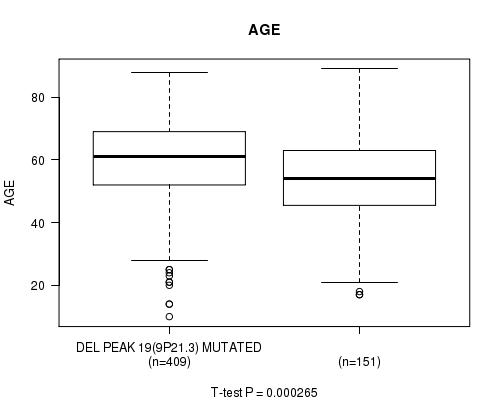
del_9p21.3 cnv correlated to 'AGE'.
-
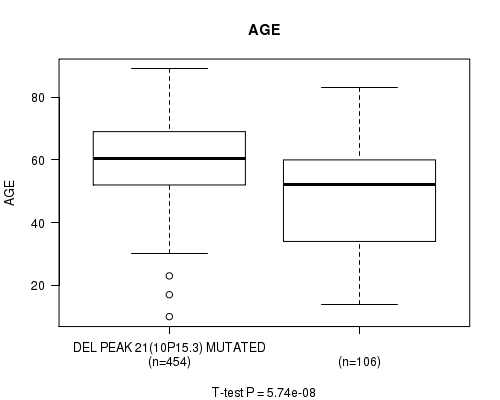
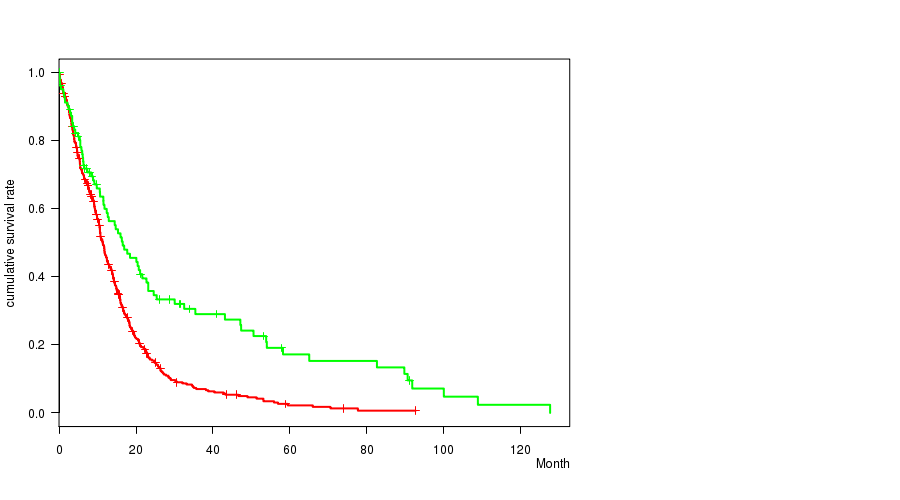
del_10p15.3 cnv correlated to 'Time to Death' and 'AGE'.
-
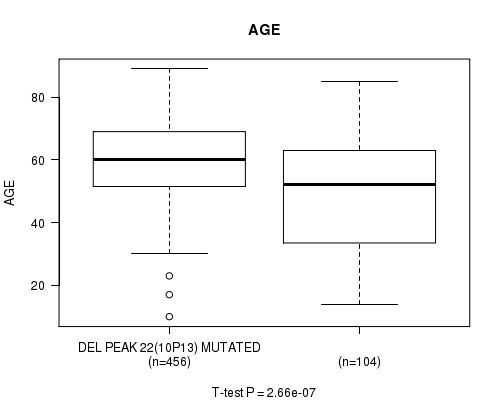
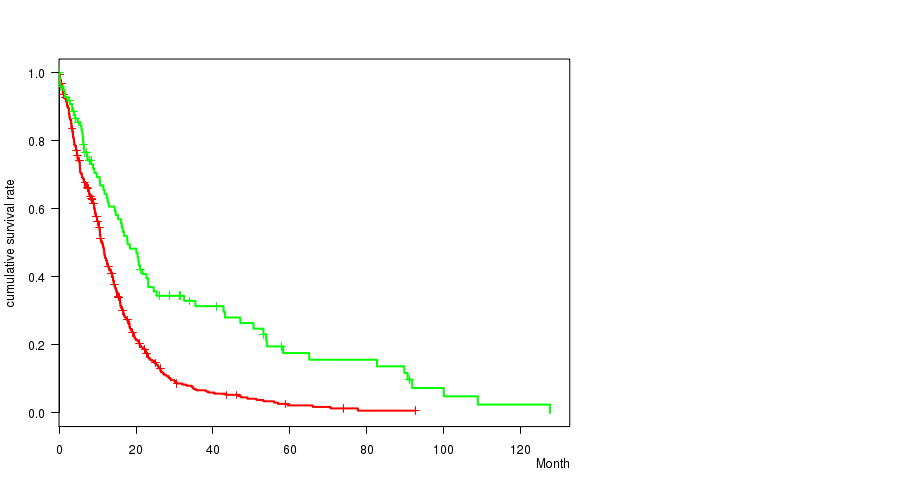
del_10p13 cnv correlated to 'Time to Death' and 'AGE'.
-
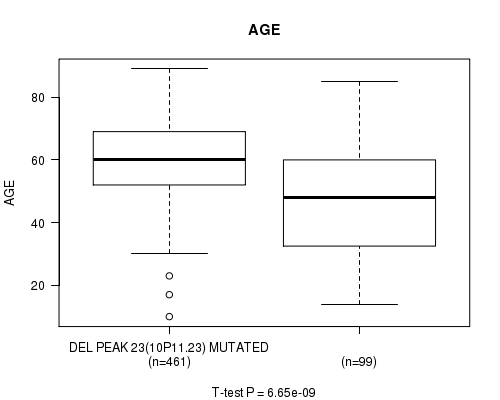
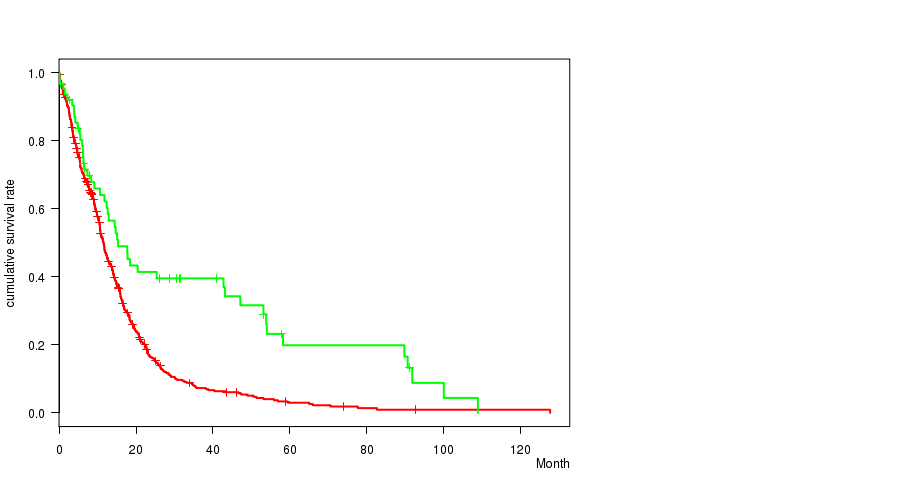
del_10p11.23 cnv correlated to 'Time to Death' and 'AGE'.
-
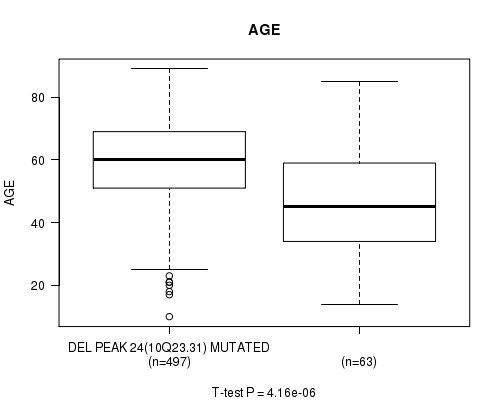
del_10q23.31 cnv correlated to 'Time to Death' and 'AGE'.
-
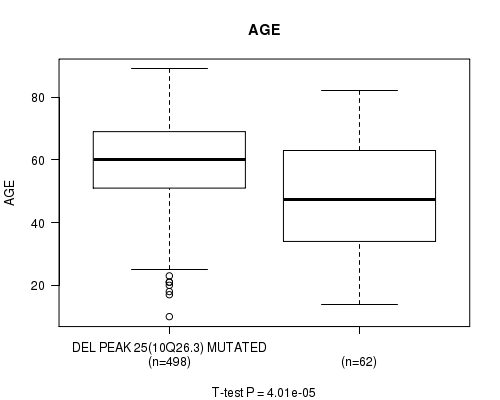
del_10q26.3 cnv correlated to 'AGE'.
Table 1. Get Full Table Overview of the association between significant copy number variation of 71 focal events and 6 clinical features. Shown in the table are P values (Q values). Thresholded by Q value < 0.25, 17 significant findings detected.
|
Clinical Features |
Time to Death |
AGE | GENDER |
KARNOFSKY PERFORMANCE SCORE |
HISTOLOGICAL TYPE |
RADIATIONS RADIATION REGIMENINDICATION |
||
| nCNV (%) | nWild-Type | logrank test | t-test | Fisher's exact test | t-test | Fisher's exact test | Fisher's exact test | |
| amp 7p11 2 | 492 (88%) | 68 |
4.43e-07 (0.000186) |
1.32e-09 (5.64e-07) |
0.427 (1.00) |
0.0328 (1.00) |
0.056 (1.00) |
0.0716 (1.00) |
| amp 7q11 21 | 450 (80%) | 110 |
3.71e-05 (0.0153) |
1.26e-07 (5.32e-05) |
0.327 (1.00) |
0.597 (1.00) |
0.00661 (1.00) |
0.137 (1.00) |
| amp 7q21 2 | 465 (83%) | 95 |
0.000285 (0.117) |
8.73e-06 (0.00363) |
0.565 (1.00) |
0.408 (1.00) |
0.107 (1.00) |
0.148 (1.00) |
| del 10p15 3 | 454 (81%) | 106 |
3.1e-06 (0.00129) |
5.74e-08 (2.44e-05) |
0.185 (1.00) |
0.452 (1.00) |
0.00471 (1.00) |
0.73 (1.00) |
| del 10p13 | 456 (81%) | 104 |
2.19e-06 (0.000917) |
2.66e-07 (0.000112) |
0.0756 (1.00) |
0.921 (1.00) |
0.00404 (1.00) |
0.817 (1.00) |
| del 10p11 23 | 461 (82%) | 99 |
9.8e-08 (4.15e-05) |
6.65e-09 (2.83e-06) |
0.175 (1.00) |
0.152 (1.00) |
0.00208 (0.847) |
0.812 (1.00) |
| del 10q23 31 | 497 (89%) | 63 |
1.5e-05 (0.00623) |
4.16e-06 (0.00173) |
0.785 (1.00) |
0.0354 (1.00) |
0.00523 (1.00) |
1 (1.00) |
| amp 7q31 2 | 458 (82%) | 102 |
0.00353 (1.00) |
0.000411 (0.169) |
0.433 (1.00) |
0.814 (1.00) |
0.214 (1.00) |
0.0595 (1.00) |
| del 9p21 3 | 409 (73%) | 151 |
0.0224 (1.00) |
0.000265 (0.109) |
0.559 (1.00) |
0.0546 (1.00) |
0.598 (1.00) |
0.357 (1.00) |
| del 10q26 3 | 498 (89%) | 62 |
0.001 (0.411) |
4.01e-05 (0.0166) |
0.68 (1.00) |
0.0253 (1.00) |
0.0139 (1.00) |
1 (1.00) |
| amp 1p36 21 | 91 (16%) | 469 |
0.0599 (1.00) |
0.241 (1.00) |
0.482 (1.00) |
0.376 (1.00) |
0.07 (1.00) |
0.902 (1.00) |
| amp 1q32 1 | 155 (28%) | 405 |
0.491 (1.00) |
0.178 (1.00) |
1 (1.00) |
0.308 (1.00) |
1 (1.00) |
0.84 (1.00) |
| amp 1q44 | 97 (17%) | 463 |
0.399 (1.00) |
0.91 (1.00) |
0.304 (1.00) |
0.54 (1.00) |
0.153 (1.00) |
0.55 (1.00) |
| amp 2p24 3 | 48 (9%) | 512 |
0.263 (1.00) |
0.232 (1.00) |
0.356 (1.00) |
0.952 (1.00) |
1 (1.00) |
0.748 (1.00) |
| amp 3q26 33 | 108 (19%) | 452 |
0.235 (1.00) |
0.0133 (1.00) |
0.661 (1.00) |
0.804 (1.00) |
0.0045 (1.00) |
0.909 (1.00) |
| amp 4p16 3 | 48 (9%) | 512 |
0.837 (1.00) |
0.787 (1.00) |
0.356 (1.00) |
0.477 (1.00) |
1 (1.00) |
0.748 (1.00) |
| amp 4q12 | 105 (19%) | 455 |
0.401 (1.00) |
0.326 (1.00) |
0.376 (1.00) |
0.807 (1.00) |
0.331 (1.00) |
0.296 (1.00) |
| amp 8q24 21 | 70 (12%) | 490 |
0.331 (1.00) |
0.16 (1.00) |
0.516 (1.00) |
0.98 (1.00) |
1 (1.00) |
0.681 (1.00) |
| amp 11p13 | 29 (5%) | 531 |
0.947 (1.00) |
0.425 (1.00) |
0.847 (1.00) |
0.724 (1.00) |
0.846 (1.00) |
1 (1.00) |
| amp 12p13 32 | 82 (15%) | 478 |
0.78 (1.00) |
0.0864 (1.00) |
1 (1.00) |
0.897 (1.00) |
0.742 (1.00) |
0.521 (1.00) |
| amp 12q14 1 | 131 (23%) | 429 |
0.426 (1.00) |
0.494 (1.00) |
0.359 (1.00) |
0.807 (1.00) |
0.488 (1.00) |
0.749 (1.00) |
| amp 12q15 | 91 (16%) | 469 |
0.954 (1.00) |
0.638 (1.00) |
0.413 (1.00) |
0.798 (1.00) |
0.875 (1.00) |
0.462 (1.00) |
| amp 13q34 | 32 (6%) | 528 |
0.84 (1.00) |
0.715 (1.00) |
0.36 (1.00) |
0.82 (1.00) |
0.462 (1.00) |
0.701 (1.00) |
| amp 13q34 | 29 (5%) | 531 |
0.681 (1.00) |
0.664 (1.00) |
0.698 (1.00) |
0.659 (1.00) |
0.846 (1.00) |
0.687 (1.00) |
| amp 14q32 33 | 36 (6%) | 524 |
0.466 (1.00) |
0.0217 (1.00) |
0.486 (1.00) |
0.289 (1.00) |
0.229 (1.00) |
1 (1.00) |
| amp 17p13 2 | 50 (9%) | 510 |
0.681 (1.00) |
0.833 (1.00) |
0.175 (1.00) |
0.742 (1.00) |
0.346 (1.00) |
0.526 (1.00) |
| amp 17q25 1 | 81 (14%) | 479 |
0.031 (1.00) |
0.0146 (1.00) |
0.176 (1.00) |
0.629 (1.00) |
0.86 (1.00) |
0.606 (1.00) |
| amp 19p13 3 | 236 (42%) | 324 |
0.164 (1.00) |
0.956 (1.00) |
1 (1.00) |
0.197 (1.00) |
0.527 (1.00) |
0.927 (1.00) |
| amp 19p13 2 | 241 (43%) | 319 |
0.129 (1.00) |
0.495 (1.00) |
0.931 (1.00) |
0.501 (1.00) |
0.471 (1.00) |
1 (1.00) |
| amp 19q12 | 209 (37%) | 351 |
0.293 (1.00) |
0.327 (1.00) |
0.655 (1.00) |
0.986 (1.00) |
0.574 (1.00) |
0.851 (1.00) |
| amp 21q21 1 | 68 (12%) | 492 |
0.561 (1.00) |
0.0103 (1.00) |
1 (1.00) |
0.305 (1.00) |
0.0645 (1.00) |
0.404 (1.00) |
| del 1p36 32 | 96 (17%) | 464 |
0.853 (1.00) |
0.689 (1.00) |
0.029 (1.00) |
0.912 (1.00) |
0.429 (1.00) |
1 (1.00) |
| del 1p36 23 | 130 (23%) | 430 |
0.581 (1.00) |
0.0479 (1.00) |
0.00771 (1.00) |
0.476 (1.00) |
0.197 (1.00) |
0.391 (1.00) |
| del 1p32 3 | 60 (11%) | 500 |
0.626 (1.00) |
0.0418 (1.00) |
0.126 (1.00) |
0.584 (1.00) |
1 (1.00) |
0.106 (1.00) |
| del 1p22 1 | 47 (8%) | 513 |
0.574 (1.00) |
0.249 (1.00) |
1 (1.00) |
0.614 (1.00) |
0.114 (1.00) |
0.624 (1.00) |
| del 1q42 11 | 48 (9%) | 512 |
0.106 (1.00) |
0.113 (1.00) |
0.878 (1.00) |
0.0266 (1.00) |
0.786 (1.00) |
0.144 (1.00) |
| del 1q44 | 34 (6%) | 526 |
0.511 (1.00) |
0.394 (1.00) |
1 (1.00) |
0.15 (1.00) |
0.417 (1.00) |
0.705 (1.00) |
| del 2q22 1 | 45 (8%) | 515 |
0.323 (1.00) |
0.176 (1.00) |
0.34 (1.00) |
0.629 (1.00) |
0.152 (1.00) |
0.0665 (1.00) |
| del 2q37 1 | 54 (10%) | 506 |
0.97 (1.00) |
0.434 (1.00) |
0.187 (1.00) |
0.558 (1.00) |
0.806 (1.00) |
0.282 (1.00) |
| del 3p21 1 | 52 (9%) | 508 |
0.0195 (1.00) |
0.0114 (1.00) |
0.882 (1.00) |
0.773 (1.00) |
0.24 (1.00) |
0.0427 (1.00) |
| del 3q13 31 | 58 (10%) | 502 |
0.537 (1.00) |
0.0909 (1.00) |
0.395 (1.00) |
0.286 (1.00) |
0.499 (1.00) |
0.372 (1.00) |
| del 3q22 1 | 58 (10%) | 502 |
0.642 (1.00) |
0.186 (1.00) |
1 (1.00) |
0.465 (1.00) |
0.499 (1.00) |
0.766 (1.00) |
| del 3q29 | 65 (12%) | 495 |
0.268 (1.00) |
0.24 (1.00) |
1 (1.00) |
0.369 (1.00) |
0.575 (1.00) |
0.325 (1.00) |
| del 4p16 3 | 76 (14%) | 484 |
0.396 (1.00) |
0.0501 (1.00) |
0.256 (1.00) |
0.199 (1.00) |
0.524 (1.00) |
0.113 (1.00) |
| del 4q34 3 | 89 (16%) | 471 |
0.126 (1.00) |
0.122 (1.00) |
0.0339 (1.00) |
0.691 (1.00) |
0.936 (1.00) |
0.137 (1.00) |
| del 5q35 3 | 52 (9%) | 508 |
0.0381 (1.00) |
0.107 (1.00) |
1 (1.00) |
0.666 (1.00) |
1 (1.00) |
0.348 (1.00) |
| del 6q22 31 | 156 (28%) | 404 |
0.0423 (1.00) |
0.213 (1.00) |
0.101 (1.00) |
0.499 (1.00) |
0.5 (1.00) |
1 (1.00) |
| del 6q26 | 177 (32%) | 383 |
0.0817 (1.00) |
0.947 (1.00) |
0.264 (1.00) |
0.87 (1.00) |
0.228 (1.00) |
0.846 (1.00) |
| del 8p23 2 | 65 (12%) | 495 |
0.245 (1.00) |
0.0334 (1.00) |
0.348 (1.00) |
0.519 (1.00) |
0.835 (1.00) |
0.674 (1.00) |
| del 9q34 2 | 76 (14%) | 484 |
0.767 (1.00) |
0.763 (1.00) |
1 (1.00) |
0.599 (1.00) |
0.102 (1.00) |
0.691 (1.00) |
| del 11p15 5 | 127 (23%) | 433 |
0.0213 (1.00) |
0.00214 (0.871) |
0.216 (1.00) |
0.122 (1.00) |
0.478 (1.00) |
0.829 (1.00) |
| del 11p11 2 | 103 (18%) | 457 |
0.0782 (1.00) |
0.45 (1.00) |
0.221 (1.00) |
0.477 (1.00) |
0.246 (1.00) |
0.815 (1.00) |
| del 11q14 1 | 95 (17%) | 465 |
0.971 (1.00) |
0.869 (1.00) |
0.3 (1.00) |
0.86 (1.00) |
0.369 (1.00) |
0.116 (1.00) |
| del 12p13 1 | 71 (13%) | 489 |
0.104 (1.00) |
0.611 (1.00) |
0.437 (1.00) |
0.419 (1.00) |
0.602 (1.00) |
0.413 (1.00) |
| del 12q12 | 74 (13%) | 486 |
0.456 (1.00) |
0.834 (1.00) |
0.8 (1.00) |
0.846 (1.00) |
0.854 (1.00) |
0.505 (1.00) |
| del 12q15 | 76 (14%) | 484 |
0.56 (1.00) |
0.71 (1.00) |
0.45 (1.00) |
0.423 (1.00) |
0.921 (1.00) |
0.354 (1.00) |
| del 13q14 2 | 234 (42%) | 326 |
0.894 (1.00) |
0.507 (1.00) |
0.792 (1.00) |
0.853 (1.00) |
0.234 (1.00) |
0.646 (1.00) |
| del 14q13 1 | 174 (31%) | 386 |
0.563 (1.00) |
0.528 (1.00) |
0.113 (1.00) |
0.289 (1.00) |
0.808 (1.00) |
0.695 (1.00) |
| del 14q24 2 | 170 (30%) | 390 |
0.784 (1.00) |
0.316 (1.00) |
0.259 (1.00) |
0.654 (1.00) |
0.646 (1.00) |
0.622 (1.00) |
| del 15q14 | 147 (26%) | 413 |
0.24 (1.00) |
0.0285 (1.00) |
0.768 (1.00) |
0.573 (1.00) |
0.789 (1.00) |
0.41 (1.00) |
| del 16p12 2 | 92 (16%) | 468 |
0.0722 (1.00) |
0.215 (1.00) |
0.352 (1.00) |
1 (1.00) |
0.509 (1.00) |
0.392 (1.00) |
| del 16q23 3 | 95 (17%) | 465 |
0.0363 (1.00) |
0.832 (1.00) |
0.565 (1.00) |
0.121 (1.00) |
0.877 (1.00) |
0.011 (1.00) |
| del 17p13 2 | 82 (15%) | 478 |
0.711 (1.00) |
0.491 (1.00) |
0.271 (1.00) |
0.189 (1.00) |
0.742 (1.00) |
0.799 (1.00) |
| del 17p13 1 | 92 (16%) | 468 |
0.433 (1.00) |
0.159 (1.00) |
0.0796 (1.00) |
0.797 (1.00) |
0.584 (1.00) |
0.178 (1.00) |
| del 17q11 2 | 68 (12%) | 492 |
0.253 (1.00) |
0.505 (1.00) |
0.895 (1.00) |
0.257 (1.00) |
0.916 (1.00) |
0.0948 (1.00) |
| del 18q22 3 | 80 (14%) | 480 |
0.727 (1.00) |
0.581 (1.00) |
0.805 (1.00) |
0.113 (1.00) |
0.859 (1.00) |
0.698 (1.00) |
| del 19q13 41 | 98 (18%) | 462 |
0.0192 (1.00) |
0.236 (1.00) |
0.91 (1.00) |
0.407 (1.00) |
0.727 (1.00) |
1 (1.00) |
| del 21q22 11 | 46 (8%) | 514 |
0.899 (1.00) |
0.191 (1.00) |
0.756 (1.00) |
0.0892 (1.00) |
0.69 (1.00) |
0.321 (1.00) |
| del 22q13 32 | 210 (38%) | 350 |
0.973 (1.00) |
0.389 (1.00) |
0.789 (1.00) |
0.492 (1.00) |
0.624 (1.00) |
0.574 (1.00) |
| del xp22 2 | 115 (21%) | 445 |
0.219 (1.00) |
0.276 (1.00) |
0.831 (1.00) |
0.367 (1.00) |
0.946 (1.00) |
1 (1.00) |
| del xq23 | 106 (19%) | 454 |
0.176 (1.00) |
0.888 (1.00) |
0.659 (1.00) |
0.255 (1.00) |
0.788 (1.00) |
0.419 (1.00) |
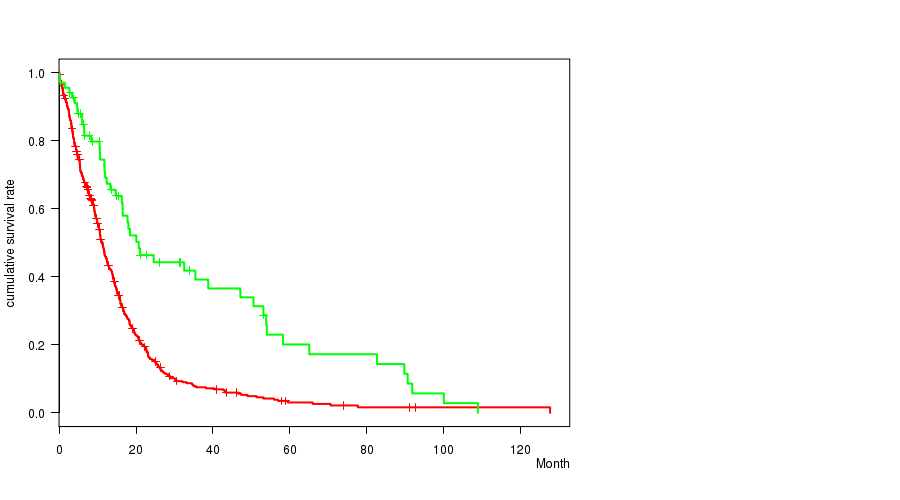
P value = 4.43e-07 (logrank test), Q value = 0.00019
Table S1. Gene #8: 'amp_7p11.2' versus Clinical Feature #1: 'Time to Death'
| nPatients | nDeath | Duration Range (Median), Month | |
|---|---|---|---|
| ALL | 560 | 458 | 0.1 - 127.6 (9.9) |
| AMP PEAK 8(7P11.2) MUTATED | 492 | 410 | 0.1 - 127.6 (9.4) |
| AMP PEAK 8(7P11.2) WILD-TYPE | 68 | 48 | 0.2 - 108.8 (15.1) |
Figure S1. Get High-res Image Gene #8: 'amp_7p11.2' versus Clinical Feature #1: 'Time to Death'
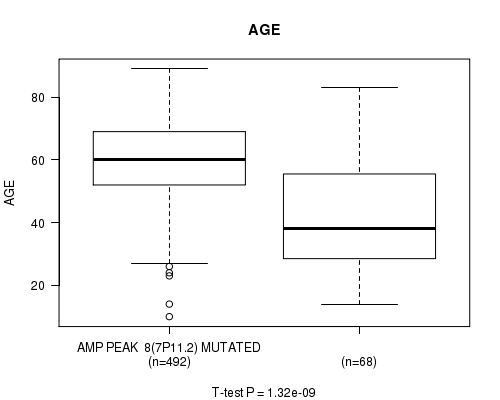
P value = 1.32e-09 (t-test), Q value = 5.6e-07
Table S2. Gene #8: 'amp_7p11.2' versus Clinical Feature #2: 'AGE'
| nPatients | Mean (Std.Dev) | |
|---|---|---|
| ALL | 560 | 57.9 (14.5) |
| AMP PEAK 8(7P11.2) MUTATED | 492 | 59.8 (12.5) |
| AMP PEAK 8(7P11.2) WILD-TYPE | 68 | 43.6 (18.8) |
Figure S2. Get High-res Image Gene #8: 'amp_7p11.2' versus Clinical Feature #2: 'AGE'
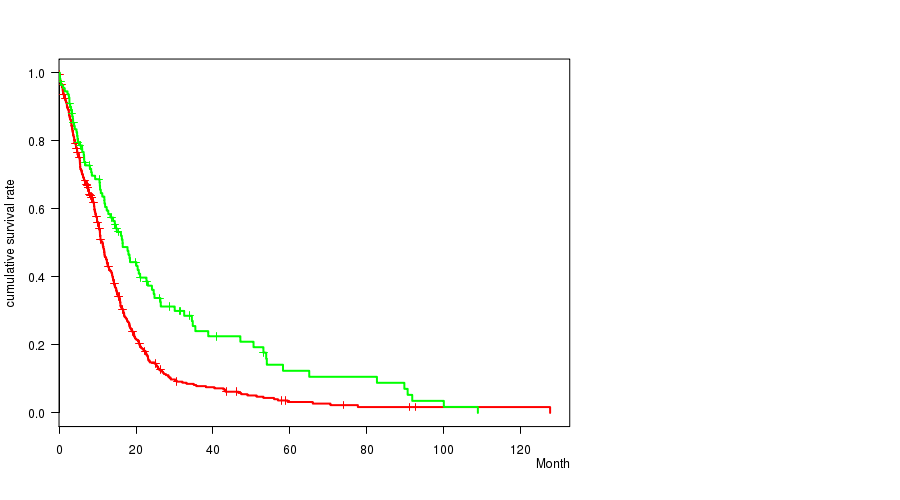
P value = 3.71e-05 (logrank test), Q value = 0.015
Table S3. Gene #9: 'amp_7q11.21' versus Clinical Feature #1: 'Time to Death'
| nPatients | nDeath | Duration Range (Median), Month | |
|---|---|---|---|
| ALL | 560 | 458 | 0.1 - 127.6 (9.9) |
| AMP PEAK 9(7Q11.21) MUTATED | 450 | 372 | 0.1 - 127.6 (9.4) |
| AMP PEAK 9(7Q11.21) WILD-TYPE | 110 | 86 | 0.2 - 108.8 (13.8) |
Figure S3. Get High-res Image Gene #9: 'amp_7q11.21' versus Clinical Feature #1: 'Time to Death'
P value = 1.26e-07 (t-test), Q value = 5.3e-05
Table S4. Gene #9: 'amp_7q11.21' versus Clinical Feature #2: 'AGE'
| nPatients | Mean (Std.Dev) | |
|---|---|---|
| ALL | 560 | 57.9 (14.5) |
| AMP PEAK 9(7Q11.21) MUTATED | 450 | 59.9 (12.5) |
| AMP PEAK 9(7Q11.21) WILD-TYPE | 110 | 49.5 (18.5) |
Figure S4. Get High-res Image Gene #9: 'amp_7q11.21' versus Clinical Feature #2: 'AGE'

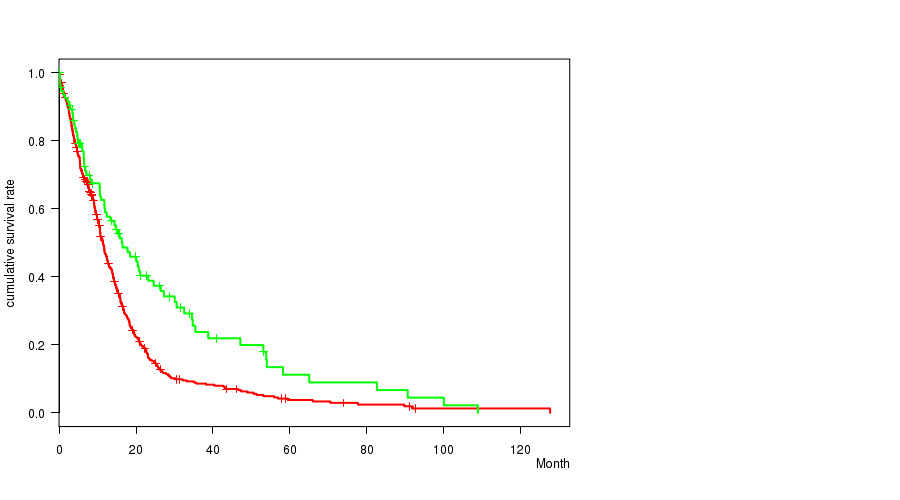
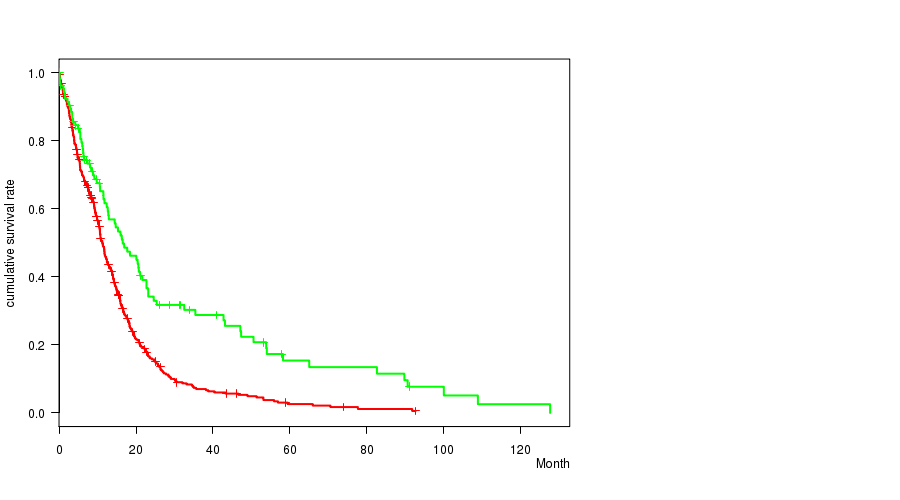
P value = 0.000285 (logrank test), Q value = 0.12
Table S5. Gene #10: 'amp_7q21.2' versus Clinical Feature #1: 'Time to Death'
| nPatients | nDeath | Duration Range (Median), Month | |
|---|---|---|---|
| ALL | 560 | 458 | 0.1 - 127.6 (9.9) |
| AMP PEAK 10(7Q21.2) MUTATED | 465 | 387 | 0.1 - 127.6 (9.7) |
| AMP PEAK 10(7Q21.2) WILD-TYPE | 95 | 71 | 0.1 - 108.8 (12.4) |
Figure S5. Get High-res Image Gene #10: 'amp_7q21.2' versus Clinical Feature #1: 'Time to Death'
P value = 8.73e-06 (t-test), Q value = 0.0036
Table S6. Gene #10: 'amp_7q21.2' versus Clinical Feature #2: 'AGE'
| nPatients | Mean (Std.Dev) | |
|---|---|---|
| ALL | 560 | 57.9 (14.5) |
| AMP PEAK 10(7Q21.2) MUTATED | 465 | 59.5 (12.5) |
| AMP PEAK 10(7Q21.2) WILD-TYPE | 95 | 49.7 (19.8) |
Figure S6. Get High-res Image Gene #10: 'amp_7q21.2' versus Clinical Feature #2: 'AGE'
P value = 0.000411 (t-test), Q value = 0.17
Table S7. Gene #11: 'amp_7q31.2' versus Clinical Feature #2: 'AGE'
| nPatients | Mean (Std.Dev) | |
|---|---|---|
| ALL | 560 | 57.9 (14.5) |
| AMP PEAK 11(7Q31.2) MUTATED | 458 | 59.2 (12.7) |
| AMP PEAK 11(7Q31.2) WILD-TYPE | 102 | 51.9 (19.5) |
Figure S7. Get High-res Image Gene #11: 'amp_7q31.2' versus Clinical Feature #2: 'AGE'
P value = 0.000265 (t-test), Q value = 0.11
Table S8. Gene #44: 'del_9p21.3' versus Clinical Feature #2: 'AGE'
| nPatients | Mean (Std.Dev) | |
|---|---|---|
| ALL | 560 | 57.9 (14.5) |
| DEL PEAK 19(9P21.3) MUTATED | 409 | 59.3 (13.7) |
| DEL PEAK 19(9P21.3) WILD-TYPE | 151 | 54.0 (15.7) |
Figure S8. Get High-res Image Gene #44: 'del_9p21.3' versus Clinical Feature #2: 'AGE'
P value = 3.1e-06 (logrank test), Q value = 0.0013
Table S9. Gene #46: 'del_10p15.3' versus Clinical Feature #1: 'Time to Death'
| nPatients | nDeath | Duration Range (Median), Month | |
|---|---|---|---|
| ALL | 560 | 458 | 0.1 - 127.6 (9.9) |
| DEL PEAK 21(10P15.3) MUTATED | 454 | 379 | 0.1 - 92.7 (9.8) |
| DEL PEAK 21(10P15.3) WILD-TYPE | 106 | 79 | 0.1 - 127.6 (11.7) |
Figure S9. Get High-res Image Gene #46: 'del_10p15.3' versus Clinical Feature #1: 'Time to Death'
P value = 5.74e-08 (t-test), Q value = 2.4e-05
Table S10. Gene #46: 'del_10p15.3' versus Clinical Feature #2: 'AGE'
| nPatients | Mean (Std.Dev) | |
|---|---|---|
| ALL | 560 | 57.9 (14.5) |
| DEL PEAK 21(10P15.3) MUTATED | 454 | 59.9 (12.5) |
| DEL PEAK 21(10P15.3) WILD-TYPE | 106 | 49.0 (18.5) |
Figure S10. Get High-res Image Gene #46: 'del_10p15.3' versus Clinical Feature #2: 'AGE'
P value = 2.19e-06 (logrank test), Q value = 0.00092
Table S11. Gene #47: 'del_10p13' versus Clinical Feature #1: 'Time to Death'
| nPatients | nDeath | Duration Range (Median), Month | |
|---|---|---|---|
| ALL | 560 | 458 | 0.1 - 127.6 (9.9) |
| DEL PEAK 22(10P13) MUTATED | 456 | 380 | 0.1 - 92.7 (9.9) |
| DEL PEAK 22(10P13) WILD-TYPE | 104 | 78 | 0.1 - 127.6 (11.5) |
Figure S11. Get High-res Image Gene #47: 'del_10p13' versus Clinical Feature #1: 'Time to Death'
P value = 2.66e-07 (t-test), Q value = 0.00011
Table S12. Gene #47: 'del_10p13' versus Clinical Feature #2: 'AGE'
| nPatients | Mean (Std.Dev) | |
|---|---|---|
| ALL | 560 | 57.9 (14.5) |
| DEL PEAK 22(10P13) MUTATED | 456 | 59.8 (12.4) |
| DEL PEAK 22(10P13) WILD-TYPE | 104 | 49.2 (19.0) |
Figure S12. Get High-res Image Gene #47: 'del_10p13' versus Clinical Feature #2: 'AGE'
P value = 9.8e-08 (logrank test), Q value = 4.1e-05
Table S13. Gene #48: 'del_10p11.23' versus Clinical Feature #1: 'Time to Death'
| nPatients | nDeath | Duration Range (Median), Month | |
|---|---|---|---|
| ALL | 560 | 458 | 0.1 - 127.6 (9.9) |
| DEL PEAK 23(10P11.23) MUTATED | 461 | 384 | 0.1 - 92.7 (9.7) |
| DEL PEAK 23(10P11.23) WILD-TYPE | 99 | 74 | 0.1 - 127.6 (12.9) |
Figure S13. Get High-res Image Gene #48: 'del_10p11.23' versus Clinical Feature #1: 'Time to Death'
P value = 6.65e-09 (t-test), Q value = 2.8e-06
Table S14. Gene #48: 'del_10p11.23' versus Clinical Feature #2: 'AGE'
| nPatients | Mean (Std.Dev) | |
|---|---|---|
| ALL | 560 | 57.9 (14.5) |
| DEL PEAK 23(10P11.23) MUTATED | 461 | 60.0 (12.3) |
| DEL PEAK 23(10P11.23) WILD-TYPE | 99 | 47.7 (18.8) |
Figure S14. Get High-res Image Gene #48: 'del_10p11.23' versus Clinical Feature #2: 'AGE'
P value = 1.5e-05 (logrank test), Q value = 0.0062
Table S15. Gene #49: 'del_10q23.31' versus Clinical Feature #1: 'Time to Death'
| nPatients | nDeath | Duration Range (Median), Month | |
|---|---|---|---|
| ALL | 560 | 458 | 0.1 - 127.6 (9.9) |
| DEL PEAK 24(10Q23.31) MUTATED | 497 | 412 | 0.1 - 127.6 (9.9) |
| DEL PEAK 24(10Q23.31) WILD-TYPE | 63 | 46 | 0.2 - 108.8 (12.7) |
Figure S15. Get High-res Image Gene #49: 'del_10q23.31' versus Clinical Feature #1: 'Time to Death'
P value = 4.16e-06 (t-test), Q value = 0.0017
Table S16. Gene #49: 'del_10q23.31' versus Clinical Feature #2: 'AGE'
| nPatients | Mean (Std.Dev) | |
|---|---|---|
| ALL | 560 | 57.9 (14.5) |
| DEL PEAK 24(10Q23.31) MUTATED | 497 | 59.2 (13.3) |
| DEL PEAK 24(10Q23.31) WILD-TYPE | 63 | 47.2 (18.6) |
Figure S16. Get High-res Image Gene #49: 'del_10q23.31' versus Clinical Feature #2: 'AGE'
P value = 4.01e-05 (t-test), Q value = 0.017
Table S17. Gene #50: 'del_10q26.3' versus Clinical Feature #2: 'AGE'
| nPatients | Mean (Std.Dev) | |
|---|---|---|
| ALL | 560 | 57.9 (14.5) |
| DEL PEAK 25(10Q26.3) MUTATED | 498 | 59.1 (13.4) |
| DEL PEAK 25(10Q26.3) WILD-TYPE | 62 | 48.3 (18.7) |
Figure S17. Get High-res Image Gene #50: 'del_10q26.3' versus Clinical Feature #2: 'AGE'
-
Copy number data file = transformed.cor.cli.txt
-
Clinical data file = GBM-TP.merged_data.txt
-
Number of patients = 560
-
Number of significantly focal cnvs = 71
-
Number of selected clinical features = 6
-
Exclude genes that fewer than K tumors have mutations, K = 3
For survival clinical features, the Kaplan-Meier survival curves of tumors with and without gene mutations were plotted and the statistical significance P values were estimated by logrank test (Bland and Altman 2004) using the 'survdiff' function in R
For continuous numerical clinical features, two-tailed Student's t test with unequal variance (Lehmann and Romano 2005) was applied to compare the clinical values between tumors with and without gene mutations using 't.test' function in R
For binary or multi-class clinical features (nominal or ordinal), two-tailed Fisher's exact tests (Fisher 1922) were used to estimate the P values using the 'fisher.test' function in R
For multiple hypothesis correction, Q value is the False Discovery Rate (FDR) analogue of the P value (Benjamini and Hochberg 1995), defined as the minimum FDR at which the test may be called significant. We used the 'Benjamini and Hochberg' method of 'p.adjust' function in R to convert P values into Q values.
In addition to the links below, the full results of the analysis summarized in this report can also be downloaded programmatically using firehose_get, or interactively from either the Broad GDAC website or TCGA Data Coordination Center Portal.