This pipeline computes the correlation between cancer subtypes identified by different molecular patterns and selected clinical features.
Testing the association between subtypes identified by 10 different clustering approaches and 6 clinical features across 581 patients, 2 significant findings detected with P value < 0.05 and Q value < 0.25.
-
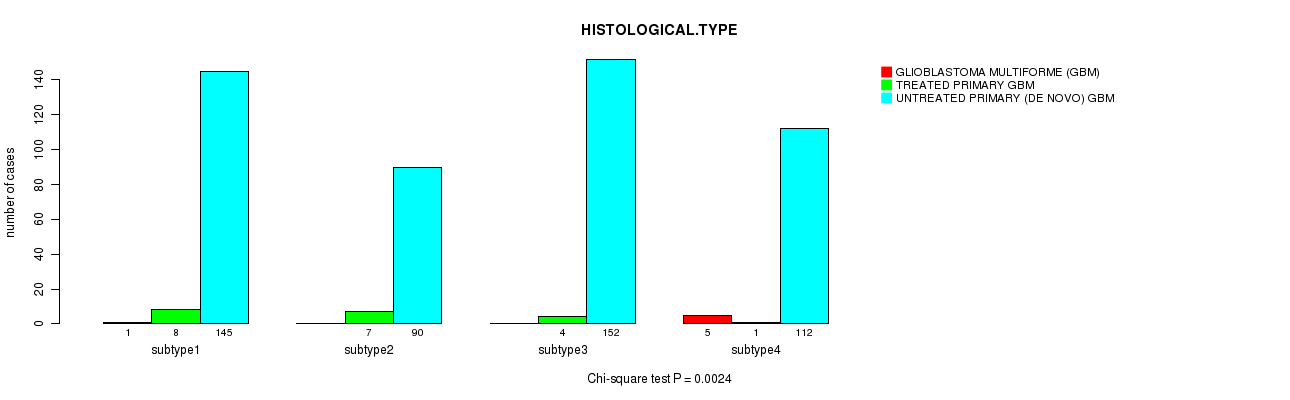
CNMF clustering analysis on array-based mRNA expression data identified 4 subtypes that correlate to 'HISTOLOGICAL.TYPE'.
-
Consensus hierarchical clustering analysis on array-based mRNA expression data identified 3 subtypes that do not correlate to any clinical features.
-
CNMF clustering analysis on array-based miR expression data identified 4 subtypes that do not correlate to any clinical features.
-
Consensus hierarchical clustering analysis on array-based miR expression data identified 3 subtypes that do not correlate to any clinical features.
-
3 subtypes identified in current cancer cohort by 'Copy Number Ratio CNMF subtypes'. These subtypes correlate to 'AGE'.
-
3 subtypes identified in current cancer cohort by 'METHLYATION CNMF'. These subtypes do not correlate to any clinical features.
-
CNMF clustering analysis on RPPA data identified 4 subtypes that do not correlate to any clinical features.
-
Consensus hierarchical clustering analysis on RPPA data identified 3 subtypes that do not correlate to any clinical features.
-
CNMF clustering analysis on sequencing-based mRNA expression data identified 3 subtypes that do not correlate to any clinical features.
-
Consensus hierarchical clustering analysis on sequencing-based mRNA expression data identified 3 subtypes that do not correlate to any clinical features.
Table 1. Get Full Table Overview of the association between subtypes identified by 10 different clustering approaches and 6 clinical features. Shown in the table are P values (Q values). Thresholded by P value < 0.05 and Q value < 0.25, 2 significant findings detected.
|
Clinical Features |
Time to Death |
AGE | GENDER |
KARNOFSKY PERFORMANCE SCORE |
HISTOLOGICAL TYPE |
RADIATIONS RADIATION REGIMENINDICATION |
| Statistical Tests | logrank test | ANOVA | Fisher's exact test | ANOVA | Chi-square test | Fisher's exact test |
| mRNA CNMF subtypes |
0.0511 (1.00) |
0.013 (0.729) |
0.399 (1.00) |
0.807 (1.00) |
0.0024 (0.142) |
0.0689 (1.00) |
| mRNA cHierClus subtypes |
0.117 (1.00) |
0.0808 (1.00) |
0.611 (1.00) |
0.75 (1.00) |
0.0746 (1.00) |
0.182 (1.00) |
| miR CNMF subtypes |
0.00499 (0.284) |
0.0653 (1.00) |
0.65 (1.00) |
0.794 (1.00) |
0.401 (1.00) |
0.417 (1.00) |
| miR cHierClus subtypes |
0.378 (1.00) |
0.0602 (1.00) |
0.0275 (1.00) |
0.981 (1.00) |
0.0401 (1.00) |
0.909 (1.00) |
| Copy Number Ratio CNMF subtypes |
0.00445 (0.258) |
4.14e-08 (2.48e-06) |
0.271 (1.00) |
0.376 (1.00) |
0.155 (1.00) |
0.0987 (1.00) |
| METHLYATION CNMF |
0.379 (1.00) |
0.058 (1.00) |
0.517 (1.00) |
0.646 (1.00) |
0.571 (1.00) |
0.721 (1.00) |
| RPPA CNMF subtypes |
0.415 (1.00) |
0.205 (1.00) |
0.23 (1.00) |
0.386 (1.00) |
0.439 (1.00) |
0.301 (1.00) |
| RPPA cHierClus subtypes |
0.407 (1.00) |
0.516 (1.00) |
0.612 (1.00) |
0.639 (1.00) |
0.559 (1.00) |
0.568 (1.00) |
| RNAseq CNMF subtypes |
0.16 (1.00) |
0.0368 (1.00) |
0.0673 (1.00) |
0.576 (1.00) |
0.491 (1.00) |
0.833 (1.00) |
| RNAseq cHierClus subtypes |
0.71 (1.00) |
0.0255 (1.00) |
0.0877 (1.00) |
0.32 (1.00) |
0.115 (1.00) |
0.887 (1.00) |
Table S1. Description of clustering approach #1: 'mRNA CNMF subtypes'
| Cluster Labels | 1 | 2 | 3 | 4 |
|---|---|---|---|---|
| Number of samples | 154 | 97 | 156 | 118 |
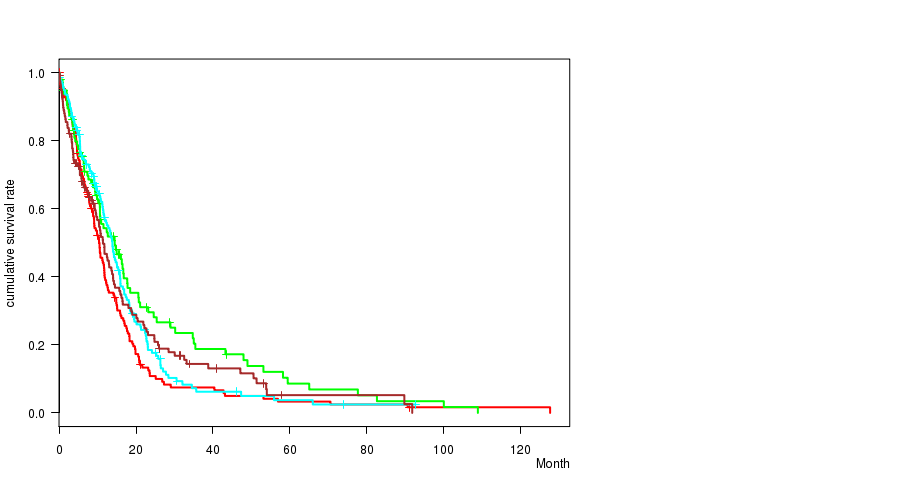
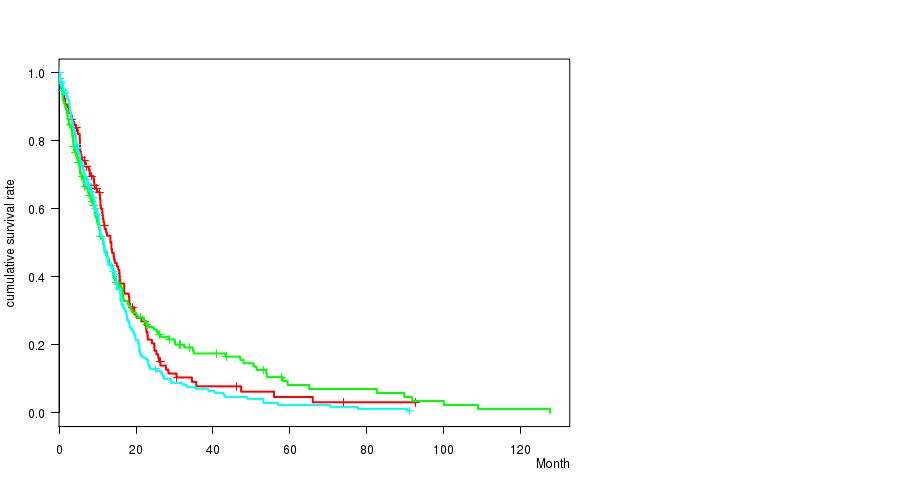
P value = 0.0511 (logrank test), Q value = 1
Table S2. Clustering Approach #1: 'mRNA CNMF subtypes' versus Clinical Feature #1: 'Time to Death'
| nPatients | nDeath | Duration Range (Median), Month | |
|---|---|---|---|
| ALL | 525 | 441 | 0.1 - 127.6 (10.4) |
| subtype1 | 154 | 138 | 0.1 - 127.6 (9.2) |
| subtype2 | 97 | 77 | 0.2 - 108.8 (10.6) |
| subtype3 | 156 | 127 | 0.1 - 92.7 (11.4) |
| subtype4 | 118 | 99 | 0.2 - 91.8 (9.8) |
Figure S1. Get High-res Image Clustering Approach #1: 'mRNA CNMF subtypes' versus Clinical Feature #1: 'Time to Death'
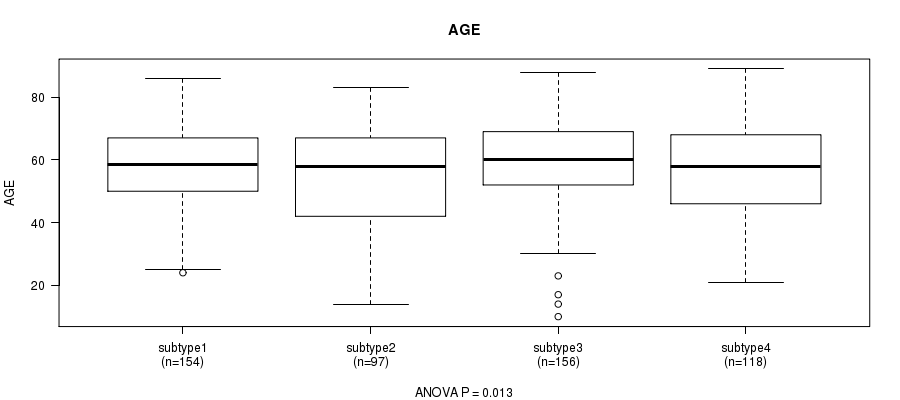
P value = 0.013 (ANOVA), Q value = 0.73
Table S3. Clustering Approach #1: 'mRNA CNMF subtypes' versus Clinical Feature #2: 'AGE'
| nPatients | Mean (Std.Dev) | |
|---|---|---|
| ALL | 525 | 57.7 (14.6) |
| subtype1 | 154 | 58.4 (12.4) |
| subtype2 | 97 | 54.2 (17.4) |
| subtype3 | 156 | 60.0 (13.3) |
| subtype4 | 118 | 56.5 (15.7) |
Figure S2. Get High-res Image Clustering Approach #1: 'mRNA CNMF subtypes' versus Clinical Feature #2: 'AGE'
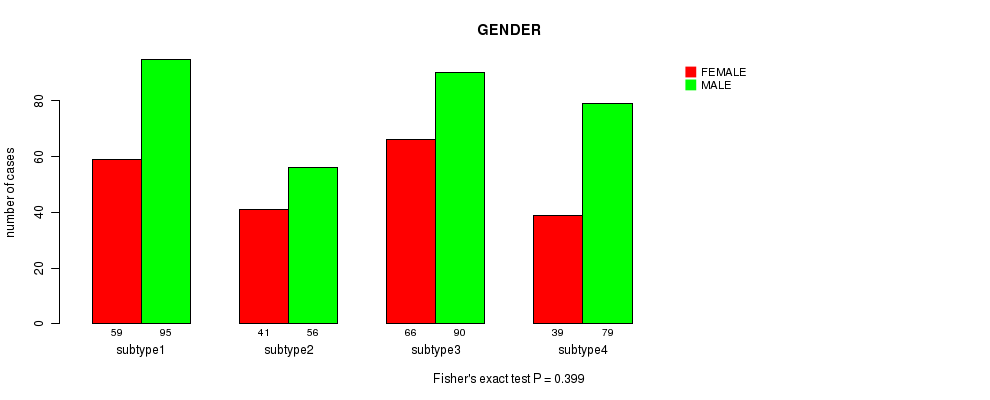
P value = 0.399 (Fisher's exact test), Q value = 1
Table S4. Clustering Approach #1: 'mRNA CNMF subtypes' versus Clinical Feature #3: 'GENDER'
| nPatients | FEMALE | MALE |
|---|---|---|
| ALL | 205 | 320 |
| subtype1 | 59 | 95 |
| subtype2 | 41 | 56 |
| subtype3 | 66 | 90 |
| subtype4 | 39 | 79 |
Figure S3. Get High-res Image Clustering Approach #1: 'mRNA CNMF subtypes' versus Clinical Feature #3: 'GENDER'
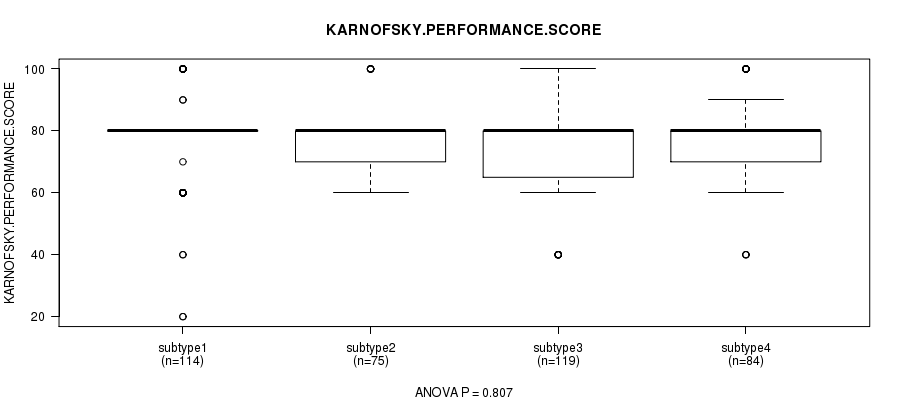
P value = 0.807 (ANOVA), Q value = 1
Table S5. Clustering Approach #1: 'mRNA CNMF subtypes' versus Clinical Feature #4: 'KARNOFSKY.PERFORMANCE.SCORE'
| nPatients | Mean (Std.Dev) | |
|---|---|---|
| ALL | 392 | 77.2 (14.4) |
| subtype1 | 114 | 78.0 (15.5) |
| subtype2 | 75 | 76.5 (11.0) |
| subtype3 | 119 | 76.5 (15.2) |
| subtype4 | 84 | 77.9 (14.5) |
Figure S4. Get High-res Image Clustering Approach #1: 'mRNA CNMF subtypes' versus Clinical Feature #4: 'KARNOFSKY.PERFORMANCE.SCORE'
P value = 0.0024 (Chi-square test), Q value = 0.14
Table S6. Clustering Approach #1: 'mRNA CNMF subtypes' versus Clinical Feature #5: 'HISTOLOGICAL.TYPE'
| nPatients | GLIOBLASTOMA MULTIFORME (GBM) | TREATED PRIMARY GBM | UNTREATED PRIMARY (DE NOVO) GBM |
|---|---|---|---|
| ALL | 6 | 20 | 499 |
| subtype1 | 1 | 8 | 145 |
| subtype2 | 0 | 7 | 90 |
| subtype3 | 0 | 4 | 152 |
| subtype4 | 5 | 1 | 112 |
Figure S5. Get High-res Image Clustering Approach #1: 'mRNA CNMF subtypes' versus Clinical Feature #5: 'HISTOLOGICAL.TYPE'
P value = 0.0689 (Fisher's exact test), Q value = 1
Table S7. Clustering Approach #1: 'mRNA CNMF subtypes' versus Clinical Feature #6: 'RADIATIONS.RADIATION.REGIMENINDICATION'
| nPatients | NO | YES |
|---|---|---|
| ALL | 360 | 165 |
| subtype1 | 106 | 48 |
| subtype2 | 68 | 29 |
| subtype3 | 116 | 40 |
| subtype4 | 70 | 48 |
Figure S6. Get High-res Image Clustering Approach #1: 'mRNA CNMF subtypes' versus Clinical Feature #6: 'RADIATIONS.RADIATION.REGIMENINDICATION'
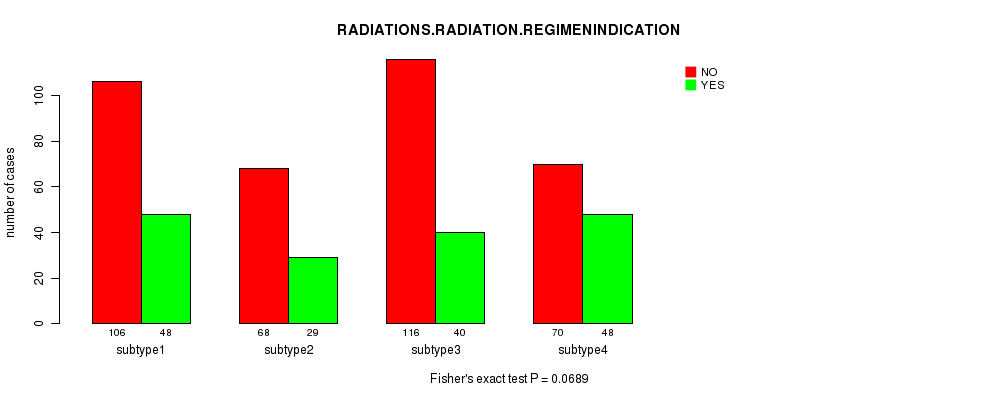
Table S8. Description of clustering approach #2: 'mRNA cHierClus subtypes'
| Cluster Labels | 1 | 2 | 3 |
|---|---|---|---|
| Number of samples | 119 | 177 | 229 |
P value = 0.117 (logrank test), Q value = 1
Table S9. Clustering Approach #2: 'mRNA cHierClus subtypes' versus Clinical Feature #1: 'Time to Death'
| nPatients | nDeath | Duration Range (Median), Month | |
|---|---|---|---|
| ALL | 525 | 441 | 0.1 - 127.6 (10.4) |
| subtype1 | 119 | 98 | 0.1 - 92.7 (11.3) |
| subtype2 | 177 | 147 | 0.2 - 127.6 (9.9) |
| subtype3 | 229 | 196 | 0.1 - 91.0 (10.0) |
Figure S7. Get High-res Image Clustering Approach #2: 'mRNA cHierClus subtypes' versus Clinical Feature #1: 'Time to Death'
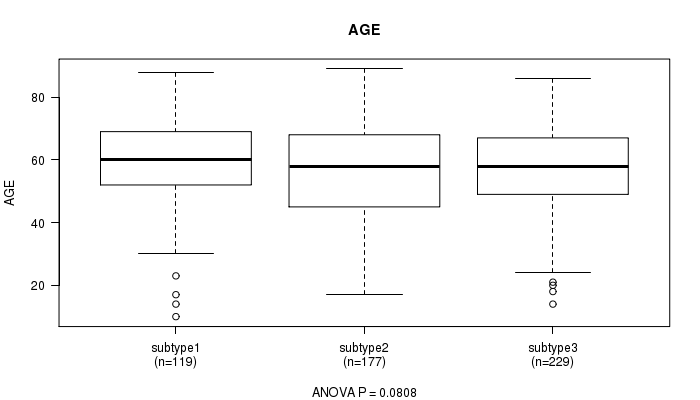
P value = 0.0808 (ANOVA), Q value = 1
Table S10. Clustering Approach #2: 'mRNA cHierClus subtypes' versus Clinical Feature #2: 'AGE'
| nPatients | Mean (Std.Dev) | |
|---|---|---|
| ALL | 525 | 57.7 (14.6) |
| subtype1 | 119 | 59.9 (13.8) |
| subtype2 | 177 | 56.0 (16.2) |
| subtype3 | 229 | 57.8 (13.5) |
Figure S8. Get High-res Image Clustering Approach #2: 'mRNA cHierClus subtypes' versus Clinical Feature #2: 'AGE'
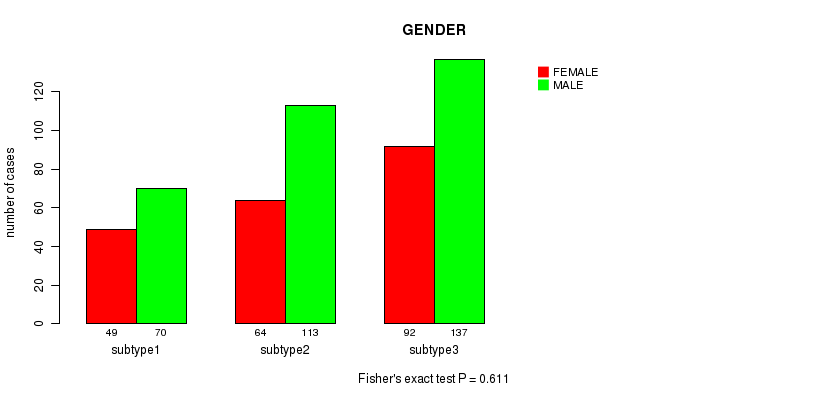
P value = 0.611 (Fisher's exact test), Q value = 1
Table S11. Clustering Approach #2: 'mRNA cHierClus subtypes' versus Clinical Feature #3: 'GENDER'
| nPatients | FEMALE | MALE |
|---|---|---|
| ALL | 205 | 320 |
| subtype1 | 49 | 70 |
| subtype2 | 64 | 113 |
| subtype3 | 92 | 137 |
Figure S9. Get High-res Image Clustering Approach #2: 'mRNA cHierClus subtypes' versus Clinical Feature #3: 'GENDER'
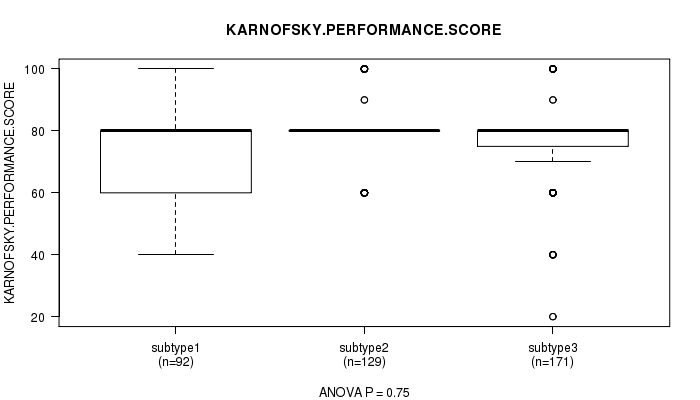
P value = 0.75 (ANOVA), Q value = 1
Table S12. Clustering Approach #2: 'mRNA cHierClus subtypes' versus Clinical Feature #4: 'KARNOFSKY.PERFORMANCE.SCORE'
| nPatients | Mean (Std.Dev) | |
|---|---|---|
| ALL | 392 | 77.2 (14.4) |
| subtype1 | 92 | 76.6 (15.9) |
| subtype2 | 129 | 78.0 (11.9) |
| subtype3 | 171 | 77.0 (15.2) |
Figure S10. Get High-res Image Clustering Approach #2: 'mRNA cHierClus subtypes' versus Clinical Feature #4: 'KARNOFSKY.PERFORMANCE.SCORE'
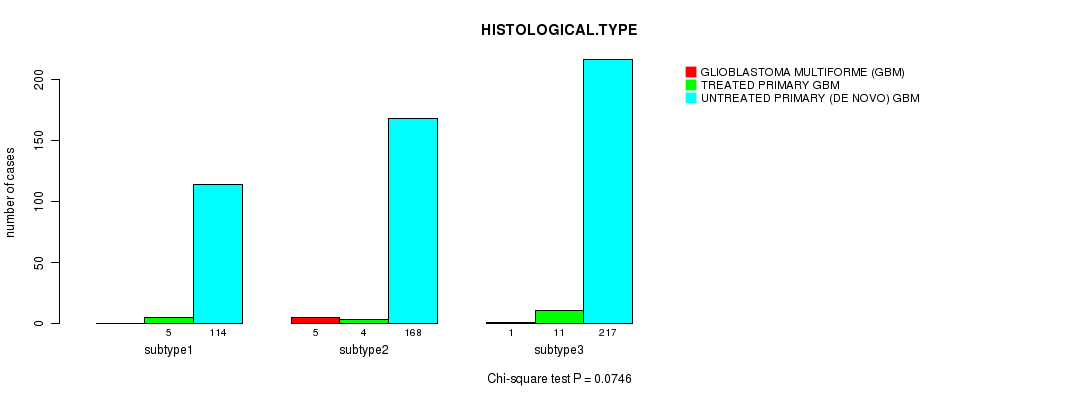
P value = 0.0746 (Chi-square test), Q value = 1
Table S13. Clustering Approach #2: 'mRNA cHierClus subtypes' versus Clinical Feature #5: 'HISTOLOGICAL.TYPE'
| nPatients | GLIOBLASTOMA MULTIFORME (GBM) | TREATED PRIMARY GBM | UNTREATED PRIMARY (DE NOVO) GBM |
|---|---|---|---|
| ALL | 6 | 20 | 499 |
| subtype1 | 0 | 5 | 114 |
| subtype2 | 5 | 4 | 168 |
| subtype3 | 1 | 11 | 217 |
Figure S11. Get High-res Image Clustering Approach #2: 'mRNA cHierClus subtypes' versus Clinical Feature #5: 'HISTOLOGICAL.TYPE'
P value = 0.182 (Fisher's exact test), Q value = 1
Table S14. Clustering Approach #2: 'mRNA cHierClus subtypes' versus Clinical Feature #6: 'RADIATIONS.RADIATION.REGIMENINDICATION'
| nPatients | NO | YES |
|---|---|---|
| ALL | 360 | 165 |
| subtype1 | 85 | 34 |
| subtype2 | 112 | 65 |
| subtype3 | 163 | 66 |
Figure S12. Get High-res Image Clustering Approach #2: 'mRNA cHierClus subtypes' versus Clinical Feature #6: 'RADIATIONS.RADIATION.REGIMENINDICATION'
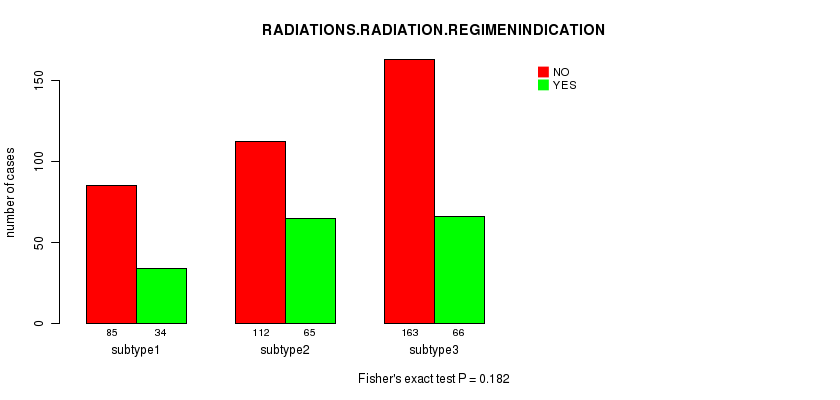
Table S15. Description of clustering approach #3: 'miR CNMF subtypes'
| Cluster Labels | 1 | 2 | 3 | 4 |
|---|---|---|---|---|
| Number of samples | 165 | 182 | 90 | 124 |
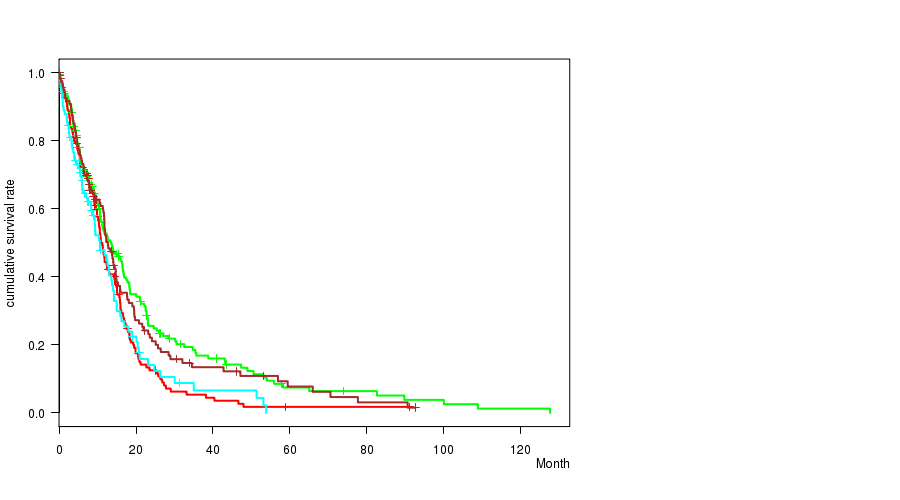
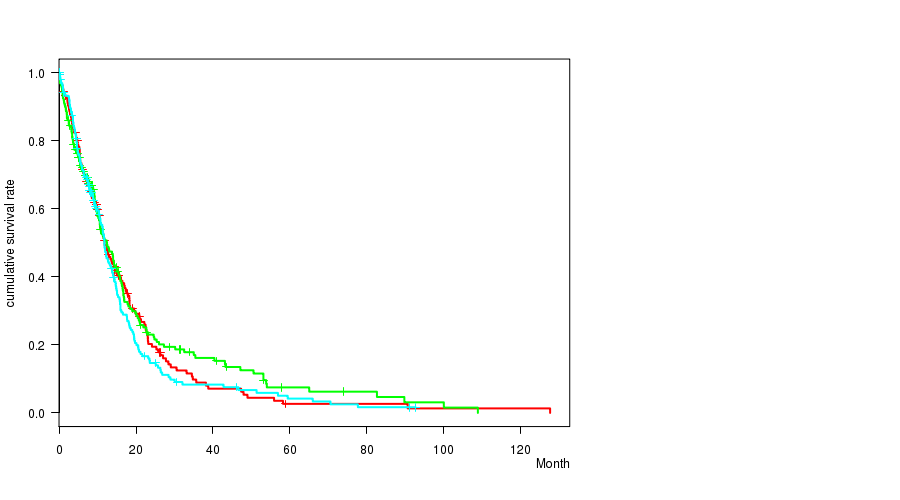
P value = 0.00499 (logrank test), Q value = 0.28
Table S16. Clustering Approach #3: 'miR CNMF subtypes' versus Clinical Feature #1: 'Time to Death'
| nPatients | nDeath | Duration Range (Median), Month | |
|---|---|---|---|
| ALL | 561 | 457 | 0.1 - 127.6 (10.0) |
| subtype1 | 165 | 139 | 0.1 - 91.0 (10.3) |
| subtype2 | 182 | 145 | 0.1 - 127.6 (10.4) |
| subtype3 | 90 | 72 | 0.1 - 53.8 (8.4) |
| subtype4 | 124 | 101 | 0.1 - 92.7 (11.6) |
Figure S13. Get High-res Image Clustering Approach #3: 'miR CNMF subtypes' versus Clinical Feature #1: 'Time to Death'
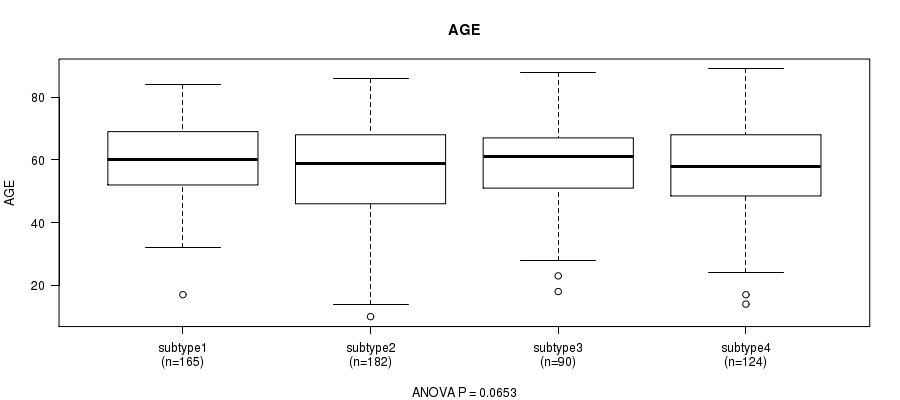
P value = 0.0653 (ANOVA), Q value = 1
Table S17. Clustering Approach #3: 'miR CNMF subtypes' versus Clinical Feature #2: 'AGE'
| nPatients | Mean (Std.Dev) | |
|---|---|---|
| ALL | 561 | 57.9 (14.3) |
| subtype1 | 165 | 59.8 (11.6) |
| subtype2 | 182 | 55.7 (16.6) |
| subtype3 | 90 | 58.5 (14.6) |
| subtype4 | 124 | 58.1 (13.6) |
Figure S14. Get High-res Image Clustering Approach #3: 'miR CNMF subtypes' versus Clinical Feature #2: 'AGE'
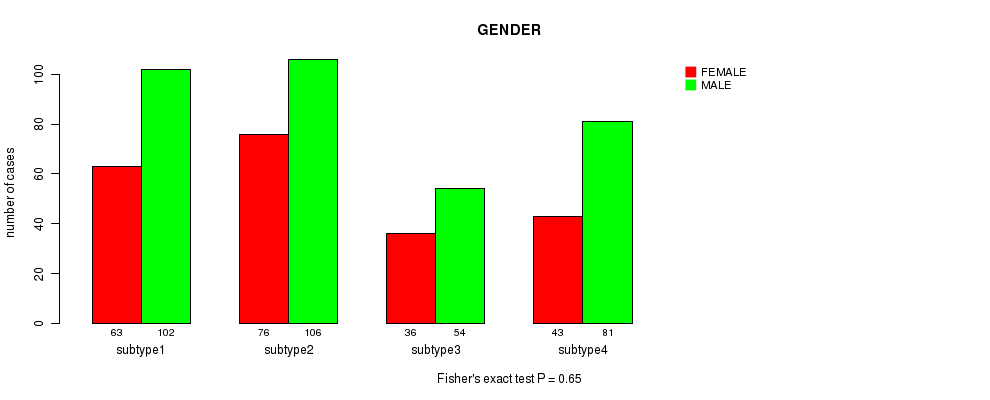
P value = 0.65 (Fisher's exact test), Q value = 1
Table S18. Clustering Approach #3: 'miR CNMF subtypes' versus Clinical Feature #3: 'GENDER'
| nPatients | FEMALE | MALE |
|---|---|---|
| ALL | 218 | 343 |
| subtype1 | 63 | 102 |
| subtype2 | 76 | 106 |
| subtype3 | 36 | 54 |
| subtype4 | 43 | 81 |
Figure S15. Get High-res Image Clustering Approach #3: 'miR CNMF subtypes' versus Clinical Feature #3: 'GENDER'
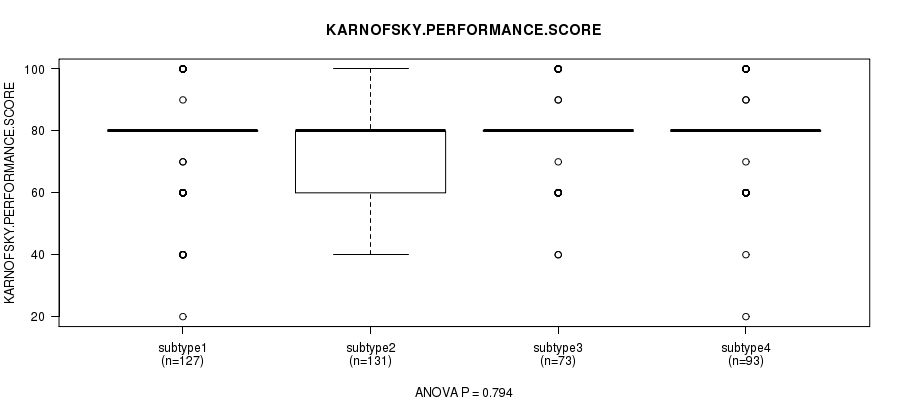
P value = 0.794 (ANOVA), Q value = 1
Table S19. Clustering Approach #3: 'miR CNMF subtypes' versus Clinical Feature #4: 'KARNOFSKY.PERFORMANCE.SCORE'
| nPatients | Mean (Std.Dev) | |
|---|---|---|
| ALL | 424 | 77.5 (14.5) |
| subtype1 | 127 | 76.6 (15.3) |
| subtype2 | 131 | 77.3 (14.6) |
| subtype3 | 73 | 78.2 (13.6) |
| subtype4 | 93 | 78.4 (14.2) |
Figure S16. Get High-res Image Clustering Approach #3: 'miR CNMF subtypes' versus Clinical Feature #4: 'KARNOFSKY.PERFORMANCE.SCORE'
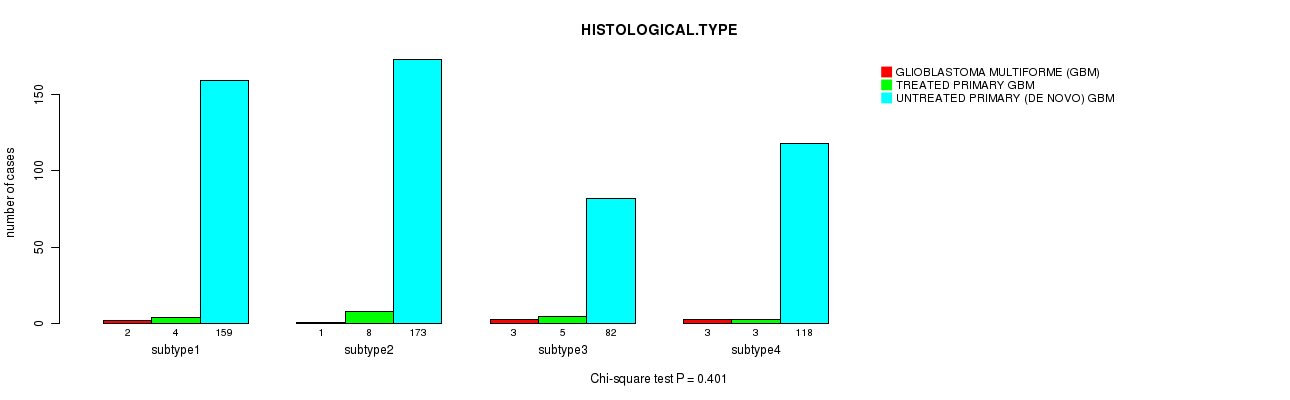
P value = 0.401 (Chi-square test), Q value = 1
Table S20. Clustering Approach #3: 'miR CNMF subtypes' versus Clinical Feature #5: 'HISTOLOGICAL.TYPE'
| nPatients | GLIOBLASTOMA MULTIFORME (GBM) | TREATED PRIMARY GBM | UNTREATED PRIMARY (DE NOVO) GBM |
|---|---|---|---|
| ALL | 9 | 20 | 532 |
| subtype1 | 2 | 4 | 159 |
| subtype2 | 1 | 8 | 173 |
| subtype3 | 3 | 5 | 82 |
| subtype4 | 3 | 3 | 118 |
Figure S17. Get High-res Image Clustering Approach #3: 'miR CNMF subtypes' versus Clinical Feature #5: 'HISTOLOGICAL.TYPE'
P value = 0.417 (Fisher's exact test), Q value = 1
Table S21. Clustering Approach #3: 'miR CNMF subtypes' versus Clinical Feature #6: 'RADIATIONS.RADIATION.REGIMENINDICATION'
| nPatients | NO | YES |
|---|---|---|
| ALL | 389 | 172 |
| subtype1 | 118 | 47 |
| subtype2 | 131 | 51 |
| subtype3 | 57 | 33 |
| subtype4 | 83 | 41 |
Figure S18. Get High-res Image Clustering Approach #3: 'miR CNMF subtypes' versus Clinical Feature #6: 'RADIATIONS.RADIATION.REGIMENINDICATION'
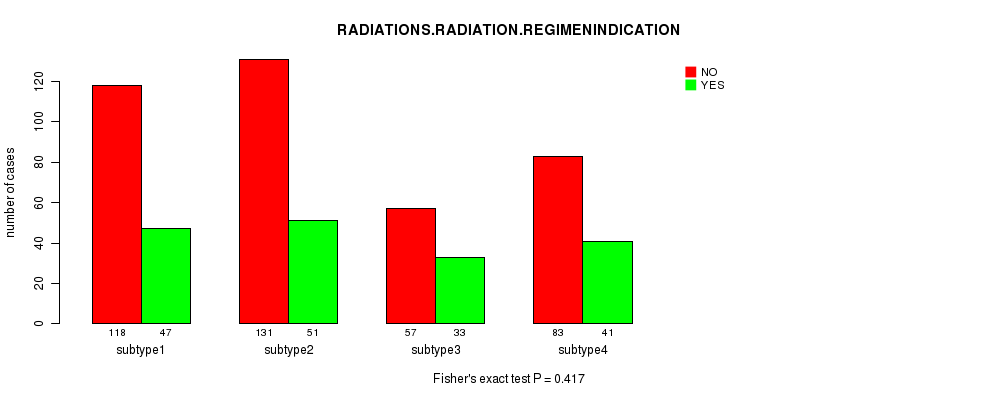
Table S22. Description of clustering approach #4: 'miR cHierClus subtypes'
| Cluster Labels | 1 | 2 | 3 |
|---|---|---|---|
| Number of samples | 178 | 188 | 195 |
P value = 0.378 (logrank test), Q value = 1
Table S23. Clustering Approach #4: 'miR cHierClus subtypes' versus Clinical Feature #1: 'Time to Death'
| nPatients | nDeath | Duration Range (Median), Month | |
|---|---|---|---|
| ALL | 561 | 457 | 0.1 - 127.6 (10.0) |
| subtype1 | 178 | 145 | 0.1 - 127.6 (10.4) |
| subtype2 | 188 | 149 | 0.1 - 108.8 (9.4) |
| subtype3 | 195 | 163 | 0.1 - 92.7 (10.3) |
Figure S19. Get High-res Image Clustering Approach #4: 'miR cHierClus subtypes' versus Clinical Feature #1: 'Time to Death'
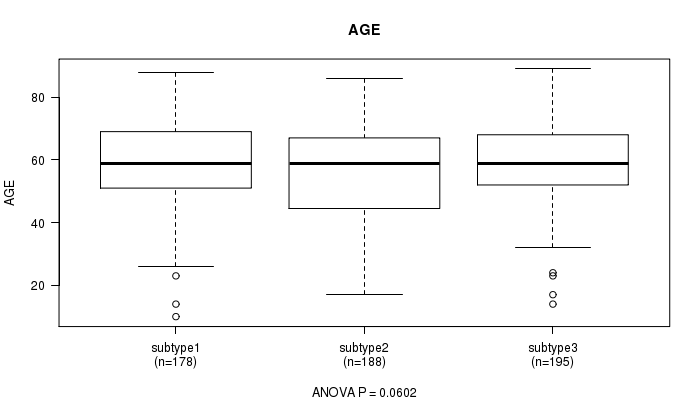
P value = 0.0602 (ANOVA), Q value = 1
Table S24. Clustering Approach #4: 'miR cHierClus subtypes' versus Clinical Feature #2: 'AGE'
| nPatients | Mean (Std.Dev) | |
|---|---|---|
| ALL | 561 | 57.9 (14.3) |
| subtype1 | 178 | 58.6 (13.5) |
| subtype2 | 188 | 55.9 (16.4) |
| subtype3 | 195 | 59.2 (12.7) |
Figure S20. Get High-res Image Clustering Approach #4: 'miR cHierClus subtypes' versus Clinical Feature #2: 'AGE'
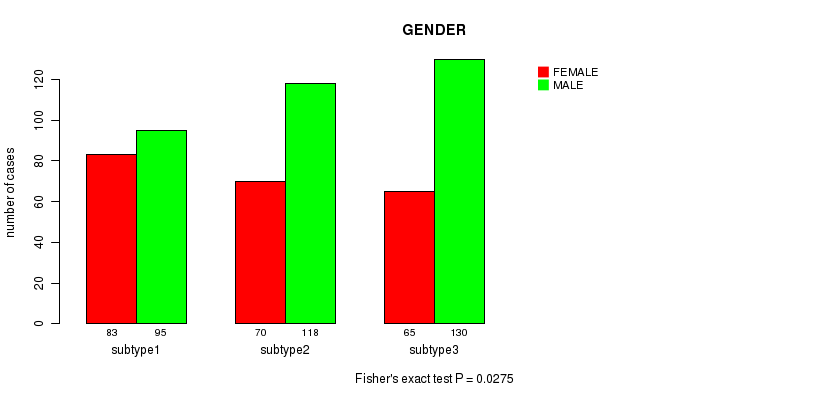
P value = 0.0275 (Fisher's exact test), Q value = 1
Table S25. Clustering Approach #4: 'miR cHierClus subtypes' versus Clinical Feature #3: 'GENDER'
| nPatients | FEMALE | MALE |
|---|---|---|
| ALL | 218 | 343 |
| subtype1 | 83 | 95 |
| subtype2 | 70 | 118 |
| subtype3 | 65 | 130 |
Figure S21. Get High-res Image Clustering Approach #4: 'miR cHierClus subtypes' versus Clinical Feature #3: 'GENDER'
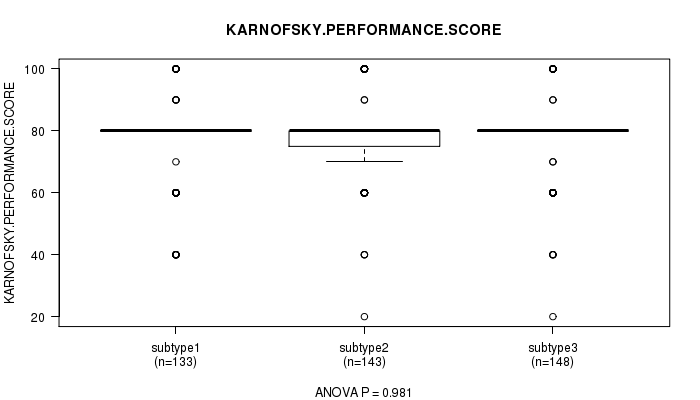
P value = 0.981 (ANOVA), Q value = 1
Table S26. Clustering Approach #4: 'miR cHierClus subtypes' versus Clinical Feature #4: 'KARNOFSKY.PERFORMANCE.SCORE'
| nPatients | Mean (Std.Dev) | |
|---|---|---|
| ALL | 424 | 77.5 (14.5) |
| subtype1 | 133 | 77.5 (15.5) |
| subtype2 | 143 | 77.6 (14.2) |
| subtype3 | 148 | 77.3 (14.0) |
Figure S22. Get High-res Image Clustering Approach #4: 'miR cHierClus subtypes' versus Clinical Feature #4: 'KARNOFSKY.PERFORMANCE.SCORE'
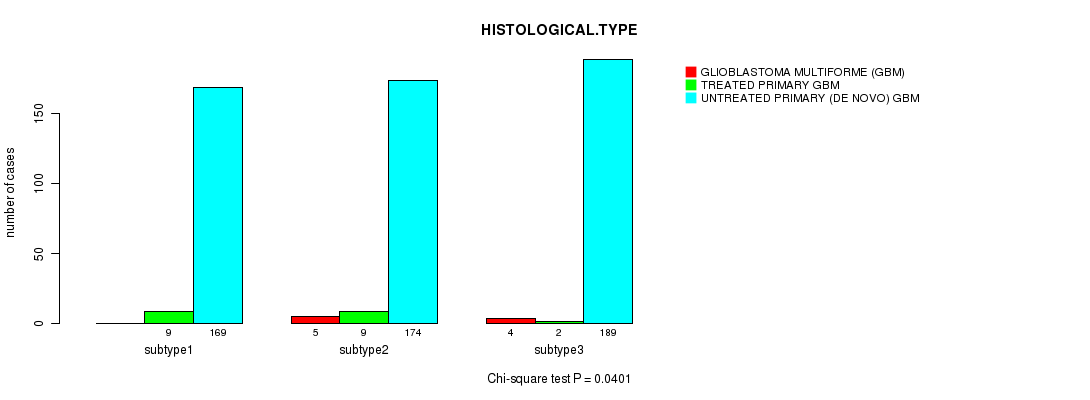
P value = 0.0401 (Chi-square test), Q value = 1
Table S27. Clustering Approach #4: 'miR cHierClus subtypes' versus Clinical Feature #5: 'HISTOLOGICAL.TYPE'
| nPatients | GLIOBLASTOMA MULTIFORME (GBM) | TREATED PRIMARY GBM | UNTREATED PRIMARY (DE NOVO) GBM |
|---|---|---|---|
| ALL | 9 | 20 | 532 |
| subtype1 | 0 | 9 | 169 |
| subtype2 | 5 | 9 | 174 |
| subtype3 | 4 | 2 | 189 |
Figure S23. Get High-res Image Clustering Approach #4: 'miR cHierClus subtypes' versus Clinical Feature #5: 'HISTOLOGICAL.TYPE'
P value = 0.909 (Fisher's exact test), Q value = 1
Table S28. Clustering Approach #4: 'miR cHierClus subtypes' versus Clinical Feature #6: 'RADIATIONS.RADIATION.REGIMENINDICATION'
| nPatients | NO | YES |
|---|---|---|
| ALL | 389 | 172 |
| subtype1 | 125 | 53 |
| subtype2 | 131 | 57 |
| subtype3 | 133 | 62 |
Figure S24. Get High-res Image Clustering Approach #4: 'miR cHierClus subtypes' versus Clinical Feature #6: 'RADIATIONS.RADIATION.REGIMENINDICATION'
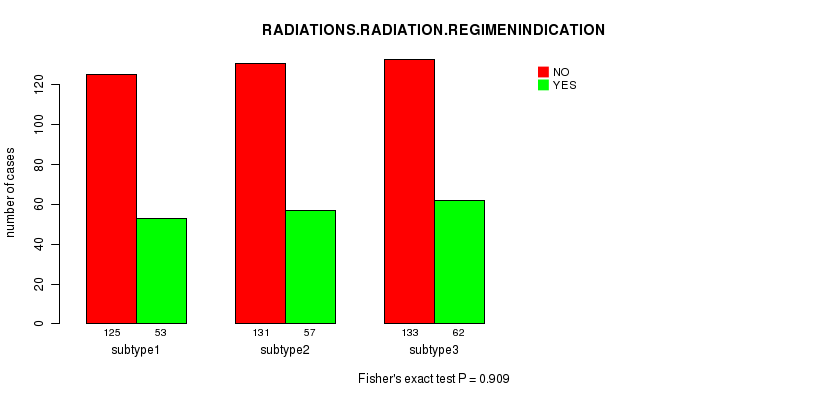
Table S29. Description of clustering approach #5: 'Copy Number Ratio CNMF subtypes'
| Cluster Labels | 1 | 2 | 3 |
|---|---|---|---|
| Number of samples | 158 | 208 | 194 |
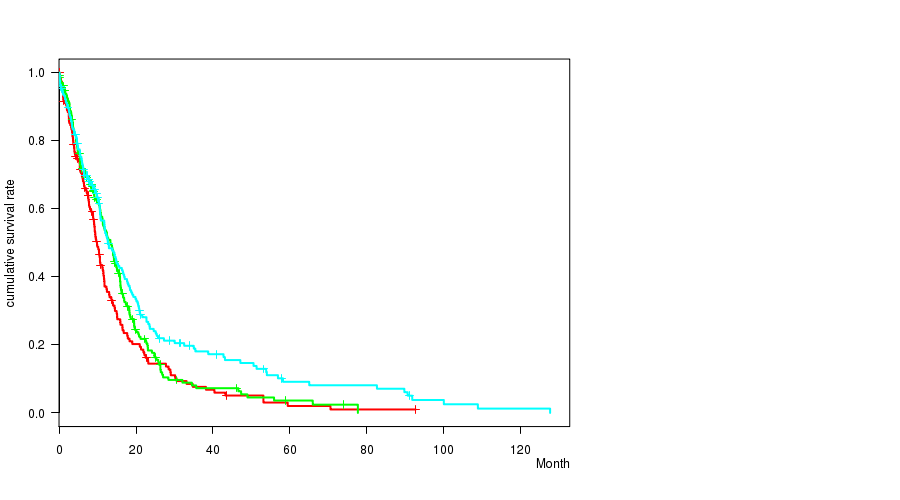
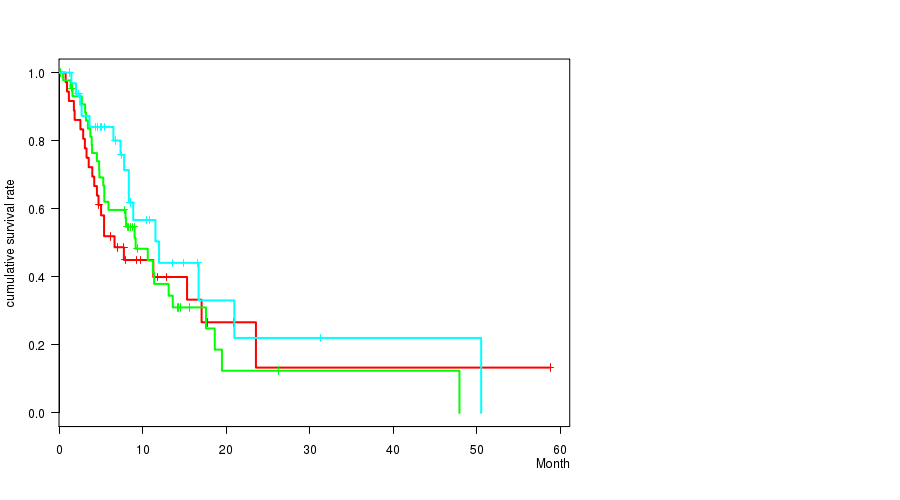
P value = 0.00445 (logrank test), Q value = 0.26
Table S30. Clustering Approach #5: 'Copy Number Ratio CNMF subtypes' versus Clinical Feature #1: 'Time to Death'
| nPatients | nDeath | Duration Range (Median), Month | |
|---|---|---|---|
| ALL | 560 | 458 | 0.1 - 127.6 (9.9) |
| subtype1 | 158 | 134 | 0.1 - 92.7 (8.9) |
| subtype2 | 208 | 169 | 0.1 - 77.7 (10.8) |
| subtype3 | 194 | 155 | 0.2 - 127.6 (10.6) |
Figure S25. Get High-res Image Clustering Approach #5: 'Copy Number Ratio CNMF subtypes' versus Clinical Feature #1: 'Time to Death'
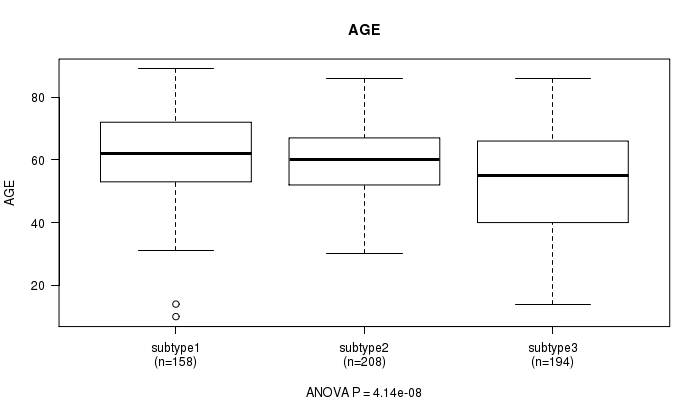
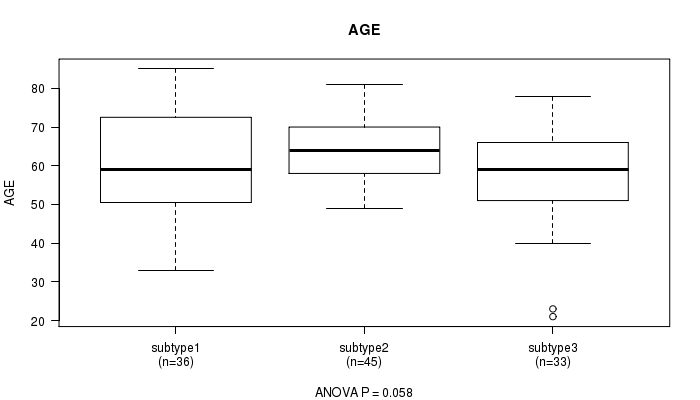
P value = 4.14e-08 (ANOVA), Q value = 2.5e-06
Table S31. Clustering Approach #5: 'Copy Number Ratio CNMF subtypes' versus Clinical Feature #2: 'AGE'
| nPatients | Mean (Std.Dev) | |
|---|---|---|
| ALL | 560 | 57.9 (14.5) |
| subtype1 | 158 | 61.1 (13.7) |
| subtype2 | 208 | 59.9 (10.8) |
| subtype3 | 194 | 53.1 (17.1) |
Figure S26. Get High-res Image Clustering Approach #5: 'Copy Number Ratio CNMF subtypes' versus Clinical Feature #2: 'AGE'
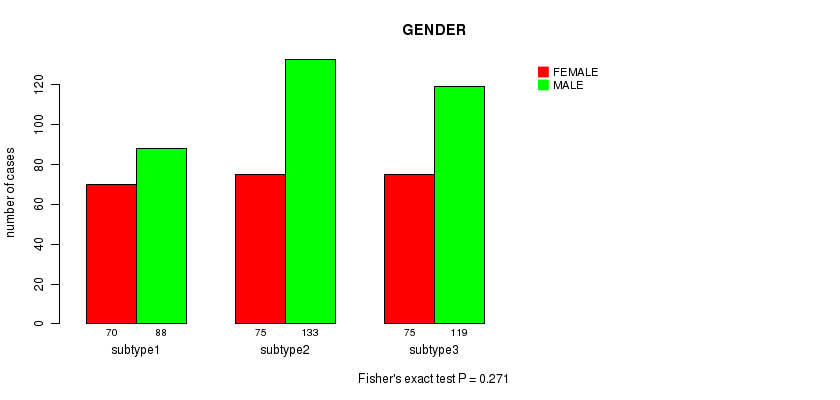
P value = 0.271 (Fisher's exact test), Q value = 1
Table S32. Clustering Approach #5: 'Copy Number Ratio CNMF subtypes' versus Clinical Feature #3: 'GENDER'
| nPatients | FEMALE | MALE |
|---|---|---|
| ALL | 220 | 340 |
| subtype1 | 70 | 88 |
| subtype2 | 75 | 133 |
| subtype3 | 75 | 119 |
Figure S27. Get High-res Image Clustering Approach #5: 'Copy Number Ratio CNMF subtypes' versus Clinical Feature #3: 'GENDER'
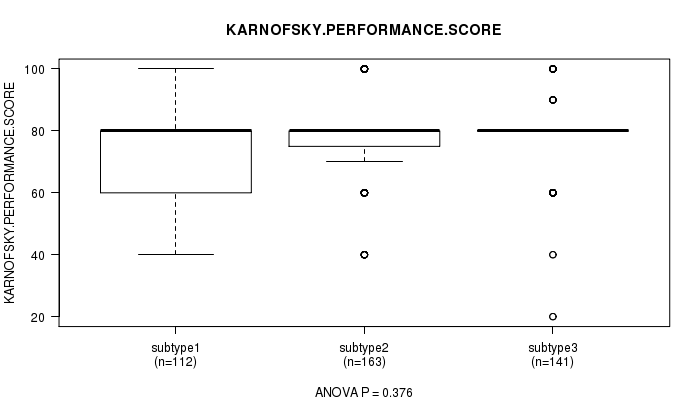
P value = 0.376 (ANOVA), Q value = 1
Table S33. Clustering Approach #5: 'Copy Number Ratio CNMF subtypes' versus Clinical Feature #4: 'KARNOFSKY.PERFORMANCE.SCORE'
| nPatients | Mean (Std.Dev) | |
|---|---|---|
| ALL | 416 | 77.5 (14.7) |
| subtype1 | 112 | 76.0 (14.7) |
| subtype2 | 163 | 77.6 (15.4) |
| subtype3 | 141 | 78.6 (13.9) |
Figure S28. Get High-res Image Clustering Approach #5: 'Copy Number Ratio CNMF subtypes' versus Clinical Feature #4: 'KARNOFSKY.PERFORMANCE.SCORE'
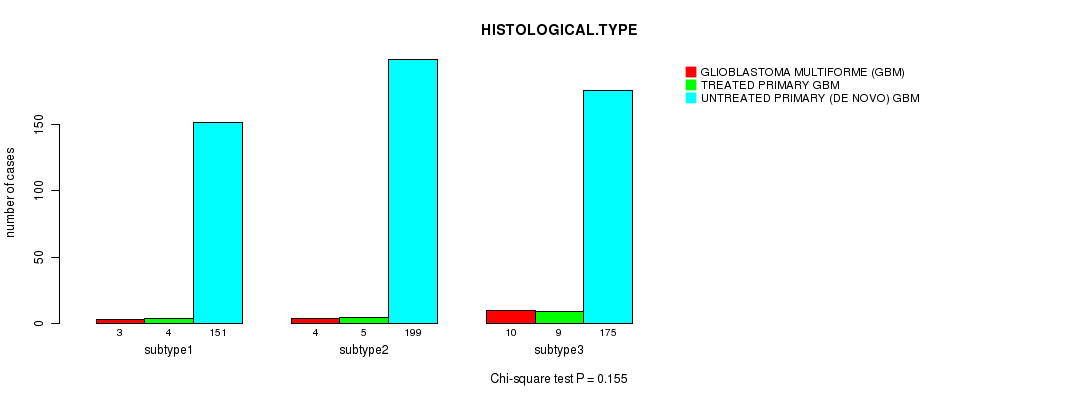
P value = 0.155 (Chi-square test), Q value = 1
Table S34. Clustering Approach #5: 'Copy Number Ratio CNMF subtypes' versus Clinical Feature #5: 'HISTOLOGICAL.TYPE'
| nPatients | GLIOBLASTOMA MULTIFORME (GBM) | TREATED PRIMARY GBM | UNTREATED PRIMARY (DE NOVO) GBM |
|---|---|---|---|
| ALL | 17 | 18 | 525 |
| subtype1 | 3 | 4 | 151 |
| subtype2 | 4 | 5 | 199 |
| subtype3 | 10 | 9 | 175 |
Figure S29. Get High-res Image Clustering Approach #5: 'Copy Number Ratio CNMF subtypes' versus Clinical Feature #5: 'HISTOLOGICAL.TYPE'
P value = 0.0987 (Fisher's exact test), Q value = 1
Table S35. Clustering Approach #5: 'Copy Number Ratio CNMF subtypes' versus Clinical Feature #6: 'RADIATIONS.RADIATION.REGIMENINDICATION'
| nPatients | NO | YES |
|---|---|---|
| ALL | 382 | 178 |
| subtype1 | 97 | 61 |
| subtype2 | 147 | 61 |
| subtype3 | 138 | 56 |
Figure S30. Get High-res Image Clustering Approach #5: 'Copy Number Ratio CNMF subtypes' versus Clinical Feature #6: 'RADIATIONS.RADIATION.REGIMENINDICATION'
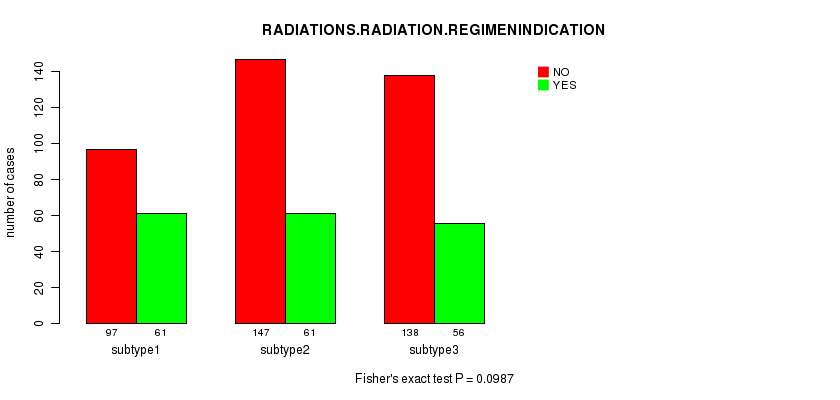
Table S36. Description of clustering approach #6: 'METHLYATION CNMF'
| Cluster Labels | 1 | 2 | 3 |
|---|---|---|---|
| Number of samples | 36 | 45 | 33 |
P value = 0.379 (logrank test), Q value = 1
Table S37. Clustering Approach #6: 'METHLYATION CNMF' versus Clinical Feature #1: 'Time to Death'
| nPatients | nDeath | Duration Range (Median), Month | |
|---|---|---|---|
| ALL | 114 | 69 | 0.2 - 58.8 (7.4) |
| subtype1 | 36 | 23 | 0.8 - 58.8 (5.4) |
| subtype2 | 45 | 30 | 0.2 - 47.9 (8.0) |
| subtype3 | 33 | 16 | 1.2 - 50.5 (7.8) |
Figure S31. Get High-res Image Clustering Approach #6: 'METHLYATION CNMF' versus Clinical Feature #1: 'Time to Death'
P value = 0.058 (ANOVA), Q value = 1
Table S38. Clustering Approach #6: 'METHLYATION CNMF' versus Clinical Feature #2: 'AGE'
| nPatients | Mean (Std.Dev) | |
|---|---|---|
| ALL | 114 | 60.9 (12.2) |
| subtype1 | 36 | 60.4 (13.7) |
| subtype2 | 45 | 63.9 (8.6) |
| subtype3 | 33 | 57.3 (13.9) |
Figure S32. Get High-res Image Clustering Approach #6: 'METHLYATION CNMF' versus Clinical Feature #2: 'AGE'
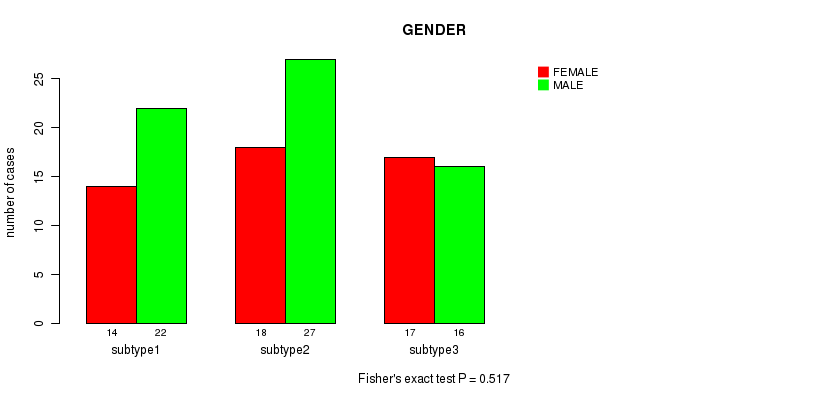
P value = 0.517 (Fisher's exact test), Q value = 1
Table S39. Clustering Approach #6: 'METHLYATION CNMF' versus Clinical Feature #3: 'GENDER'
| nPatients | FEMALE | MALE |
|---|---|---|
| ALL | 49 | 65 |
| subtype1 | 14 | 22 |
| subtype2 | 18 | 27 |
| subtype3 | 17 | 16 |
Figure S33. Get High-res Image Clustering Approach #6: 'METHLYATION CNMF' versus Clinical Feature #3: 'GENDER'
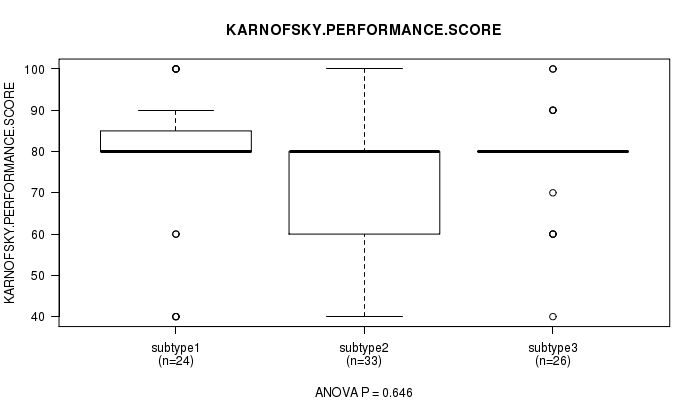
P value = 0.646 (ANOVA), Q value = 1
Table S40. Clustering Approach #6: 'METHLYATION CNMF' versus Clinical Feature #4: 'KARNOFSKY.PERFORMANCE.SCORE'
| nPatients | Mean (Std.Dev) | |
|---|---|---|
| ALL | 83 | 76.7 (15.3) |
| subtype1 | 24 | 77.5 (17.8) |
| subtype2 | 33 | 74.8 (15.6) |
| subtype3 | 26 | 78.5 (12.6) |
Figure S34. Get High-res Image Clustering Approach #6: 'METHLYATION CNMF' versus Clinical Feature #4: 'KARNOFSKY.PERFORMANCE.SCORE'
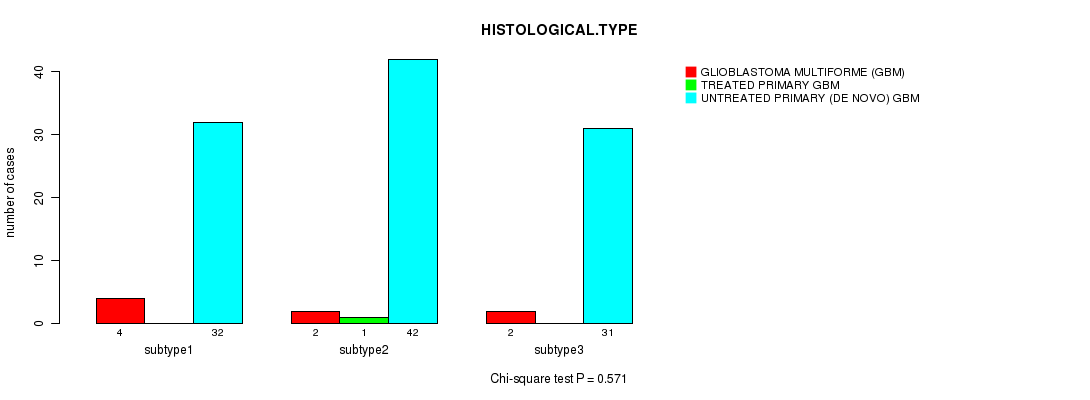
P value = 0.571 (Chi-square test), Q value = 1
Table S41. Clustering Approach #6: 'METHLYATION CNMF' versus Clinical Feature #5: 'HISTOLOGICAL.TYPE'
| nPatients | GLIOBLASTOMA MULTIFORME (GBM) | TREATED PRIMARY GBM | UNTREATED PRIMARY (DE NOVO) GBM |
|---|---|---|---|
| ALL | 8 | 1 | 105 |
| subtype1 | 4 | 0 | 32 |
| subtype2 | 2 | 1 | 42 |
| subtype3 | 2 | 0 | 31 |
Figure S35. Get High-res Image Clustering Approach #6: 'METHLYATION CNMF' versus Clinical Feature #5: 'HISTOLOGICAL.TYPE'
P value = 0.721 (Fisher's exact test), Q value = 1
Table S42. Clustering Approach #6: 'METHLYATION CNMF' versus Clinical Feature #6: 'RADIATIONS.RADIATION.REGIMENINDICATION'
| nPatients | NO | YES |
|---|---|---|
| ALL | 78 | 36 |
| subtype1 | 25 | 11 |
| subtype2 | 29 | 16 |
| subtype3 | 24 | 9 |
Figure S36. Get High-res Image Clustering Approach #6: 'METHLYATION CNMF' versus Clinical Feature #6: 'RADIATIONS.RADIATION.REGIMENINDICATION'
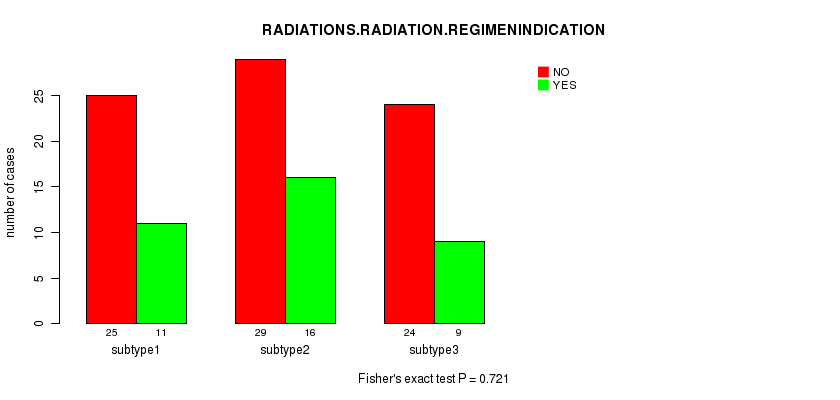
Table S43. Description of clustering approach #7: 'RPPA CNMF subtypes'
| Cluster Labels | 1 | 2 | 3 | 4 |
|---|---|---|---|---|
| Number of samples | 57 | 61 | 44 | 49 |
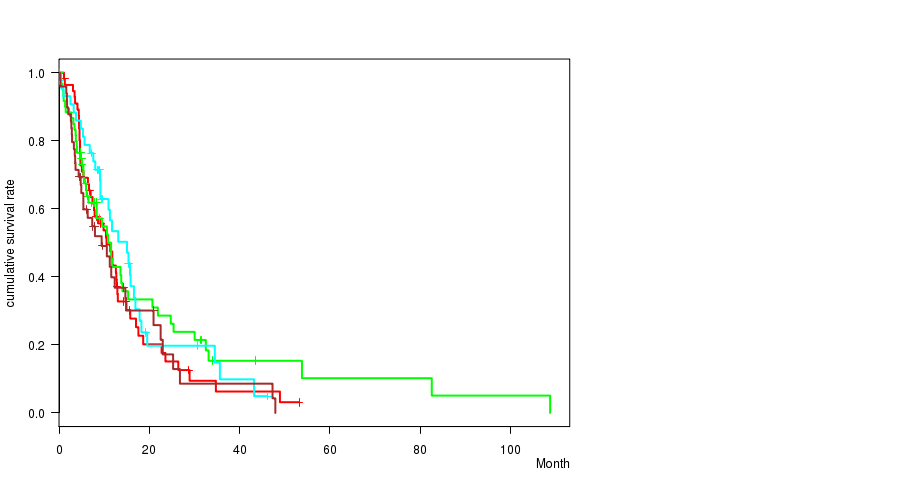
P value = 0.415 (logrank test), Q value = 1
Table S44. Clustering Approach #7: 'RPPA CNMF subtypes' versus Clinical Feature #1: 'Time to Death'
| nPatients | nDeath | Duration Range (Median), Month | |
|---|---|---|---|
| ALL | 211 | 157 | 0.1 - 108.8 (8.2) |
| subtype1 | 57 | 46 | 0.1 - 53.2 (8.7) |
| subtype2 | 61 | 44 | 0.2 - 108.8 (7.7) |
| subtype3 | 44 | 31 | 0.1 - 46.2 (9.3) |
| subtype4 | 49 | 36 | 0.2 - 47.9 (6.2) |
Figure S37. Get High-res Image Clustering Approach #7: 'RPPA CNMF subtypes' versus Clinical Feature #1: 'Time to Death'
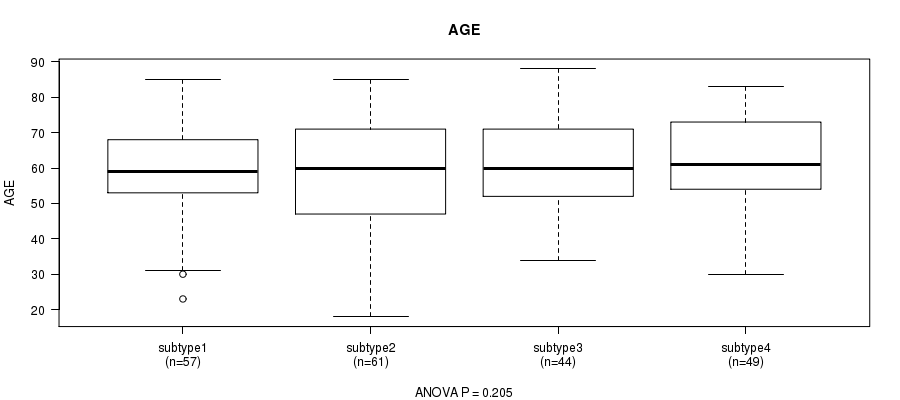
P value = 0.205 (ANOVA), Q value = 1
Table S45. Clustering Approach #7: 'RPPA CNMF subtypes' versus Clinical Feature #2: 'AGE'
| nPatients | Mean (Std.Dev) | |
|---|---|---|
| ALL | 211 | 59.9 (14.1) |
| subtype1 | 57 | 59.2 (13.6) |
| subtype2 | 61 | 57.2 (16.8) |
| subtype3 | 44 | 61.5 (12.2) |
| subtype4 | 49 | 62.5 (12.0) |
Figure S38. Get High-res Image Clustering Approach #7: 'RPPA CNMF subtypes' versus Clinical Feature #2: 'AGE'
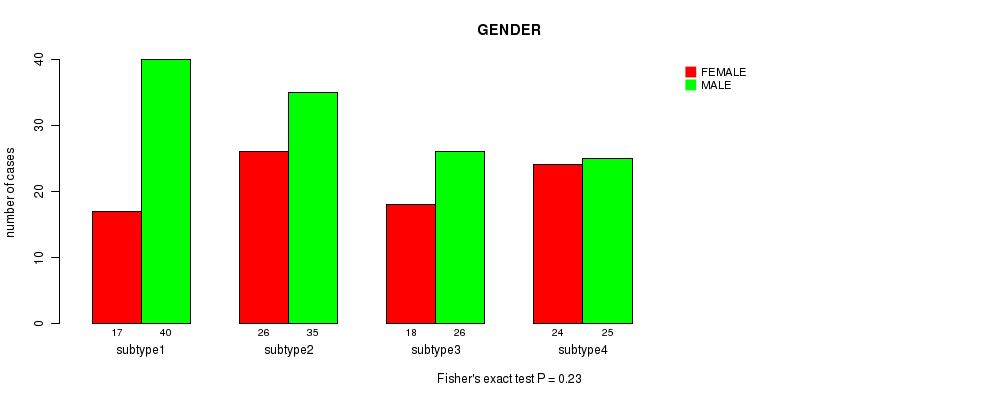
P value = 0.23 (Fisher's exact test), Q value = 1
Table S46. Clustering Approach #7: 'RPPA CNMF subtypes' versus Clinical Feature #3: 'GENDER'
| nPatients | FEMALE | MALE |
|---|---|---|
| ALL | 85 | 126 |
| subtype1 | 17 | 40 |
| subtype2 | 26 | 35 |
| subtype3 | 18 | 26 |
| subtype4 | 24 | 25 |
Figure S39. Get High-res Image Clustering Approach #7: 'RPPA CNMF subtypes' versus Clinical Feature #3: 'GENDER'
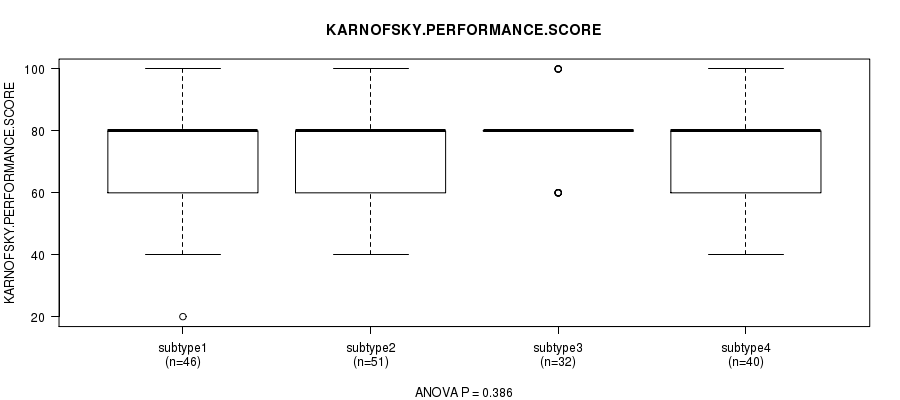
P value = 0.386 (ANOVA), Q value = 1
Table S47. Clustering Approach #7: 'RPPA CNMF subtypes' versus Clinical Feature #4: 'KARNOFSKY.PERFORMANCE.SCORE'
| nPatients | Mean (Std.Dev) | |
|---|---|---|
| ALL | 169 | 75.7 (15.3) |
| subtype1 | 46 | 75.0 (15.9) |
| subtype2 | 51 | 76.7 (16.5) |
| subtype3 | 32 | 78.8 (11.3) |
| subtype4 | 40 | 72.8 (15.8) |
Figure S40. Get High-res Image Clustering Approach #7: 'RPPA CNMF subtypes' versus Clinical Feature #4: 'KARNOFSKY.PERFORMANCE.SCORE'
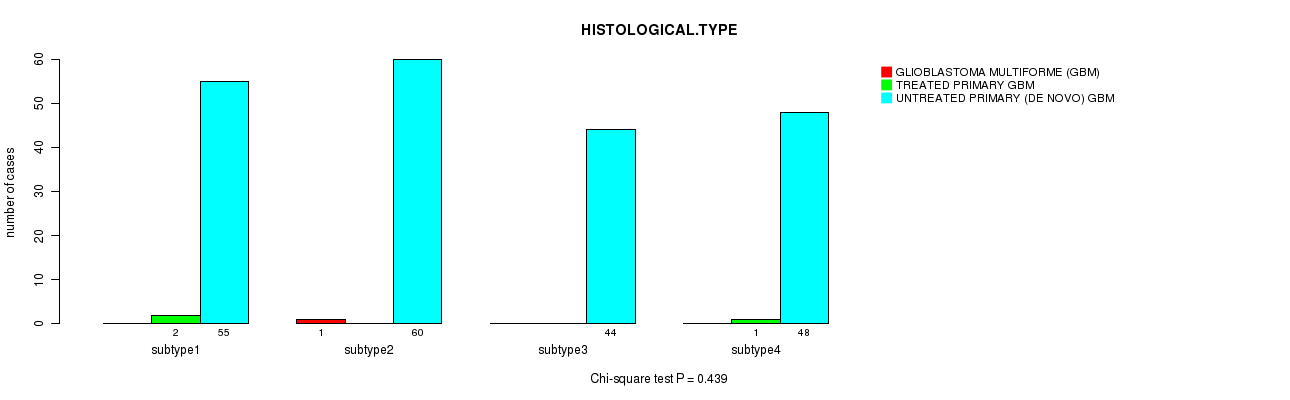
P value = 0.439 (Chi-square test), Q value = 1
Table S48. Clustering Approach #7: 'RPPA CNMF subtypes' versus Clinical Feature #5: 'HISTOLOGICAL.TYPE'
| nPatients | GLIOBLASTOMA MULTIFORME (GBM) | TREATED PRIMARY GBM | UNTREATED PRIMARY (DE NOVO) GBM |
|---|---|---|---|
| ALL | 1 | 3 | 207 |
| subtype1 | 0 | 2 | 55 |
| subtype2 | 1 | 0 | 60 |
| subtype3 | 0 | 0 | 44 |
| subtype4 | 0 | 1 | 48 |
Figure S41. Get High-res Image Clustering Approach #7: 'RPPA CNMF subtypes' versus Clinical Feature #5: 'HISTOLOGICAL.TYPE'
P value = 0.301 (Fisher's exact test), Q value = 1
Table S49. Clustering Approach #7: 'RPPA CNMF subtypes' versus Clinical Feature #6: 'RADIATIONS.RADIATION.REGIMENINDICATION'
| nPatients | NO | YES |
|---|---|---|
| ALL | 156 | 55 |
| subtype1 | 42 | 15 |
| subtype2 | 44 | 17 |
| subtype3 | 37 | 7 |
| subtype4 | 33 | 16 |
Figure S42. Get High-res Image Clustering Approach #7: 'RPPA CNMF subtypes' versus Clinical Feature #6: 'RADIATIONS.RADIATION.REGIMENINDICATION'
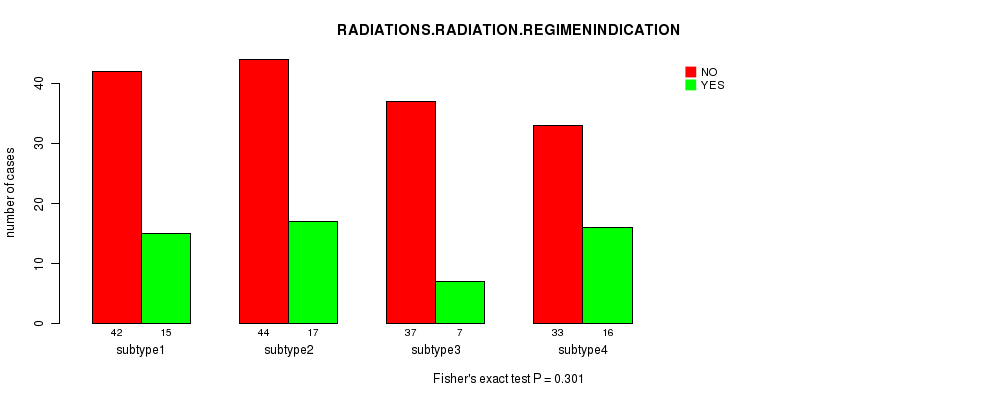
Table S50. Description of clustering approach #8: 'RPPA cHierClus subtypes'
| Cluster Labels | 1 | 2 | 3 |
|---|---|---|---|
| Number of samples | 65 | 35 | 111 |
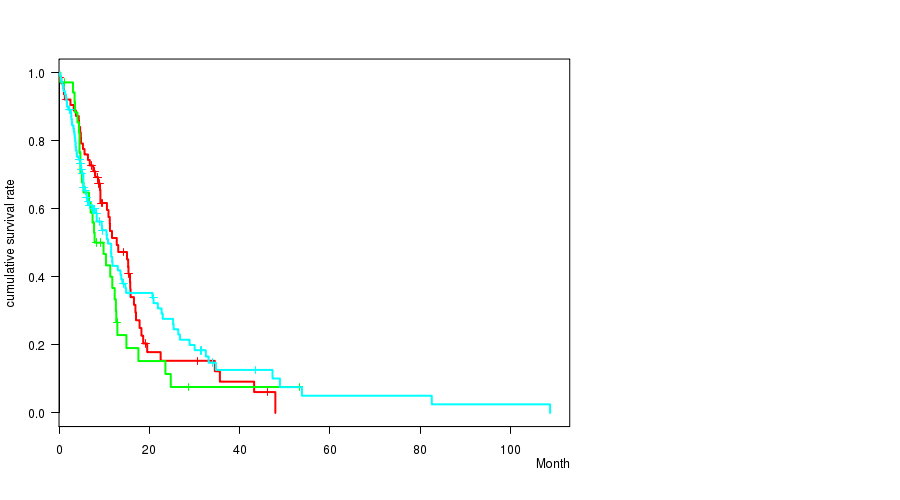
P value = 0.407 (logrank test), Q value = 1
Table S51. Clustering Approach #8: 'RPPA cHierClus subtypes' versus Clinical Feature #1: 'Time to Death'
| nPatients | nDeath | Duration Range (Median), Month | |
|---|---|---|---|
| ALL | 211 | 157 | 0.1 - 108.8 (8.2) |
| subtype1 | 65 | 48 | 0.1 - 47.9 (9.2) |
| subtype2 | 35 | 29 | 0.3 - 53.2 (7.9) |
| subtype3 | 111 | 80 | 0.2 - 108.8 (6.7) |
Figure S43. Get High-res Image Clustering Approach #8: 'RPPA cHierClus subtypes' versus Clinical Feature #1: 'Time to Death'
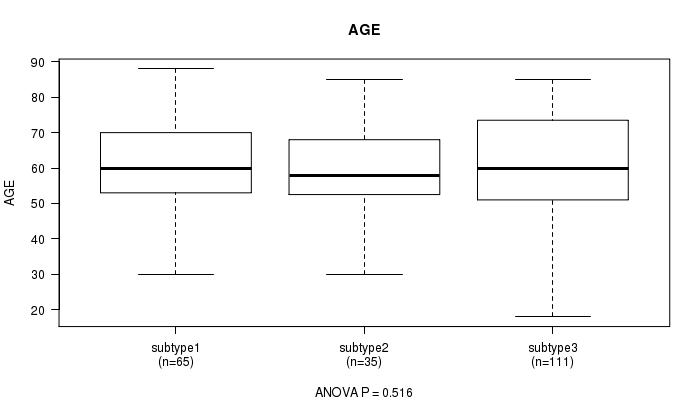
P value = 0.516 (ANOVA), Q value = 1
Table S52. Clustering Approach #8: 'RPPA cHierClus subtypes' versus Clinical Feature #2: 'AGE'
| nPatients | Mean (Std.Dev) | |
|---|---|---|
| ALL | 211 | 59.9 (14.1) |
| subtype1 | 65 | 61.5 (12.1) |
| subtype2 | 35 | 58.4 (13.2) |
| subtype3 | 111 | 59.4 (15.4) |
Figure S44. Get High-res Image Clustering Approach #8: 'RPPA cHierClus subtypes' versus Clinical Feature #2: 'AGE'
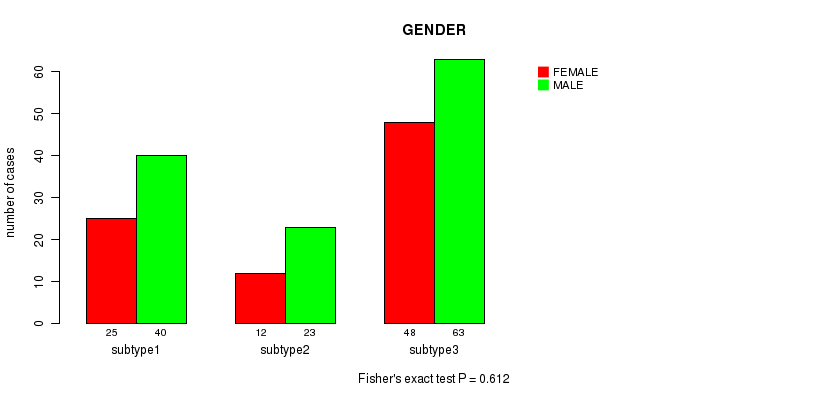
P value = 0.612 (Fisher's exact test), Q value = 1
Table S53. Clustering Approach #8: 'RPPA cHierClus subtypes' versus Clinical Feature #3: 'GENDER'
| nPatients | FEMALE | MALE |
|---|---|---|
| ALL | 85 | 126 |
| subtype1 | 25 | 40 |
| subtype2 | 12 | 23 |
| subtype3 | 48 | 63 |
Figure S45. Get High-res Image Clustering Approach #8: 'RPPA cHierClus subtypes' versus Clinical Feature #3: 'GENDER'
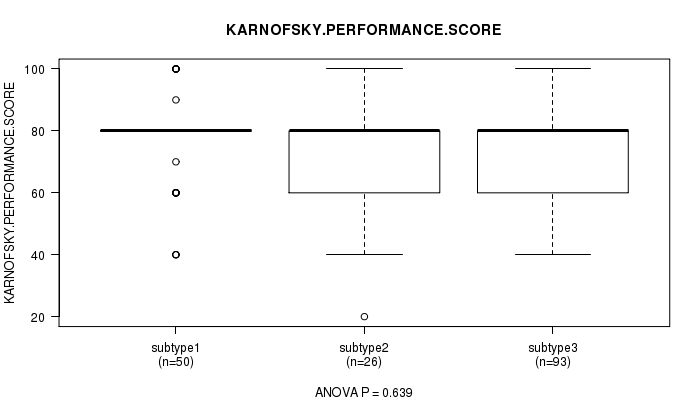
P value = 0.639 (ANOVA), Q value = 1
Table S54. Clustering Approach #8: 'RPPA cHierClus subtypes' versus Clinical Feature #4: 'KARNOFSKY.PERFORMANCE.SCORE'
| nPatients | Mean (Std.Dev) | |
|---|---|---|
| ALL | 169 | 75.7 (15.3) |
| subtype1 | 50 | 77.2 (14.1) |
| subtype2 | 26 | 73.8 (17.7) |
| subtype3 | 93 | 75.4 (15.3) |
Figure S46. Get High-res Image Clustering Approach #8: 'RPPA cHierClus subtypes' versus Clinical Feature #4: 'KARNOFSKY.PERFORMANCE.SCORE'
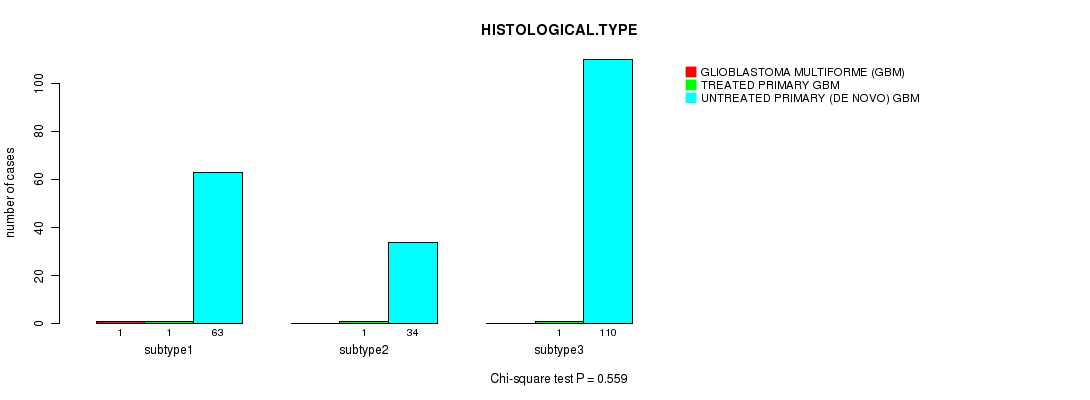
P value = 0.559 (Chi-square test), Q value = 1
Table S55. Clustering Approach #8: 'RPPA cHierClus subtypes' versus Clinical Feature #5: 'HISTOLOGICAL.TYPE'
| nPatients | GLIOBLASTOMA MULTIFORME (GBM) | TREATED PRIMARY GBM | UNTREATED PRIMARY (DE NOVO) GBM |
|---|---|---|---|
| ALL | 1 | 3 | 207 |
| subtype1 | 1 | 1 | 63 |
| subtype2 | 0 | 1 | 34 |
| subtype3 | 0 | 1 | 110 |
Figure S47. Get High-res Image Clustering Approach #8: 'RPPA cHierClus subtypes' versus Clinical Feature #5: 'HISTOLOGICAL.TYPE'
P value = 0.568 (Fisher's exact test), Q value = 1
Table S56. Clustering Approach #8: 'RPPA cHierClus subtypes' versus Clinical Feature #6: 'RADIATIONS.RADIATION.REGIMENINDICATION'
| nPatients | NO | YES |
|---|---|---|
| ALL | 156 | 55 |
| subtype1 | 51 | 14 |
| subtype2 | 26 | 9 |
| subtype3 | 79 | 32 |
Figure S48. Get High-res Image Clustering Approach #8: 'RPPA cHierClus subtypes' versus Clinical Feature #6: 'RADIATIONS.RADIATION.REGIMENINDICATION'
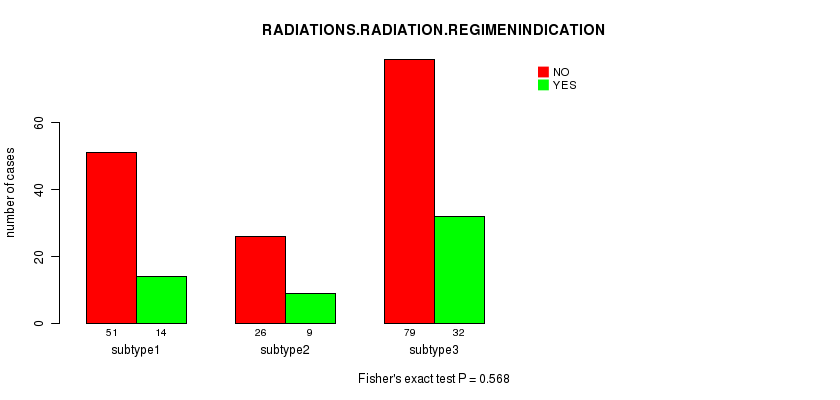
Table S57. Description of clustering approach #9: 'RNAseq CNMF subtypes'
| Cluster Labels | 1 | 2 | 3 |
|---|---|---|---|
| Number of samples | 47 | 70 | 35 |
P value = 0.16 (logrank test), Q value = 1
Table S58. Clustering Approach #9: 'RNAseq CNMF subtypes' versus Clinical Feature #1: 'Time to Death'
| nPatients | nDeath | Duration Range (Median), Month | |
|---|---|---|---|
| ALL | 152 | 114 | 0.2 - 54.0 (9.1) |
| subtype1 | 47 | 33 | 0.2 - 54.0 (8.9) |
| subtype2 | 70 | 52 | 0.9 - 47.9 (9.8) |
| subtype3 | 35 | 29 | 0.2 - 31.3 (6.0) |
Figure S49. Get High-res Image Clustering Approach #9: 'RNAseq CNMF subtypes' versus Clinical Feature #1: 'Time to Death'
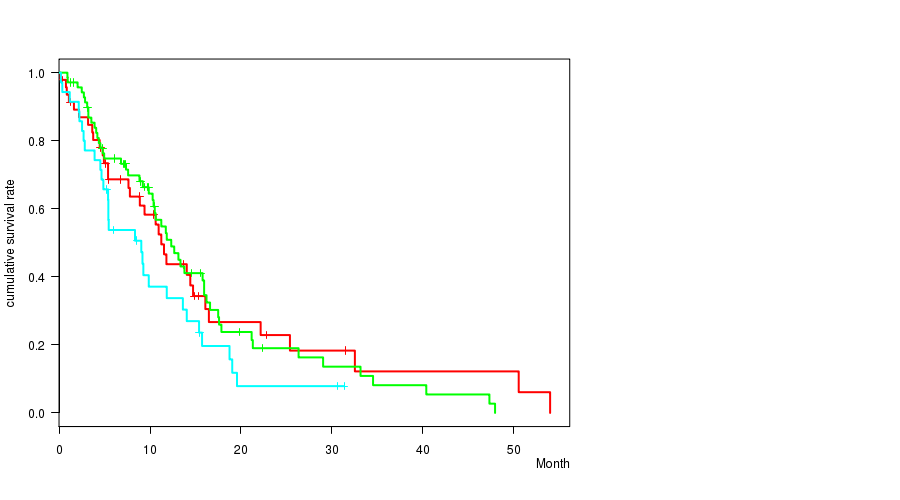
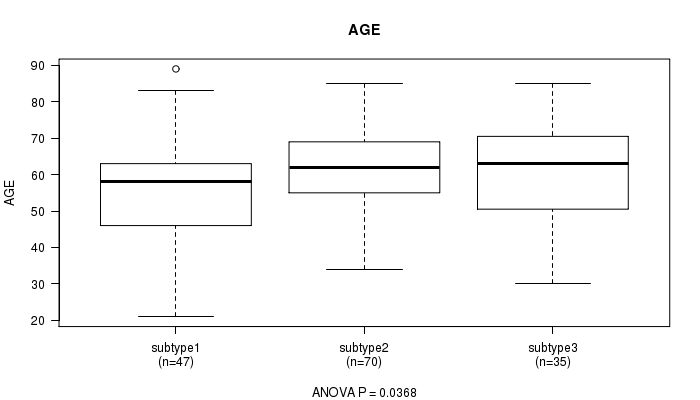
P value = 0.0368 (ANOVA), Q value = 1
Table S59. Clustering Approach #9: 'RNAseq CNMF subtypes' versus Clinical Feature #2: 'AGE'
| nPatients | Mean (Std.Dev) | |
|---|---|---|
| ALL | 152 | 59.7 (13.5) |
| subtype1 | 47 | 55.6 (16.6) |
| subtype2 | 70 | 62.0 (10.6) |
| subtype3 | 35 | 60.9 (13.3) |
Figure S50. Get High-res Image Clustering Approach #9: 'RNAseq CNMF subtypes' versus Clinical Feature #2: 'AGE'
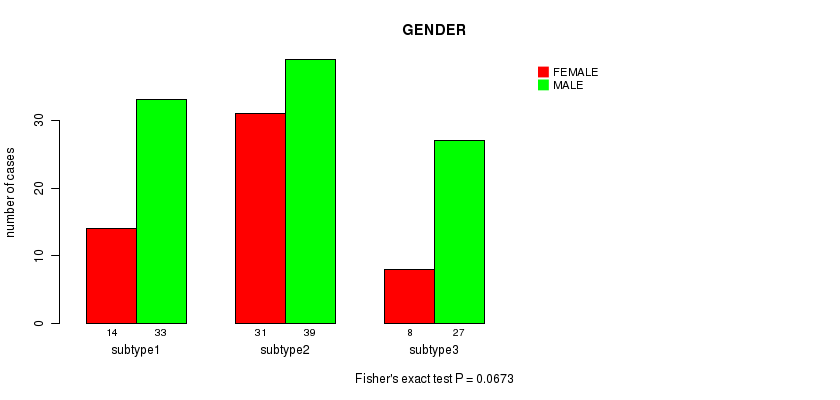
P value = 0.0673 (Fisher's exact test), Q value = 1
Table S60. Clustering Approach #9: 'RNAseq CNMF subtypes' versus Clinical Feature #3: 'GENDER'
| nPatients | FEMALE | MALE |
|---|---|---|
| ALL | 53 | 99 |
| subtype1 | 14 | 33 |
| subtype2 | 31 | 39 |
| subtype3 | 8 | 27 |
Figure S51. Get High-res Image Clustering Approach #9: 'RNAseq CNMF subtypes' versus Clinical Feature #3: 'GENDER'
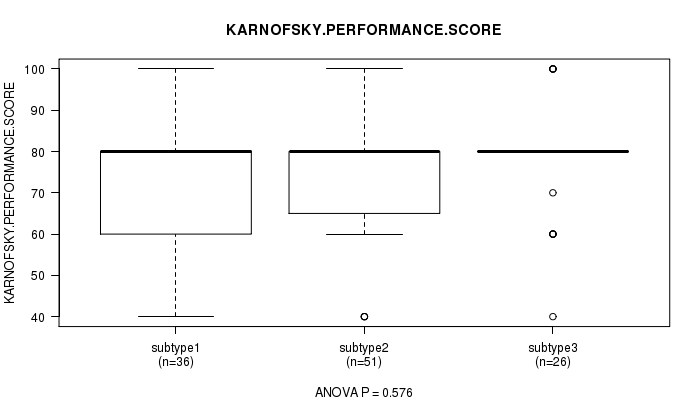
P value = 0.576 (ANOVA), Q value = 1
Table S61. Clustering Approach #9: 'RNAseq CNMF subtypes' versus Clinical Feature #4: 'KARNOFSKY.PERFORMANCE.SCORE'
| nPatients | Mean (Std.Dev) | |
|---|---|---|
| ALL | 113 | 75.8 (14.4) |
| subtype1 | 36 | 74.2 (15.2) |
| subtype2 | 51 | 75.7 (14.2) |
| subtype3 | 26 | 78.1 (13.9) |
Figure S52. Get High-res Image Clustering Approach #9: 'RNAseq CNMF subtypes' versus Clinical Feature #4: 'KARNOFSKY.PERFORMANCE.SCORE'
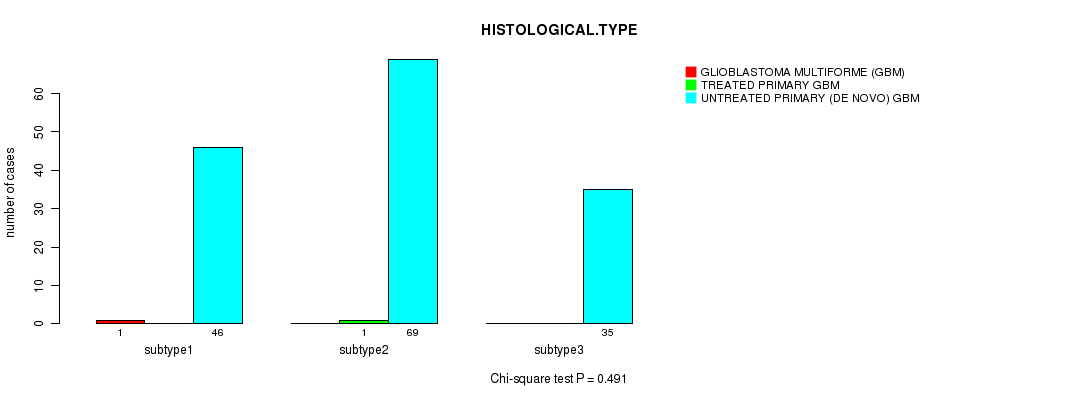
P value = 0.491 (Chi-square test), Q value = 1
Table S62. Clustering Approach #9: 'RNAseq CNMF subtypes' versus Clinical Feature #5: 'HISTOLOGICAL.TYPE'
| nPatients | GLIOBLASTOMA MULTIFORME (GBM) | TREATED PRIMARY GBM | UNTREATED PRIMARY (DE NOVO) GBM |
|---|---|---|---|
| ALL | 1 | 1 | 150 |
| subtype1 | 1 | 0 | 46 |
| subtype2 | 0 | 1 | 69 |
| subtype3 | 0 | 0 | 35 |
Figure S53. Get High-res Image Clustering Approach #9: 'RNAseq CNMF subtypes' versus Clinical Feature #5: 'HISTOLOGICAL.TYPE'
P value = 0.833 (Fisher's exact test), Q value = 1
Table S63. Clustering Approach #9: 'RNAseq CNMF subtypes' versus Clinical Feature #6: 'RADIATIONS.RADIATION.REGIMENINDICATION'
| nPatients | NO | YES |
|---|---|---|
| ALL | 102 | 50 |
| subtype1 | 32 | 15 |
| subtype2 | 48 | 22 |
| subtype3 | 22 | 13 |
Figure S54. Get High-res Image Clustering Approach #9: 'RNAseq CNMF subtypes' versus Clinical Feature #6: 'RADIATIONS.RADIATION.REGIMENINDICATION'
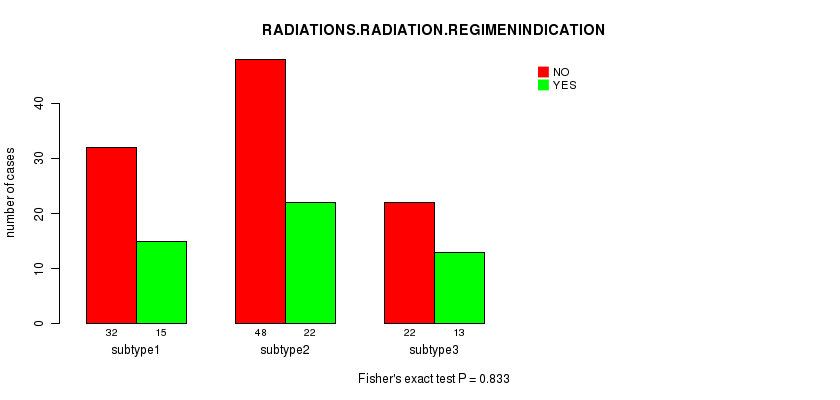
Table S64. Description of clustering approach #10: 'RNAseq cHierClus subtypes'
| Cluster Labels | 1 | 2 | 3 |
|---|---|---|---|
| Number of samples | 69 | 22 | 61 |
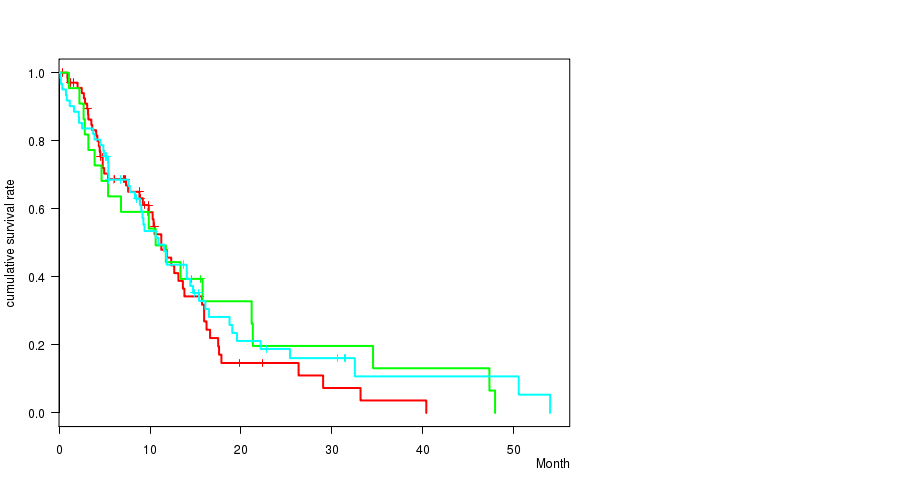
P value = 0.71 (logrank test), Q value = 1
Table S65. Clustering Approach #10: 'RNAseq cHierClus subtypes' versus Clinical Feature #1: 'Time to Death'
| nPatients | nDeath | Duration Range (Median), Month | |
|---|---|---|---|
| ALL | 152 | 114 | 0.2 - 54.0 (9.1) |
| subtype1 | 69 | 48 | 0.4 - 40.4 (8.8) |
| subtype2 | 22 | 19 | 1.1 - 47.9 (10.2) |
| subtype3 | 61 | 47 | 0.2 - 54.0 (9.2) |
Figure S55. Get High-res Image Clustering Approach #10: 'RNAseq cHierClus subtypes' versus Clinical Feature #1: 'Time to Death'
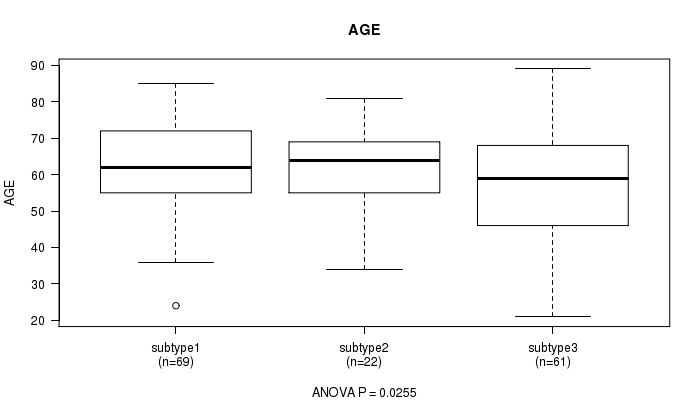
P value = 0.0255 (ANOVA), Q value = 1
Table S66. Clustering Approach #10: 'RNAseq cHierClus subtypes' versus Clinical Feature #2: 'AGE'
| nPatients | Mean (Std.Dev) | |
|---|---|---|
| ALL | 152 | 59.7 (13.5) |
| subtype1 | 69 | 62.1 (11.5) |
| subtype2 | 22 | 62.3 (10.5) |
| subtype3 | 61 | 56.1 (15.8) |
Figure S56. Get High-res Image Clustering Approach #10: 'RNAseq cHierClus subtypes' versus Clinical Feature #2: 'AGE'
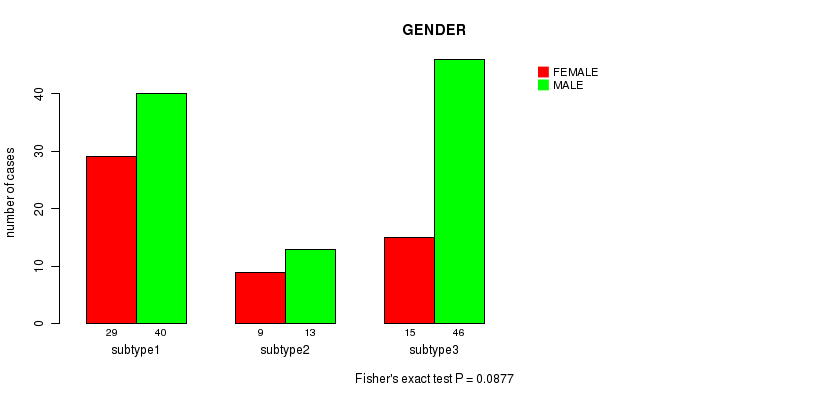
P value = 0.0877 (Fisher's exact test), Q value = 1
Table S67. Clustering Approach #10: 'RNAseq cHierClus subtypes' versus Clinical Feature #3: 'GENDER'
| nPatients | FEMALE | MALE |
|---|---|---|
| ALL | 53 | 99 |
| subtype1 | 29 | 40 |
| subtype2 | 9 | 13 |
| subtype3 | 15 | 46 |
Figure S57. Get High-res Image Clustering Approach #10: 'RNAseq cHierClus subtypes' versus Clinical Feature #3: 'GENDER'
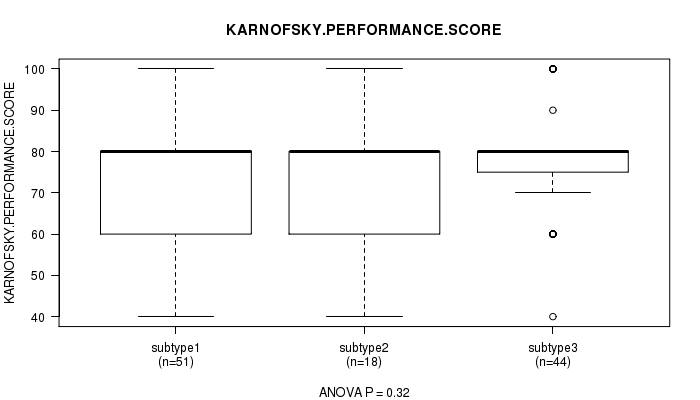
P value = 0.32 (ANOVA), Q value = 1
Table S68. Clustering Approach #10: 'RNAseq cHierClus subtypes' versus Clinical Feature #4: 'KARNOFSKY.PERFORMANCE.SCORE'
| nPatients | Mean (Std.Dev) | |
|---|---|---|
| ALL | 113 | 75.8 (14.4) |
| subtype1 | 51 | 74.7 (14.6) |
| subtype2 | 18 | 72.8 (15.3) |
| subtype3 | 44 | 78.2 (13.7) |
Figure S58. Get High-res Image Clustering Approach #10: 'RNAseq cHierClus subtypes' versus Clinical Feature #4: 'KARNOFSKY.PERFORMANCE.SCORE'
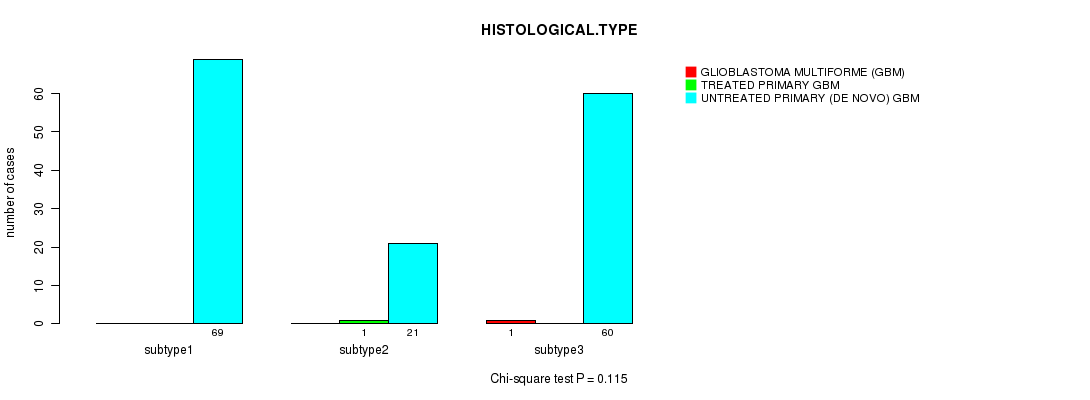
P value = 0.115 (Chi-square test), Q value = 1
Table S69. Clustering Approach #10: 'RNAseq cHierClus subtypes' versus Clinical Feature #5: 'HISTOLOGICAL.TYPE'
| nPatients | GLIOBLASTOMA MULTIFORME (GBM) | TREATED PRIMARY GBM | UNTREATED PRIMARY (DE NOVO) GBM |
|---|---|---|---|
| ALL | 1 | 1 | 150 |
| subtype1 | 0 | 0 | 69 |
| subtype2 | 0 | 1 | 21 |
| subtype3 | 1 | 0 | 60 |
Figure S59. Get High-res Image Clustering Approach #10: 'RNAseq cHierClus subtypes' versus Clinical Feature #5: 'HISTOLOGICAL.TYPE'
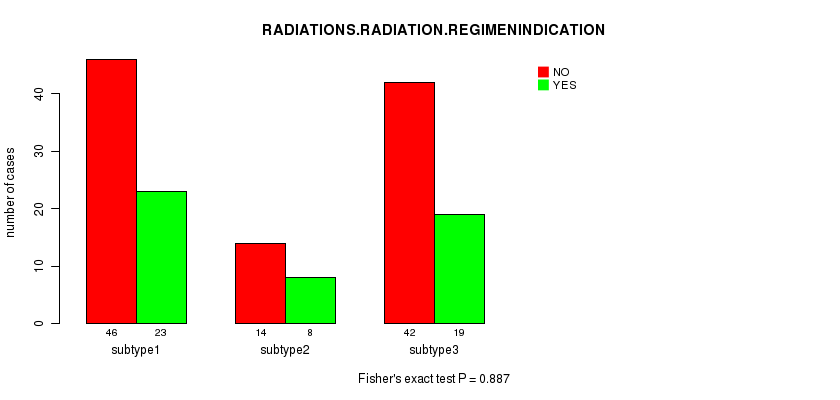
P value = 0.887 (Fisher's exact test), Q value = 1
Table S70. Clustering Approach #10: 'RNAseq cHierClus subtypes' versus Clinical Feature #6: 'RADIATIONS.RADIATION.REGIMENINDICATION'
| nPatients | NO | YES |
|---|---|---|
| ALL | 102 | 50 |
| subtype1 | 46 | 23 |
| subtype2 | 14 | 8 |
| subtype3 | 42 | 19 |
Figure S60. Get High-res Image Clustering Approach #10: 'RNAseq cHierClus subtypes' versus Clinical Feature #6: 'RADIATIONS.RADIATION.REGIMENINDICATION'
-
Cluster data file = GBM-TP.mergedcluster.txt
-
Clinical data file = GBM-TP.merged_data.txt
-
Number of patients = 581
-
Number of clustering approaches = 10
-
Number of selected clinical features = 6
-
Exclude small clusters that include fewer than K patients, K = 3
consensus non-negative matrix factorization clustering approach (Brunet et al. 2004)
Resampling-based clustering method (Monti et al. 2003)
For survival clinical features, the Kaplan-Meier survival curves of tumors with and without gene mutations were plotted and the statistical significance P values were estimated by logrank test (Bland and Altman 2004) using the 'survdiff' function in R
For continuous numerical clinical features, one-way analysis of variance (Howell 2002) was applied to compare the clinical values between tumor subtypes using 'anova' function in R
For binary clinical features, two-tailed Fisher's exact tests (Fisher 1922) were used to estimate the P values using the 'fisher.test' function in R
For multi-class clinical features (nominal or ordinal), Chi-square tests (Greenwood and Nikulin 1996) were used to estimate the P values using the 'chisq.test' function in R
For multiple hypothesis correction, Q value is the False Discovery Rate (FDR) analogue of the P value (Benjamini and Hochberg 1995), defined as the minimum FDR at which the test may be called significant. We used the 'Benjamini and Hochberg' method of 'p.adjust' function in R to convert P values into Q values.
In addition to the links below, the full results of the analysis summarized in this report can also be downloaded programmatically using firehose_get, or interactively from either the Broad GDAC website or TCGA Data Coordination Center Portal.