This pipeline computes the correlation between significantly recurrent gene mutations and selected clinical features.
Testing the association between mutation status of 12 genes and 6 clinical features across 278 patients, 4 significant findings detected with Q value < 0.25.
-
IDH1 mutation correlated to 'Time to Death' and 'AGE'.
-
TP53 mutation correlated to 'Time to Death'.
-
STAG2 mutation correlated to 'Time to Death'.
Table 1. Get Full Table Overview of the association between mutation status of 12 genes and 6 clinical features. Shown in the table are P values (Q values). Thresholded by Q value < 0.25, 4 significant findings detected.
|
Clinical Features |
Time to Death |
AGE | GENDER |
KARNOFSKY PERFORMANCE SCORE |
HISTOLOGICAL TYPE |
RADIATIONS RADIATION REGIMENINDICATION |
||
| nMutated (%) | nWild-Type | logrank test | t-test | Fisher's exact test | t-test | Fisher's exact test | Fisher's exact test | |
| IDH1 | 14 (5%) | 264 |
0.000147 (0.0105) |
9.73e-05 (0.00701) |
0.392 (1.00) |
0.0754 (1.00) |
0.497 (1.00) |
0.04 (1.00) |
| TP53 | 78 (28%) | 200 |
0.00149 (0.105) |
0.114 (1.00) |
0.677 (1.00) |
0.0122 (0.817) |
0.351 (1.00) |
0.202 (1.00) |
| STAG2 | 12 (4%) | 266 |
0.00259 (0.179) |
0.901 (1.00) |
0.761 (1.00) |
0.0888 (1.00) |
1 (1.00) |
0.54 (1.00) |
| EGFR | 73 (26%) | 205 |
0.824 (1.00) |
0.758 (1.00) |
0.257 (1.00) |
0.411 (1.00) |
0.453 (1.00) |
0.565 (1.00) |
| PIK3R1 | 32 (12%) | 246 |
0.648 (1.00) |
0.956 (1.00) |
0.434 (1.00) |
0.951 (1.00) |
1 (1.00) |
0.69 (1.00) |
| BRAF | 6 (2%) | 272 |
0.144 (1.00) |
0.989 (1.00) |
1 (1.00) |
0.145 (1.00) |
0.0273 (1.00) |
0.401 (1.00) |
| PTEN | 85 (31%) | 193 |
0.452 (1.00) |
0.153 (1.00) |
0.588 (1.00) |
0.833 (1.00) |
0.0601 (1.00) |
0.678 (1.00) |
| PIK3CA | 29 (10%) | 249 |
0.461 (1.00) |
0.856 (1.00) |
0.544 (1.00) |
0.906 (1.00) |
0.515 (1.00) |
1 (1.00) |
| RB1 | 23 (8%) | 255 |
0.221 (1.00) |
0.799 (1.00) |
0.654 (1.00) |
0.011 (0.748) |
0.683 (1.00) |
1 (1.00) |
| NF1 | 29 (10%) | 249 |
0.245 (1.00) |
0.163 (1.00) |
0.84 (1.00) |
0.164 (1.00) |
1 (1.00) |
0.54 (1.00) |
| WNT2 | 5 (2%) | 273 |
0.0995 (1.00) |
0.232 (1.00) |
0.0579 (1.00) |
0.73 (1.00) |
1 (1.00) |
1 (1.00) |
| TPTE2 | 8 (3%) | 270 |
0.408 (1.00) |
0.613 (1.00) |
1 (1.00) |
0.0273 (1.00) |
1 (1.00) |
0.446 (1.00) |
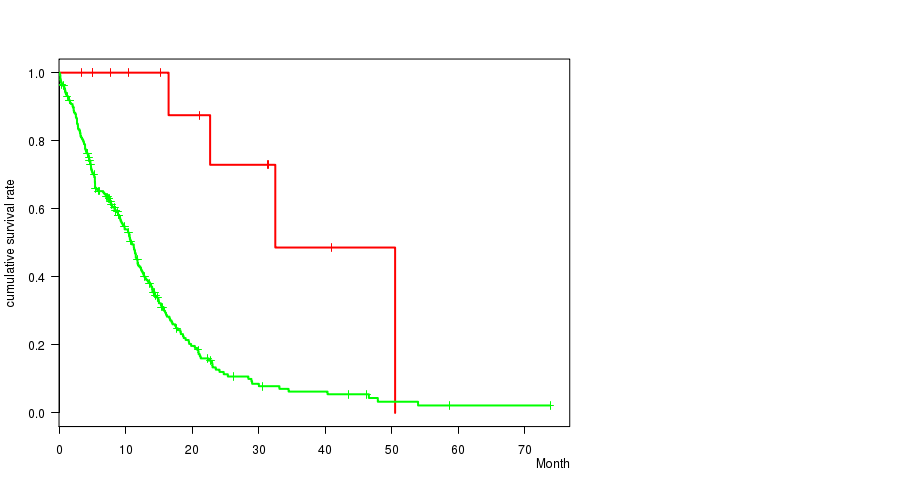
P value = 0.000147 (logrank test), Q value = 0.01
Table S1. Gene #4: 'IDH1 MUTATION STATUS' versus Clinical Feature #1: 'Time to Death'
| nPatients | nDeath | Duration Range (Median), Month | |
|---|---|---|---|
| ALL | 278 | 206 | 0.1 - 73.8 (8.8) |
| IDH1 MUTATED | 14 | 4 | 3.4 - 50.5 (18.8) |
| IDH1 WILD-TYPE | 264 | 202 | 0.1 - 73.8 (8.5) |
Figure S1. Get High-res Image Gene #4: 'IDH1 MUTATION STATUS' versus Clinical Feature #1: 'Time to Death'
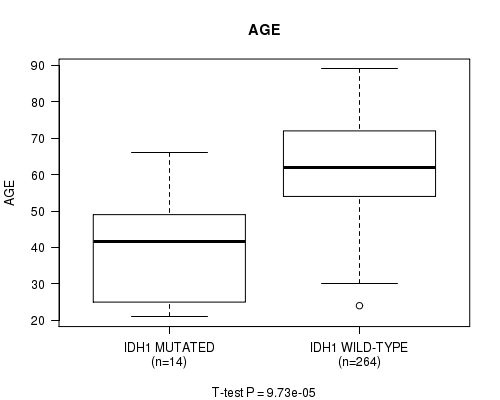
P value = 9.73e-05 (t-test), Q value = 0.007
Table S2. Gene #4: 'IDH1 MUTATION STATUS' versus Clinical Feature #2: 'AGE'
| nPatients | Mean (Std.Dev) | |
|---|---|---|
| ALL | 278 | 61.0 (13.0) |
| IDH1 MUTATED | 14 | 40.0 (15.1) |
| IDH1 WILD-TYPE | 264 | 62.2 (11.9) |
Figure S2. Get High-res Image Gene #4: 'IDH1 MUTATION STATUS' versus Clinical Feature #2: 'AGE'
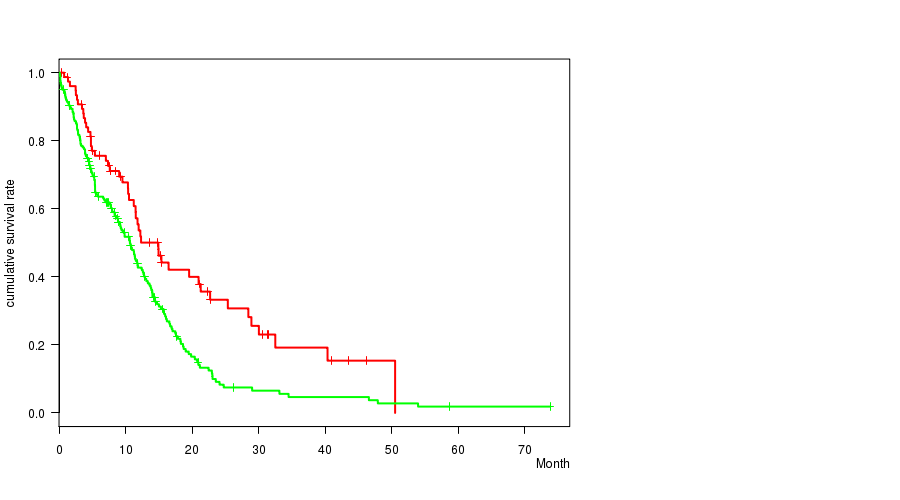
P value = 0.00149 (logrank test), Q value = 0.1
Table S3. Gene #5: 'TP53 MUTATION STATUS' versus Clinical Feature #1: 'Time to Death'
| nPatients | nDeath | Duration Range (Median), Month | |
|---|---|---|---|
| ALL | 278 | 206 | 0.1 - 73.8 (8.8) |
| TP53 MUTATED | 78 | 48 | 0.4 - 50.5 (10.4) |
| TP53 WILD-TYPE | 200 | 158 | 0.1 - 73.8 (8.3) |
Figure S3. Get High-res Image Gene #5: 'TP53 MUTATION STATUS' versus Clinical Feature #1: 'Time to Death'
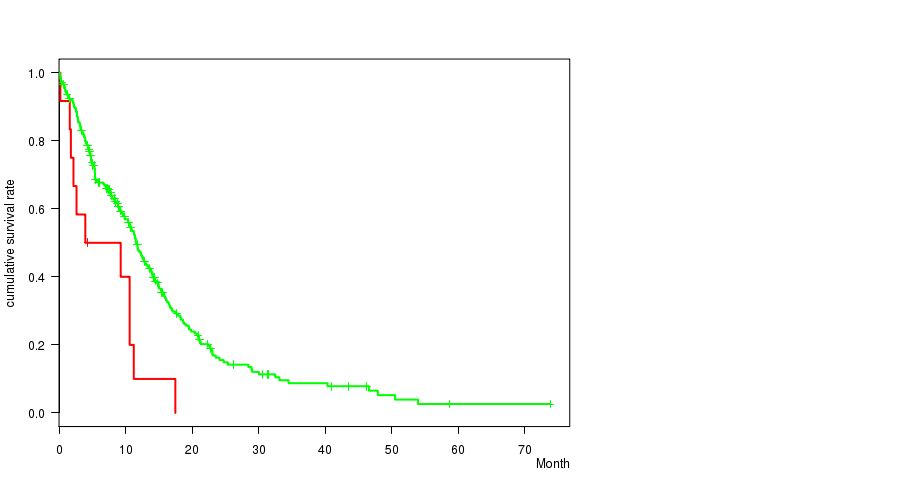
P value = 0.00259 (logrank test), Q value = 0.18
Table S4. Gene #10: 'STAG2 MUTATION STATUS' versus Clinical Feature #1: 'Time to Death'
| nPatients | nDeath | Duration Range (Median), Month | |
|---|---|---|---|
| ALL | 278 | 206 | 0.1 - 73.8 (8.8) |
| STAG2 MUTATED | 12 | 11 | 0.2 - 17.5 (4.1) |
| STAG2 WILD-TYPE | 266 | 195 | 0.1 - 73.8 (8.9) |
Figure S4. Get High-res Image Gene #10: 'STAG2 MUTATION STATUS' versus Clinical Feature #1: 'Time to Death'
-
Mutation data file = transformed.cor.cli.txt
-
Clinical data file = GBM-TP.merged_data.txt
-
Number of patients = 278
-
Number of significantly mutated genes = 12
-
Number of selected clinical features = 6
-
Exclude genes that fewer than K tumors have mutations, K = 3
For survival clinical features, the Kaplan-Meier survival curves of tumors with and without gene mutations were plotted and the statistical significance P values were estimated by logrank test (Bland and Altman 2004) using the 'survdiff' function in R
For continuous numerical clinical features, two-tailed Student's t test with unequal variance (Lehmann and Romano 2005) was applied to compare the clinical values between tumors with and without gene mutations using 't.test' function in R
For binary or multi-class clinical features (nominal or ordinal), two-tailed Fisher's exact tests (Fisher 1922) were used to estimate the P values using the 'fisher.test' function in R
For multiple hypothesis correction, Q value is the False Discovery Rate (FDR) analogue of the P value (Benjamini and Hochberg 1995), defined as the minimum FDR at which the test may be called significant. We used the 'Benjamini and Hochberg' method of 'p.adjust' function in R to convert P values into Q values.
In addition to the links below, the full results of the analysis summarized in this report can also be downloaded programmatically using firehose_get, or interactively from either the Broad GDAC website or TCGA Data Coordination Center Portal.