This pipeline computes the correlation between significantly recurrent gene mutations and selected clinical features.
Testing the association between mutation status of 35 genes and 10 clinical features across 306 patients, 4 significant findings detected with Q value < 0.25.
-
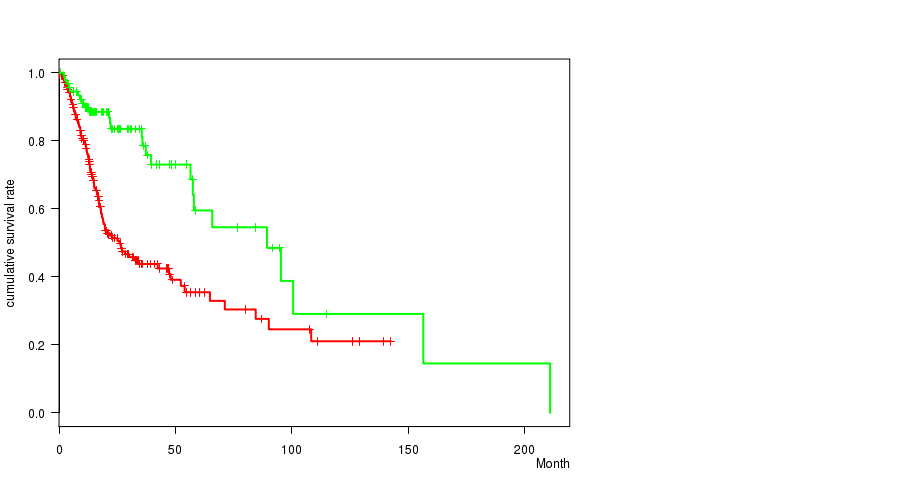
TP53 mutation correlated to 'Time to Death'.
-
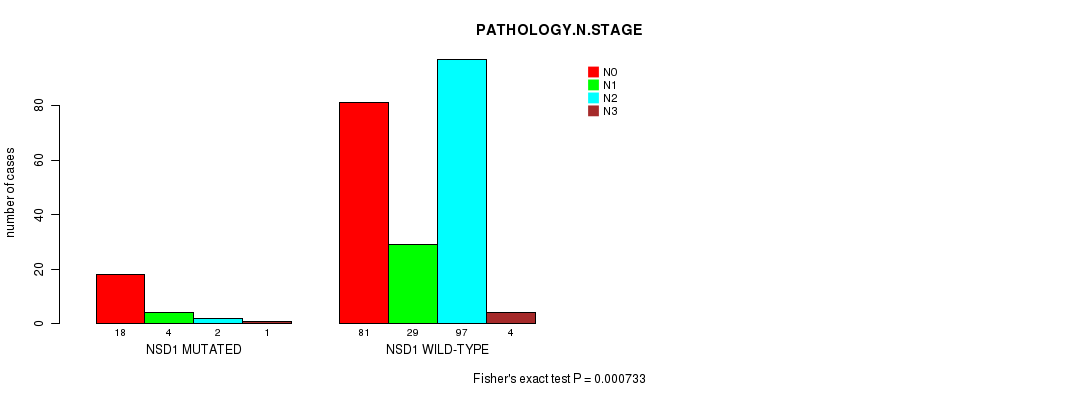
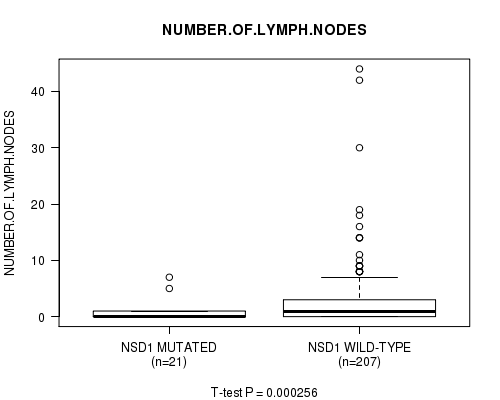
NSD1 mutation correlated to 'PATHOLOGY.N.STAGE' and 'NUMBER.OF.LYMPH.NODES'.
-
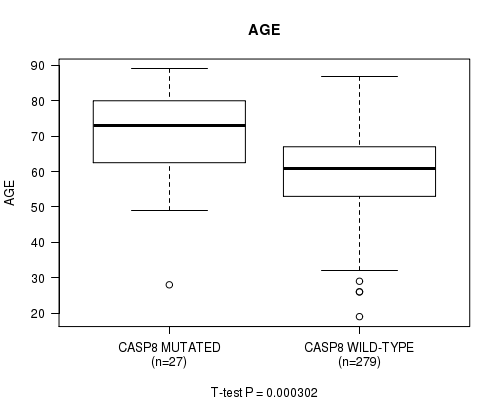
CASP8 mutation correlated to 'AGE'.
Table 1. Get Full Table Overview of the association between mutation status of 35 genes and 10 clinical features. Shown in the table are P values (Q values). Thresholded by Q value < 0.25, 4 significant findings detected.
|
Clinical Features |
Time to Death |
AGE |
NEOPLASM DISEASESTAGE |
PATHOLOGY T STAGE |
PATHOLOGY N STAGE |
GENDER |
RADIATIONS RADIATION REGIMENINDICATION |
NUMBERPACKYEARSSMOKED | YEAROFTOBACCOSMOKINGONSET |
NUMBER OF LYMPH NODES |
||
| nMutated (%) | nWild-Type | logrank test | t-test | Chi-square test | Fisher's exact test | Fisher's exact test | Fisher's exact test | Fisher's exact test | t-test | t-test | t-test | |
| NSD1 | 33 (11%) | 273 |
0.0806 (1.00) |
0.0819 (1.00) |
0.0577 (1.00) |
0.768 (1.00) |
0.000733 (0.248) |
0.301 (1.00) |
0.301 (1.00) |
0.21 (1.00) |
0.94 (1.00) |
0.000256 (0.0872) |
| TP53 | 213 (70%) | 93 |
1.61e-05 (0.0055) |
0.721 (1.00) |
0.00795 (1.00) |
0.00591 (1.00) |
0.0164 (1.00) |
0.781 (1.00) |
0.123 (1.00) |
0.0941 (1.00) |
0.899 (1.00) |
0.0201 (1.00) |
| CASP8 | 27 (9%) | 279 |
0.984 (1.00) |
0.000302 (0.102) |
0.266 (1.00) |
0.561 (1.00) |
0.0973 (1.00) |
0.00127 (0.428) |
0.372 (1.00) |
0.229 (1.00) |
0.13 (1.00) |
0.0942 (1.00) |
| PIK3CA | 64 (21%) | 242 |
0.357 (1.00) |
0.832 (1.00) |
0.49 (1.00) |
0.743 (1.00) |
0.465 (1.00) |
0.114 (1.00) |
1 (1.00) |
0.709 (1.00) |
0.917 (1.00) |
0.38 (1.00) |
| CDKN2A | 65 (21%) | 241 |
0.561 (1.00) |
0.697 (1.00) |
0.292 (1.00) |
0.659 (1.00) |
0.937 (1.00) |
0.64 (1.00) |
0.428 (1.00) |
0.0679 (1.00) |
0.389 (1.00) |
0.955 (1.00) |
| HRAS | 10 (3%) | 296 |
0.0529 (1.00) |
0.227 (1.00) |
0.0975 (1.00) |
0.241 (1.00) |
0.0486 (1.00) |
1 (1.00) |
0.465 (1.00) |
0.146 (1.00) |
0.216 (1.00) |
0.211 (1.00) |
| NFE2L2 | 17 (6%) | 289 |
0.0858 (1.00) |
0.00697 (1.00) |
0.699 (1.00) |
0.754 (1.00) |
1 (1.00) |
0.261 (1.00) |
0.256 (1.00) |
0.917 (1.00) |
0.308 (1.00) |
0.677 (1.00) |
| NOTCH1 | 57 (19%) | 249 |
0.413 (1.00) |
0.131 (1.00) |
0.845 (1.00) |
0.744 (1.00) |
0.908 (1.00) |
0.188 (1.00) |
0.405 (1.00) |
0.00955 (1.00) |
0.819 (1.00) |
0.215 (1.00) |
| FAT1 | 69 (23%) | 237 |
0.743 (1.00) |
0.000967 (0.326) |
0.494 (1.00) |
0.449 (1.00) |
0.834 (1.00) |
0.0677 (1.00) |
0.758 (1.00) |
0.509 (1.00) |
0.13 (1.00) |
0.87 (1.00) |
| JUB | 18 (6%) | 288 |
0.104 (1.00) |
0.0802 (1.00) |
0.709 (1.00) |
0.471 (1.00) |
0.315 (1.00) |
1 (1.00) |
1 (1.00) |
0.519 (1.00) |
0.0649 (1.00) |
0.929 (1.00) |
| MLL2 | 53 (17%) | 253 |
0.6 (1.00) |
0.835 (1.00) |
0.273 (1.00) |
0.124 (1.00) |
0.861 (1.00) |
0.867 (1.00) |
1 (1.00) |
0.47 (1.00) |
0.357 (1.00) |
0.108 (1.00) |
| FBXW7 | 15 (5%) | 291 |
0.846 (1.00) |
0.0958 (1.00) |
0.472 (1.00) |
0.635 (1.00) |
0.295 (1.00) |
0.372 (1.00) |
0.553 (1.00) |
0.405 (1.00) |
0.371 (1.00) |
0.373 (1.00) |
| ZNF750 | 13 (4%) | 293 |
0.858 (1.00) |
0.861 (1.00) |
0.478 (1.00) |
0.0594 (1.00) |
0.749 (1.00) |
0.123 (1.00) |
0.525 (1.00) |
0.917 (1.00) |
0.16 (1.00) |
0.767 (1.00) |
| EPHA2 | 13 (4%) | 293 |
0.118 (1.00) |
0.881 (1.00) |
0.856 (1.00) |
0.95 (1.00) |
0.6 (1.00) |
0.199 (1.00) |
1 (1.00) |
0.00774 (1.00) |
0.06 (1.00) |
0.528 (1.00) |
| FLG | 47 (15%) | 259 |
0.734 (1.00) |
0.64 (1.00) |
0.641 (1.00) |
0.585 (1.00) |
0.0449 (1.00) |
1 (1.00) |
0.858 (1.00) |
0.785 (1.00) |
0.575 (1.00) |
0.272 (1.00) |
| B2M | 7 (2%) | 299 |
0.239 (1.00) |
0.483 (1.00) |
0.874 (1.00) |
0.61 (1.00) |
1 (1.00) |
0.68 (1.00) |
||||
| EP300 | 24 (8%) | 282 |
0.563 (1.00) |
0.495 (1.00) |
0.677 (1.00) |
0.92 (1.00) |
0.675 (1.00) |
0.483 (1.00) |
0.634 (1.00) |
0.145 (1.00) |
0.656 (1.00) |
0.455 (1.00) |
| RHOA | 4 (1%) | 302 |
0.729 (1.00) |
0.916 (1.00) |
0.843 (1.00) |
0.224 (1.00) |
0.406 (1.00) |
0.303 (1.00) |
0.576 (1.00) |
0.00203 (0.68) |
0.545 (1.00) |
0.148 (1.00) |
| HLA-A | 9 (3%) | 297 |
0.837 (1.00) |
0.262 (1.00) |
0.474 (1.00) |
0.62 (1.00) |
0.341 (1.00) |
1 (1.00) |
0.703 (1.00) |
0.702 (1.00) |
0.261 (1.00) |
0.00947 (1.00) |
| CTCF | 11 (4%) | 295 |
0.565 (1.00) |
0.0444 (1.00) |
0.468 (1.00) |
0.935 (1.00) |
0.658 (1.00) |
0.181 (1.00) |
0.49 (1.00) |
0.155 (1.00) |
0.19 (1.00) |
0.244 (1.00) |
| RB1 | 10 (3%) | 296 |
0.239 (1.00) |
0.714 (1.00) |
0.0938 (1.00) |
0.24 (1.00) |
0.668 (1.00) |
0.145 (1.00) |
1 (1.00) |
0.86 (1.00) |
0.646 (1.00) |
0.772 (1.00) |
| CSMD3 | 70 (23%) | 236 |
0.807 (1.00) |
0.973 (1.00) |
0.0452 (1.00) |
0.205 (1.00) |
0.00532 (1.00) |
1 (1.00) |
0.878 (1.00) |
0.0799 (1.00) |
0.503 (1.00) |
0.348 (1.00) |
| TGFBR2 | 10 (3%) | 296 |
0.784 (1.00) |
0.0292 (1.00) |
0.886 (1.00) |
0.71 (1.00) |
0.341 (1.00) |
0.47 (1.00) |
0.0678 (1.00) |
0.285 (1.00) |
0.00837 (1.00) |
0.0464 (1.00) |
| NECAB1 | 6 (2%) | 300 |
0.848 (1.00) |
0.00999 (1.00) |
0.607 (1.00) |
0.517 (1.00) |
1 (1.00) |
0.351 (1.00) |
1 (1.00) |
0.815 (1.00) |
0.0423 (1.00) |
0.287 (1.00) |
| MAPK1 | 4 (1%) | 302 |
0.434 (1.00) |
0.292 (1.00) |
0.553 (1.00) |
0.514 (1.00) |
0.562 (1.00) |
1 (1.00) |
0.576 (1.00) |
0.993 (1.00) |
||
| EPB41L3 | 16 (5%) | 290 |
0.861 (1.00) |
0.84 (1.00) |
0.666 (1.00) |
0.846 (1.00) |
0.874 (1.00) |
0.153 (1.00) |
1 (1.00) |
0.372 (1.00) |
0.649 (1.00) |
0.0417 (1.00) |
| RAC1 | 9 (3%) | 297 |
0.627 (1.00) |
0.00647 (1.00) |
0.557 (1.00) |
0.412 (1.00) |
0.217 (1.00) |
0.0676 (1.00) |
1 (1.00) |
0.732 (1.00) |
0.00478 (1.00) |
0.0293 (1.00) |
| CUL3 | 10 (3%) | 296 |
0.526 (1.00) |
0.473 (1.00) |
0.364 (1.00) |
0.0875 (1.00) |
0.423 (1.00) |
0.733 (1.00) |
0.137 (1.00) |
0.541 (1.00) |
0.195 (1.00) |
0.984 (1.00) |
| PRB1 | 7 (2%) | 299 |
0.424 (1.00) |
0.528 (1.00) |
0.683 (1.00) |
0.618 (1.00) |
0.459 (1.00) |
0.196 (1.00) |
0.0825 (1.00) |
0.255 (1.00) |
0.866 (1.00) |
0.981 (1.00) |
| TRPV4 | 7 (2%) | 299 |
0.0884 (1.00) |
0.786 (1.00) |
0.917 (1.00) |
1 (1.00) |
0.302 (1.00) |
0.678 (1.00) |
0.0825 (1.00) |
0.718 (1.00) |
0.606 (1.00) |
|
| EPDR1 | 6 (2%) | 300 |
0.438 (1.00) |
0.805 (1.00) |
0.67 (1.00) |
0.587 (1.00) |
0.268 (1.00) |
0.668 (1.00) |
0.657 (1.00) |
0.905 (1.00) |
0.167 (1.00) |
0.326 (1.00) |
| SLC26A7 | 8 (3%) | 298 |
0.309 (1.00) |
0.125 (1.00) |
0.35 (1.00) |
0.701 (1.00) |
0.688 (1.00) |
0.689 (1.00) |
0.44 (1.00) |
0.232 (1.00) |
0.135 (1.00) |
0.0282 (1.00) |
| KCNA3 | 8 (3%) | 298 |
0.241 (1.00) |
0.2 (1.00) |
0.474 (1.00) |
0.568 (1.00) |
1 (1.00) |
0.222 (1.00) |
1 (1.00) |
0.79 (1.00) |
0.528 (1.00) |
0.502 (1.00) |
| HIST1H1B | 7 (2%) | 299 |
0.25 (1.00) |
0.0857 (1.00) |
0.223 (1.00) |
0.898 (1.00) |
0.131 (1.00) |
0.398 (1.00) |
0.68 (1.00) |
0.496 (1.00) |
||
| STEAP4 | 10 (3%) | 296 |
0.244 (1.00) |
0.981 (1.00) |
0.768 (1.00) |
0.13 (1.00) |
1 (1.00) |
0.295 (1.00) |
1 (1.00) |
0.0376 (1.00) |
0.36 (1.00) |
0.669 (1.00) |
P value = 1.61e-05 (logrank test), Q value = 0.0055
Table S1. Gene #4: 'TP53 MUTATION STATUS' versus Clinical Feature #1: 'Time to Death'
| nPatients | nDeath | Duration Range (Median), Month | |
|---|---|---|---|
| ALL | 304 | 133 | 0.1 - 211.0 (18.0) |
| TP53 MUTATED | 212 | 107 | 0.1 - 142.5 (16.7) |
| TP53 WILD-TYPE | 92 | 26 | 0.8 - 211.0 (25.2) |
Figure S1. Get High-res Image Gene #4: 'TP53 MUTATION STATUS' versus Clinical Feature #1: 'Time to Death'
P value = 0.000733 (Fisher's exact test), Q value = 0.25
Table S2. Gene #7: 'NSD1 MUTATION STATUS' versus Clinical Feature #5: 'PATHOLOGY.N.STAGE'
| nPatients | N0 | N1 | N2 | N3 |
|---|---|---|---|---|
| ALL | 99 | 33 | 99 | 5 |
| NSD1 MUTATED | 18 | 4 | 2 | 1 |
| NSD1 WILD-TYPE | 81 | 29 | 97 | 4 |
Figure S2. Get High-res Image Gene #7: 'NSD1 MUTATION STATUS' versus Clinical Feature #5: 'PATHOLOGY.N.STAGE'
P value = 0.000256 (t-test), Q value = 0.087
Table S3. Gene #7: 'NSD1 MUTATION STATUS' versus Clinical Feature #10: 'NUMBER.OF.LYMPH.NODES'
| nPatients | Mean (Std.Dev) | |
|---|---|---|
| ALL | 228 | 2.7 (5.3) |
| NSD1 MUTATED | 21 | 0.8 (1.8) |
| NSD1 WILD-TYPE | 207 | 2.9 (5.5) |
Figure S3. Get High-res Image Gene #7: 'NSD1 MUTATION STATUS' versus Clinical Feature #10: 'NUMBER.OF.LYMPH.NODES'
P value = 0.000302 (t-test), Q value = 0.1
Table S4. Gene #9: 'CASP8 MUTATION STATUS' versus Clinical Feature #2: 'AGE'
| nPatients | Mean (Std.Dev) | |
|---|---|---|
| ALL | 306 | 61.1 (12.1) |
| CASP8 MUTATED | 27 | 71.1 (13.4) |
| CASP8 WILD-TYPE | 279 | 60.2 (11.6) |
Figure S4. Get High-res Image Gene #9: 'CASP8 MUTATION STATUS' versus Clinical Feature #2: 'AGE'
-
Mutation data file = transformed.cor.cli.txt
-
Clinical data file = HNSC-TP.merged_data.txt
-
Number of patients = 306
-
Number of significantly mutated genes = 35
-
Number of selected clinical features = 10
-
Exclude genes that fewer than K tumors have mutations, K = 3
For survival clinical features, the Kaplan-Meier survival curves of tumors with and without gene mutations were plotted and the statistical significance P values were estimated by logrank test (Bland and Altman 2004) using the 'survdiff' function in R
For continuous numerical clinical features, two-tailed Student's t test with unequal variance (Lehmann and Romano 2005) was applied to compare the clinical values between tumors with and without gene mutations using 't.test' function in R
For multi-class clinical features (nominal or ordinal), Chi-square tests (Greenwood and Nikulin 1996) were used to estimate the P values using the 'chisq.test' function in R
For binary or multi-class clinical features (nominal or ordinal), two-tailed Fisher's exact tests (Fisher 1922) were used to estimate the P values using the 'fisher.test' function in R
For multiple hypothesis correction, Q value is the False Discovery Rate (FDR) analogue of the P value (Benjamini and Hochberg 1995), defined as the minimum FDR at which the test may be called significant. We used the 'Benjamini and Hochberg' method of 'p.adjust' function in R to convert P values into Q values.
In addition to the links below, the full results of the analysis summarized in this report can also be downloaded programmatically using firehose_get, or interactively from either the Broad GDAC website or TCGA Data Coordination Center Portal.